. 2023 Apr 4;131(3):503-519.
doi: 10.1093/aob/mcad003.

Variations in phenological, physiological, plant architectural and yield-related traits, their associations with grain yield and genetic basis

Affiliations

Variations in phenological, physiological, plant architectural and yield-related traits, their associations with grain yield and genetic basis

Yibo Li et al. Ann Bot. .

Abstract

Background and aims: Physiological and morphological traits play essential roles in wheat (Triticum aestivum) growth and development. In particular, photosynthesis is a limitation to yield. Increasing photosynthesis in wheat has been identified as an important strategy to increase yield. However, the genotypic variations and the genomic regions governing morphological, architectural and photosynthesis traits remain unexplored.

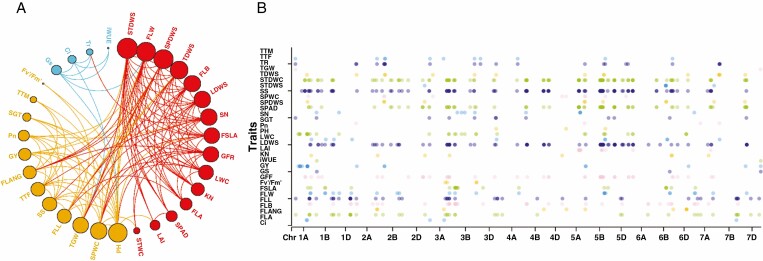
Methods: Here, we conducted a large-scale investigation of the phenological, physiological, plant architectural and yield-related traits, involving 32 traits for 166 wheat lines during 2018-2020 in four environments, and performed a genome-wide association study with wheat 90K and 660K single nucleotide polymorphism (SNP) arrays.

Key results: These traits exhibited considerable genotypic variations in the wheat diversity panel. Higher yield was associated with higher net photosynthetic rate (r = 0.41, P < 0.01), thousand-grain weight (r = 0.36, P < 0.01) and truncated and lanceolate shape, but shorter plant height (r = -0.63, P < 0.01), flag leaf angle (r = -0.49, P < 0.01) and spike number per square metre (r = -0.22, P < 0.01). Genome-wide association mapping discovered 1236 significant stable loci detected in the four environments among the 32 traits using SNP markers. Trait values have a cumulative effect as the number of the favourable alleles increases, and significant progress has been made in determining phenotypic values and favourable alleles over the years. Eleven elite cultivars and 14 traits associated with grain yield per plot (GY) were identified as potential parental lines and as target traits to develop high-yielding cultivars.

Conclusions: This study provides new insights into the phenotypic and genetic elucidation of physiological and morphological traits in wheat and their associations with GY, paving the way for discovering their underlying gene control and for developing enhanced ideotypes in wheat breeding.

Keywords: Triticum aestivum; Genetic variation; ideotypes; photosynthetic traits; yield potential.


Figures

Fig. 1.
Fig. 1.
Random forest analysis predictors of grain yield (A) and TGW (B) in 209 wheat cultivars. The relative importance of each predictor is ranked in order and presented for GY (A) and TGW (B). Arrow colours indicate the direction of correlation (blue, positive; red, negative) for the continuous variables. The values represent the contribution of the trait grain yield or TGW. LWC, leaf water content; SPWC, spike water content; STWC, stem water content; LDWS, leaf dry weights; Pn, light-saturated net photosynthetic rate; Tr, transpiration rate; Ci, intercellular CO2 concentration; iWUE, intrinsic water use efficiency; PH, plant height; LAI, leaf area index; SGT, stay green trait; TTF, thermal time from sowing to flowering stage; TTM, thermal time from sowing to maturity stage; SS, spike shape; FLL, flag leaf length; FLW, flag leaf width; FSLA, flag leaf specific leaf area; FLANG, flag leaf angle; SPAD, chlorophyll content SPAD meter reading; SN, spike number per square meter; TGW, thousand-grain weight; GY, grain yield.
Fig. 2.
Fig. 2.
(A) Population structure of 166 wheat accessions revealed by principal component (top left), neighbour-joining tree (bottom left) and kinship (right) analyses. (B) Linkage disequilibrium (LD) decay across the whole genome and A, B and D sub-genomes and (C) distribution of SNPs with minor allele frequency >0.05 and missing data <80 %.
Fig. 3.
Fig. 3.
Manhattan plots for a genome-wide association study of the traits for GY and TGW in 166 wheat accessions under multiple environments. PH, plant height; SS, spike shape; Pn, light-saturated net photosynthetic rate; SPAD, chlorophyll content SPAD meter reading; FLW, flag leaf width; LWC, leaf water content; TGW, thousand-grain weight; GY, grain yield.
Fig. 4.
Fig. 4.
The pleiotropic loci for traits of both traits controlled by the same SNP (A) and the position of pleiotropic loci (B). LWC, leaf water content; SPWC, spike water content; STWC, stem water content; LDWS, leaf dry weights; SPDWS, spike dry weights; STDWS, stem dry weights; TDWS, total dry weights; Pn, light-saturated net photosynthetic rate; Gs, stomatal conductance; Tr, transpiration rate; Ci, intercellular CO2 concentration; WUE, water use efficiency; iWUE, intrinsic water use efficiency; Fvʹ/Fmʹ, maximum quantum yield of PSII photochemistry; PH, plant height; LAI, leaf area index; GFR, grain filling rate; SGT, stay green trait; TTF, thermal time from sowing to flowering stage; TTM, thermal time from sowing to maturity stage; SS, spike shape; FLL, flag leaf length; FLW, flag leaf width; FLA, flag leaf area; FLB, flag leaf biomass; FSLA, flag leaf specific leaf area; FLANG, flag leaf angle; SPAD, chlorophyll content SPAD meter reading; SN, spike number per square metre; KN, kernel number per spike; TGW, thousand-grain weight; GY, grain yield.
Fig. 5.
Fig. 5.
Effect and distribution of favourable alleles of trait-associated markers contributing significantly to GY and TGW. PH, plant height; SS, spike shape; Pn, light-saturated net photosynthetic rate; SPAD, chlorophyll content SPAD meter reading; FLW, flag leaf width; LWC, leaf water content; TGW, thousand-grain weight; GY, grain yield.
Fig. 6.
Fig. 6.
Genetic progress of the traits contributing significantly to GY and TGW. Violin plots A–H, phenotypic changes in PH, FLW, SS, LWC, Pn, TGW, SPAD and GY, respectively; I–P, changes in number of increasing-effect alleles for PH, FLW, SS, LWC, Pn, TGW, SPAD and GY, respectively. PH, plant height; SS, spike shape; Pn, light-saturated net photosynthetic rate; SPAD, chlorophyll content SPAD meter reading; FLW, flag leaf width; LWC, leaf water content; TGW, thousand-grain weight; GY, grain yield. Different lowercase letters indicate significantly different at 0.05 level.
Fig. 7.
Fig. 7.
Clustering of 166 wheat cultivars using a self-organizing map (SOM) algorithm (A) and the matrices of components (B). LWC, leaf water content; SPWC, spike water content; STWC, stem water content; LDWS, leaf dry weights; SPDWS, spike dry weights; STDWS, stem dry weights; TDWS, total dry weights; Pn, light-saturated net photosynthetic rate; Gs, stomatal conductance; Tr, transpiration rate; Ci, intercellular CO2 concentration; WUE, water use efficiency; iWUE, intrinsic water use efficiency; Fvʹ/Fmʹ, maximum quantum yield of PSII photochemistry; PH, plant height; LAI, leaf area index; GFR, grain filling rate; SGT, stay green trait; TTF, thermal time from sowing to flowering stage; TTM, thermal time from sowing to maturity stage; SS, spike shape; FLL, flag leaf length; FLW, flag leaf width; FLA, flag leaf area; FLB, flag leaf biomass; FSLA, flag leaf specific leaf area; FLANG, flag leaf angle; SPAD, Chlorophyll content SPAD meter reading; SN, spike number per square meter; KN, kernel number per spike; TGW, thousand-grain weight; GY, grain yield.

References

    1. Abbai R, Singh V, Snowdon R, Kumar A, Schnurbusch T.. 2020. Seeking crops with balanced parts for the ideal whole. Trends in Plant Science 25: 1189–1193. - PubMed
    1. Adachi S, Tsuru Y, Nito N, et al. . 2011. Identification and characterization of genomic regions on chromosomes 4 and 8 that control the rate of photosynthesis in rice leaves. Journal of Experimental Botany 62: 1927–1938. - PMC - PubMed
    1. Arif MAR, Nagel N, Newmann K, Kobiljski B, Lohwasser U, Borner A.. 2012. Genetic studies of seed longevity in hexaploid wheat using segregation and association mapping approaches. Euphytica 1869: 1–13.
    1. Azadi A, Mardi M, Hervan EM, et al. . 2015. QTL mapping of yield and yield components under normal and salt-stress conditions in bread wheat (Triticum aestivum L.). Plant Molecular Biology Reporter 33: 102–120.
    1. Backhaus AE, Lister A, Tomkins M, et al. . 2022. High expression of the MADS-box gene VRT2 increases the number of rudimentary basal spikelets in wheat. Plant Physiology 189: 1536–1552. doi:10.1093/plphys/kiac156. - DOI - PMC - PubMed

Publication types