. 2023 Jun;89(6):2171-2185.
doi: 10.1002/mrm.29587. Epub 2023 Jan 19.

Simultaneous proton resonance frequency T1 - MR shear wave elastography for MR-guided focused ultrasound multiparametric treatment monitoring

Affiliations

Simultaneous proton resonance frequency T1 - MR shear wave elastography for MR-guided focused ultrasound multiparametric treatment monitoring

Henrik Odéen et al. Magn Reson Med. 2023 Jun.

Abstract

Purpose: To develop an efficient MRI pulse sequence to simultaneously measure multiple parameters that have been shown to correlate with tissue nonviability following thermal therapies.

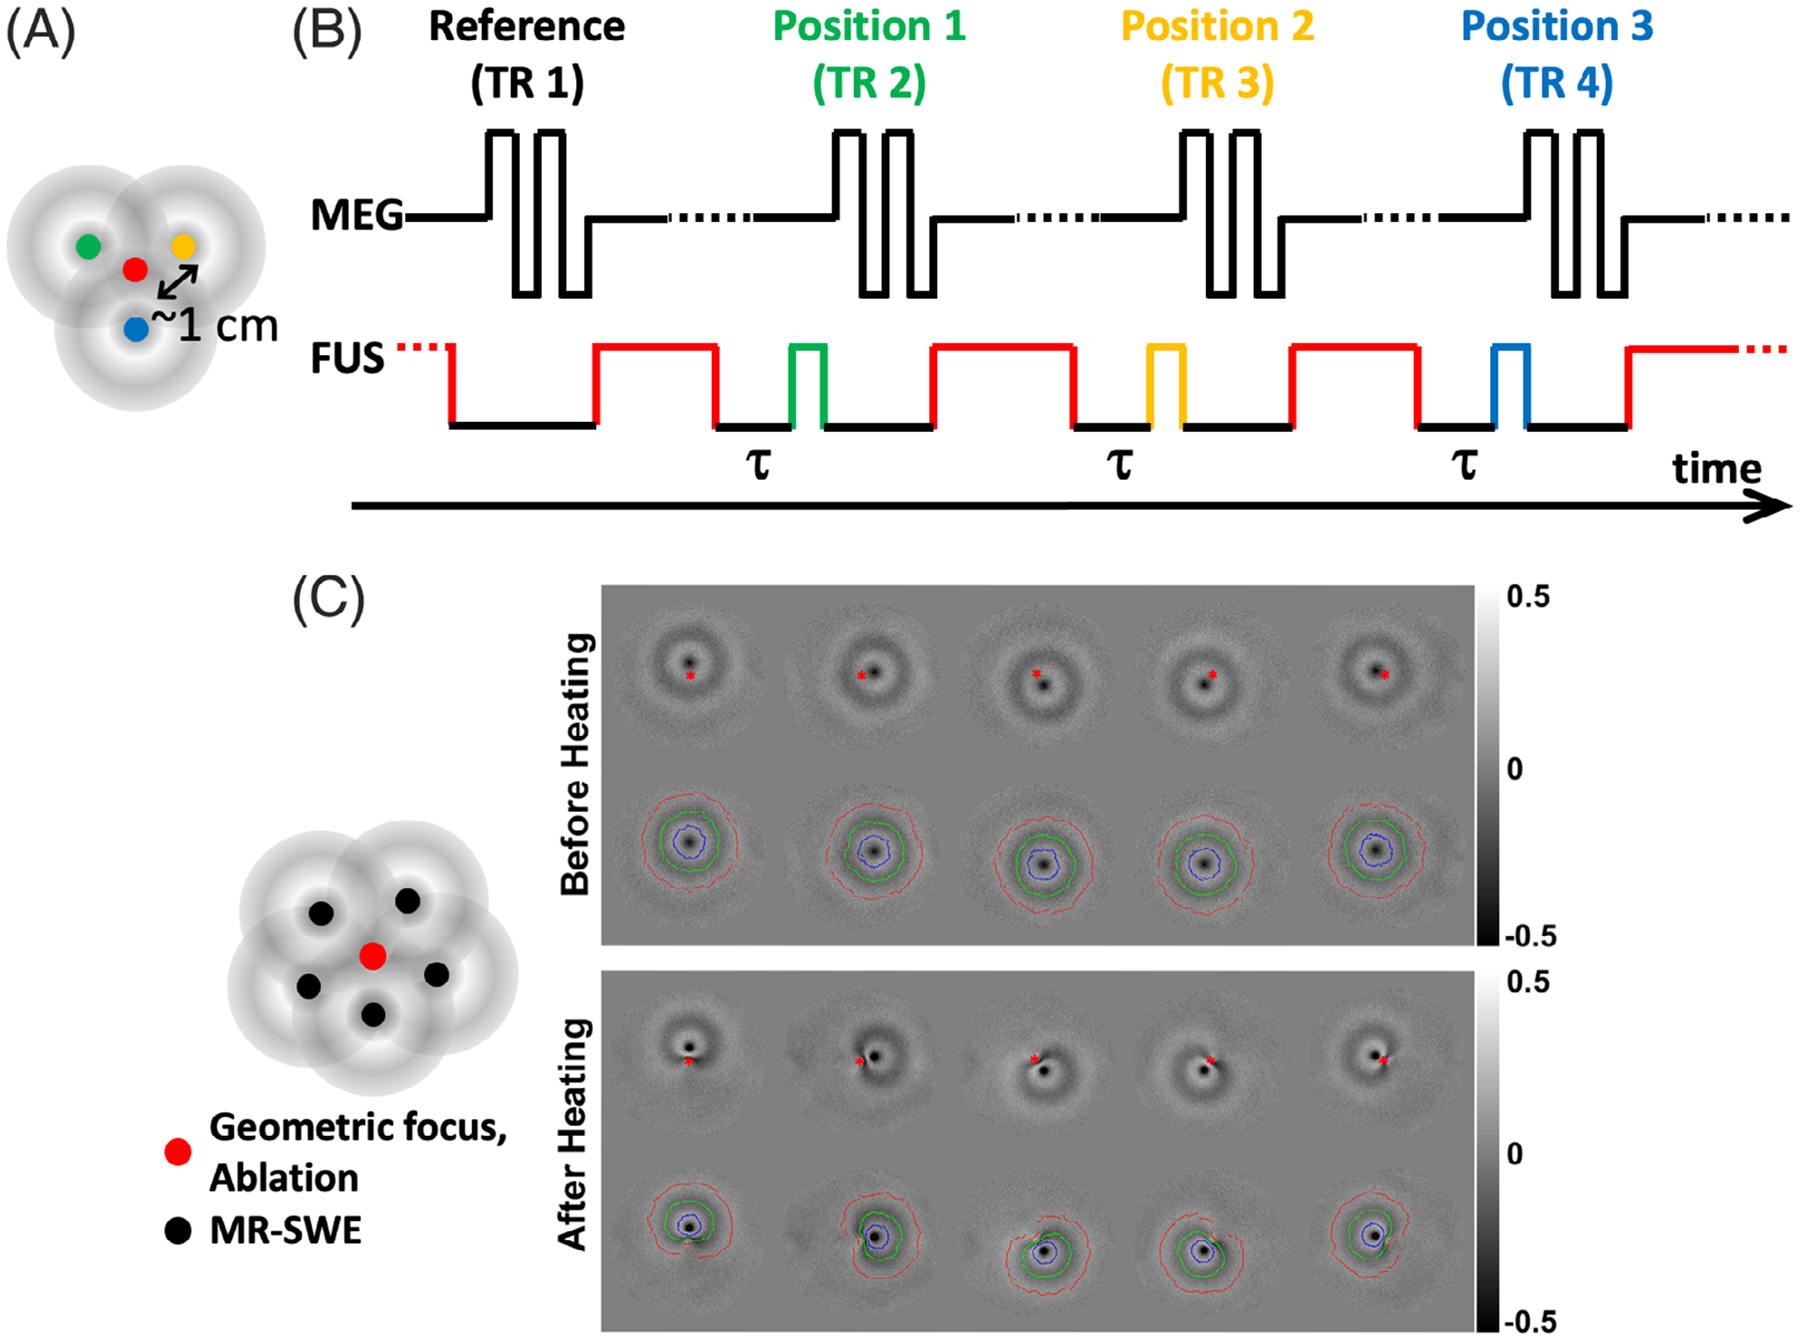
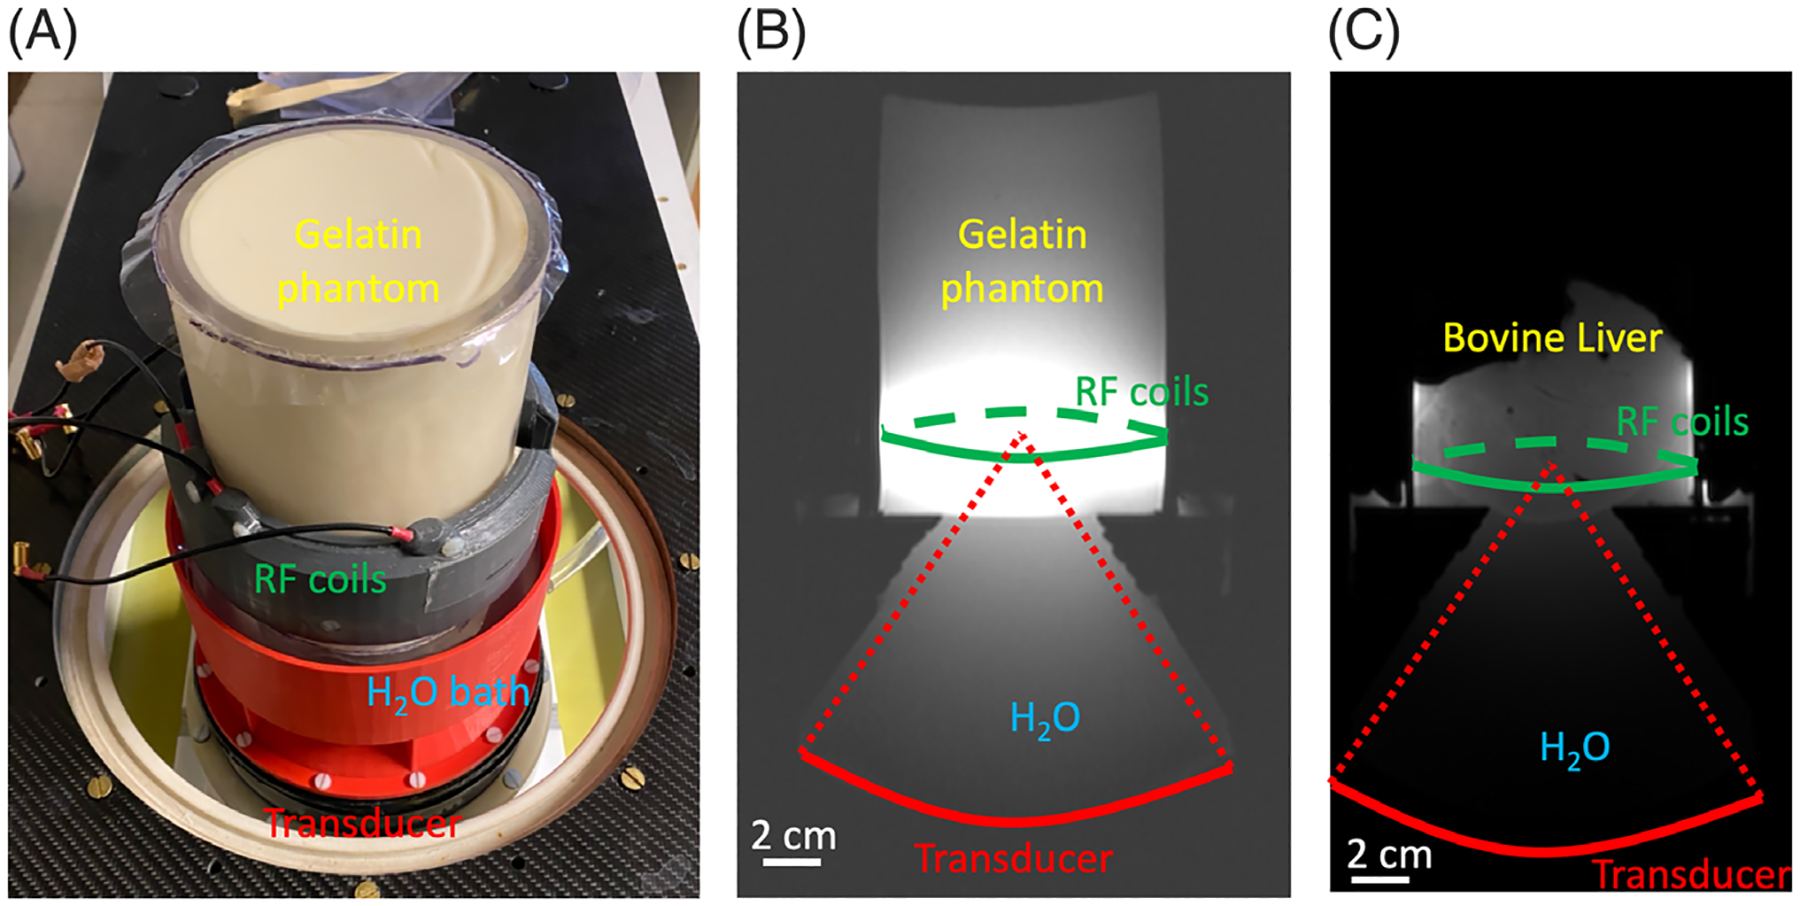
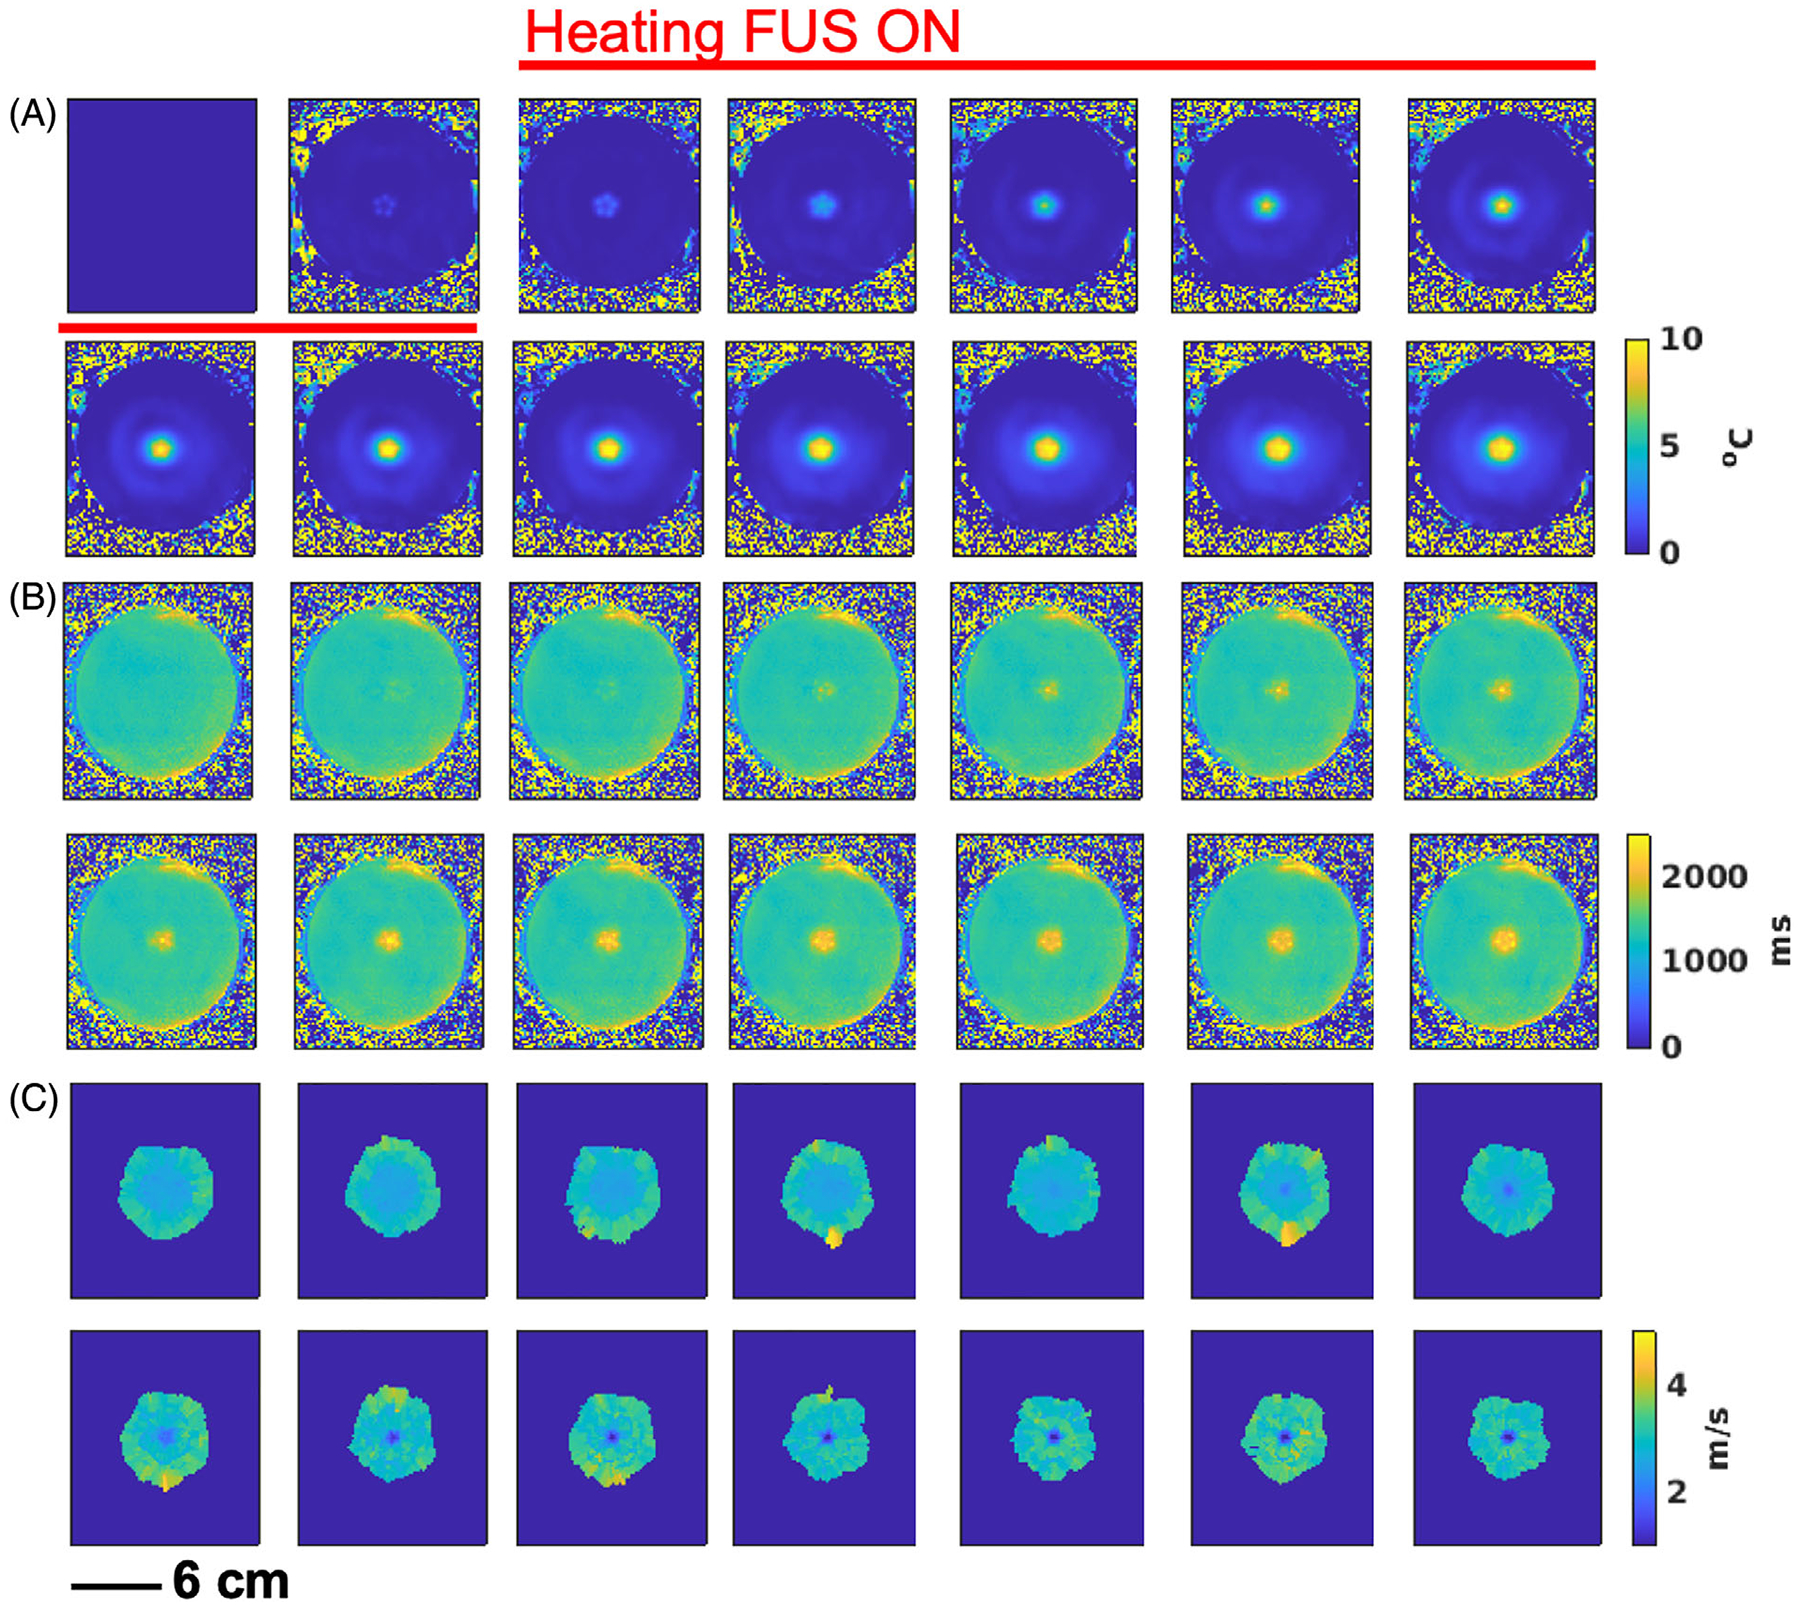
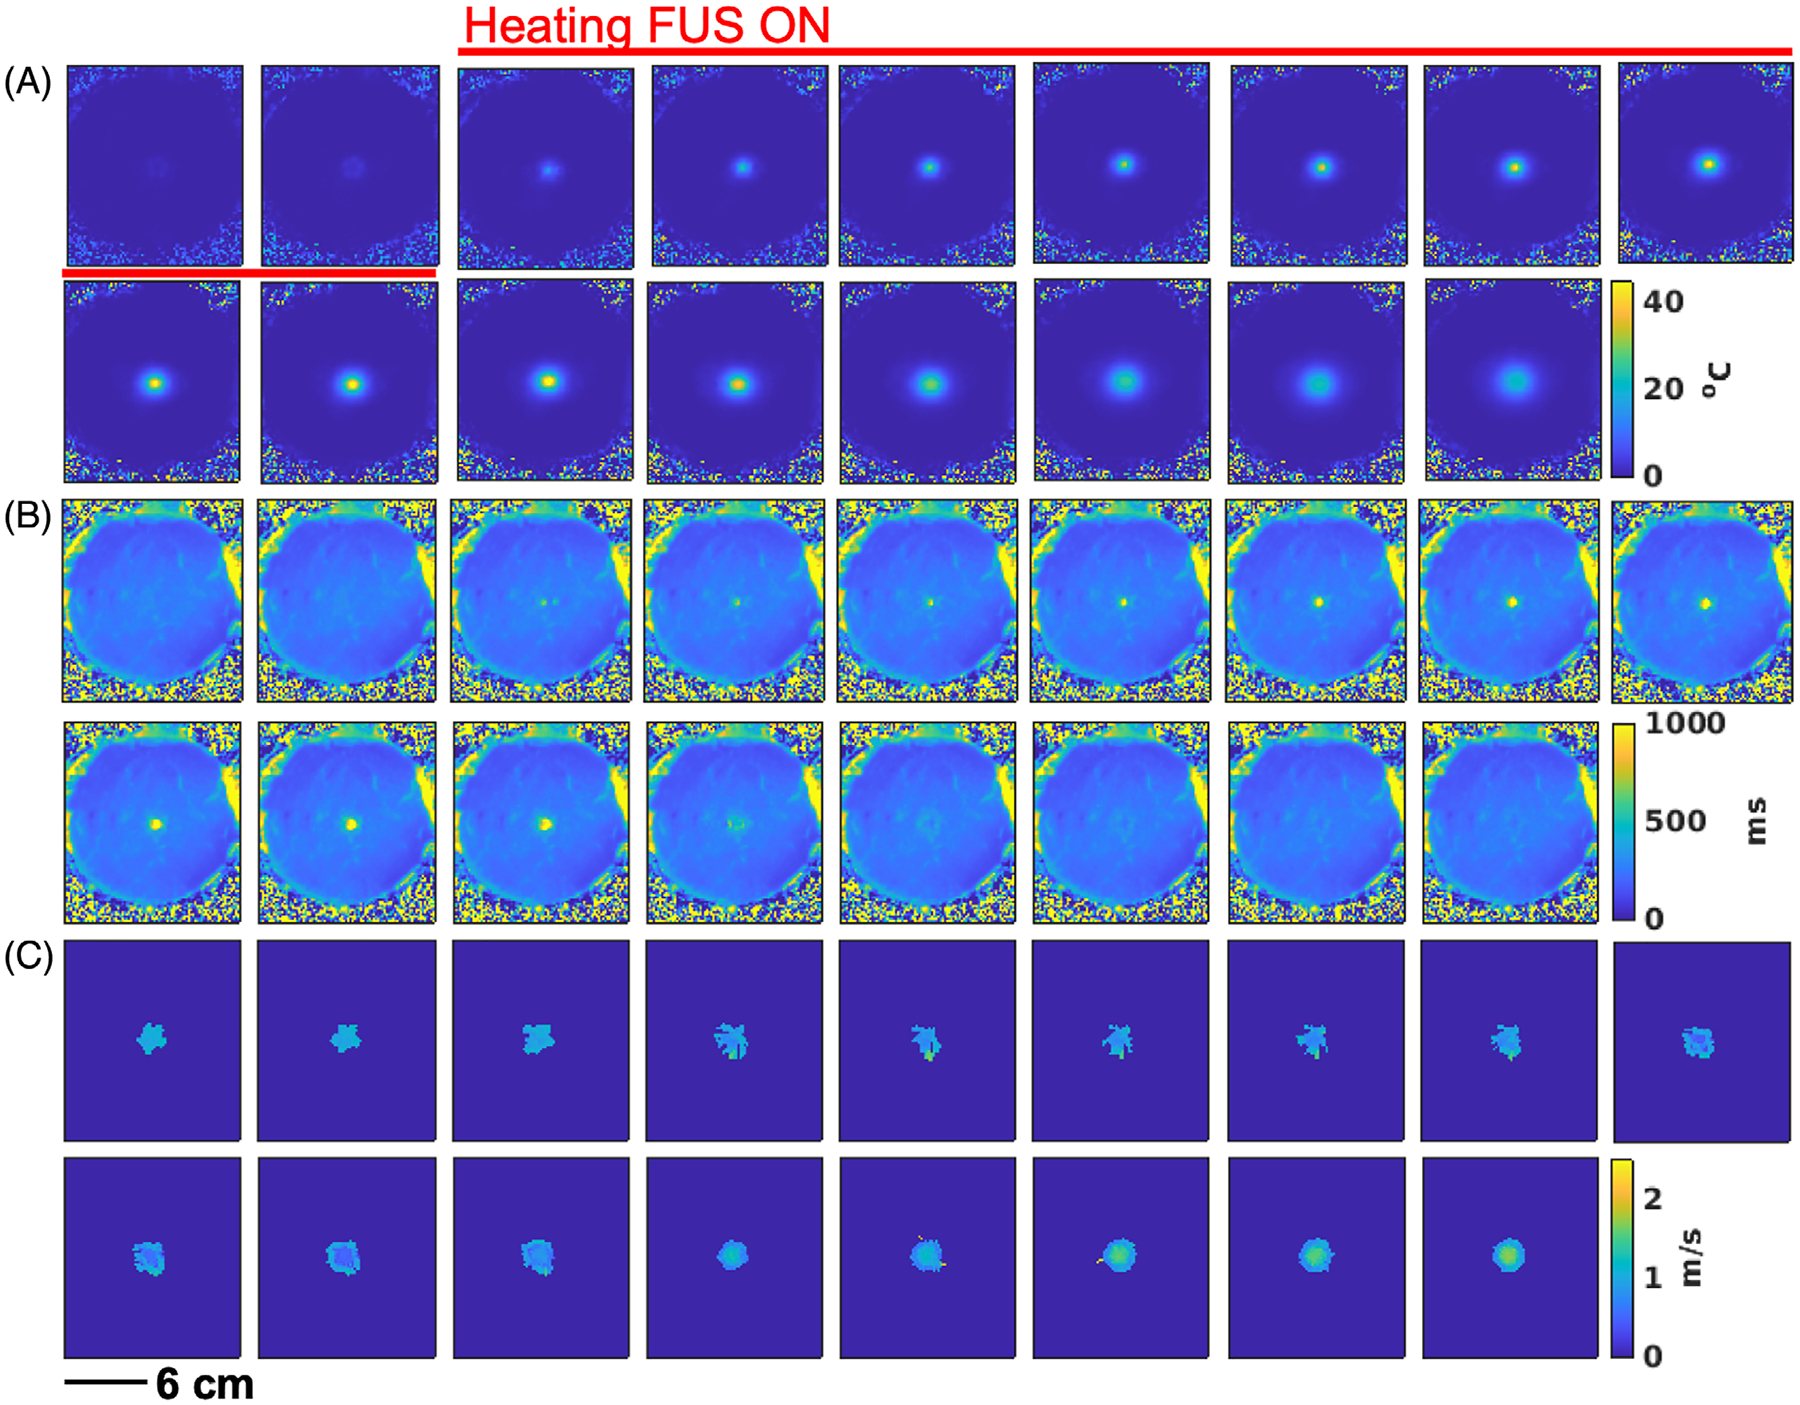
Methods: A 3D segmented EPI pulse sequence was used to simultaneously measure proton resonance frequency shift (PRFS) MR thermometry (MRT), T1 relaxation time, and shear wave velocity induced by focused ultrasound (FUS) push pulses. Experiments were performed in tissue mimicking gelatin phantoms and ex vivo bovine liver. Using a carefully designed FUS triggering scheme, a heating duty cycle of approximately 65% was achieved by interleaving FUS ablation pulses with FUS push pulses to induce shear waves in the tissue.

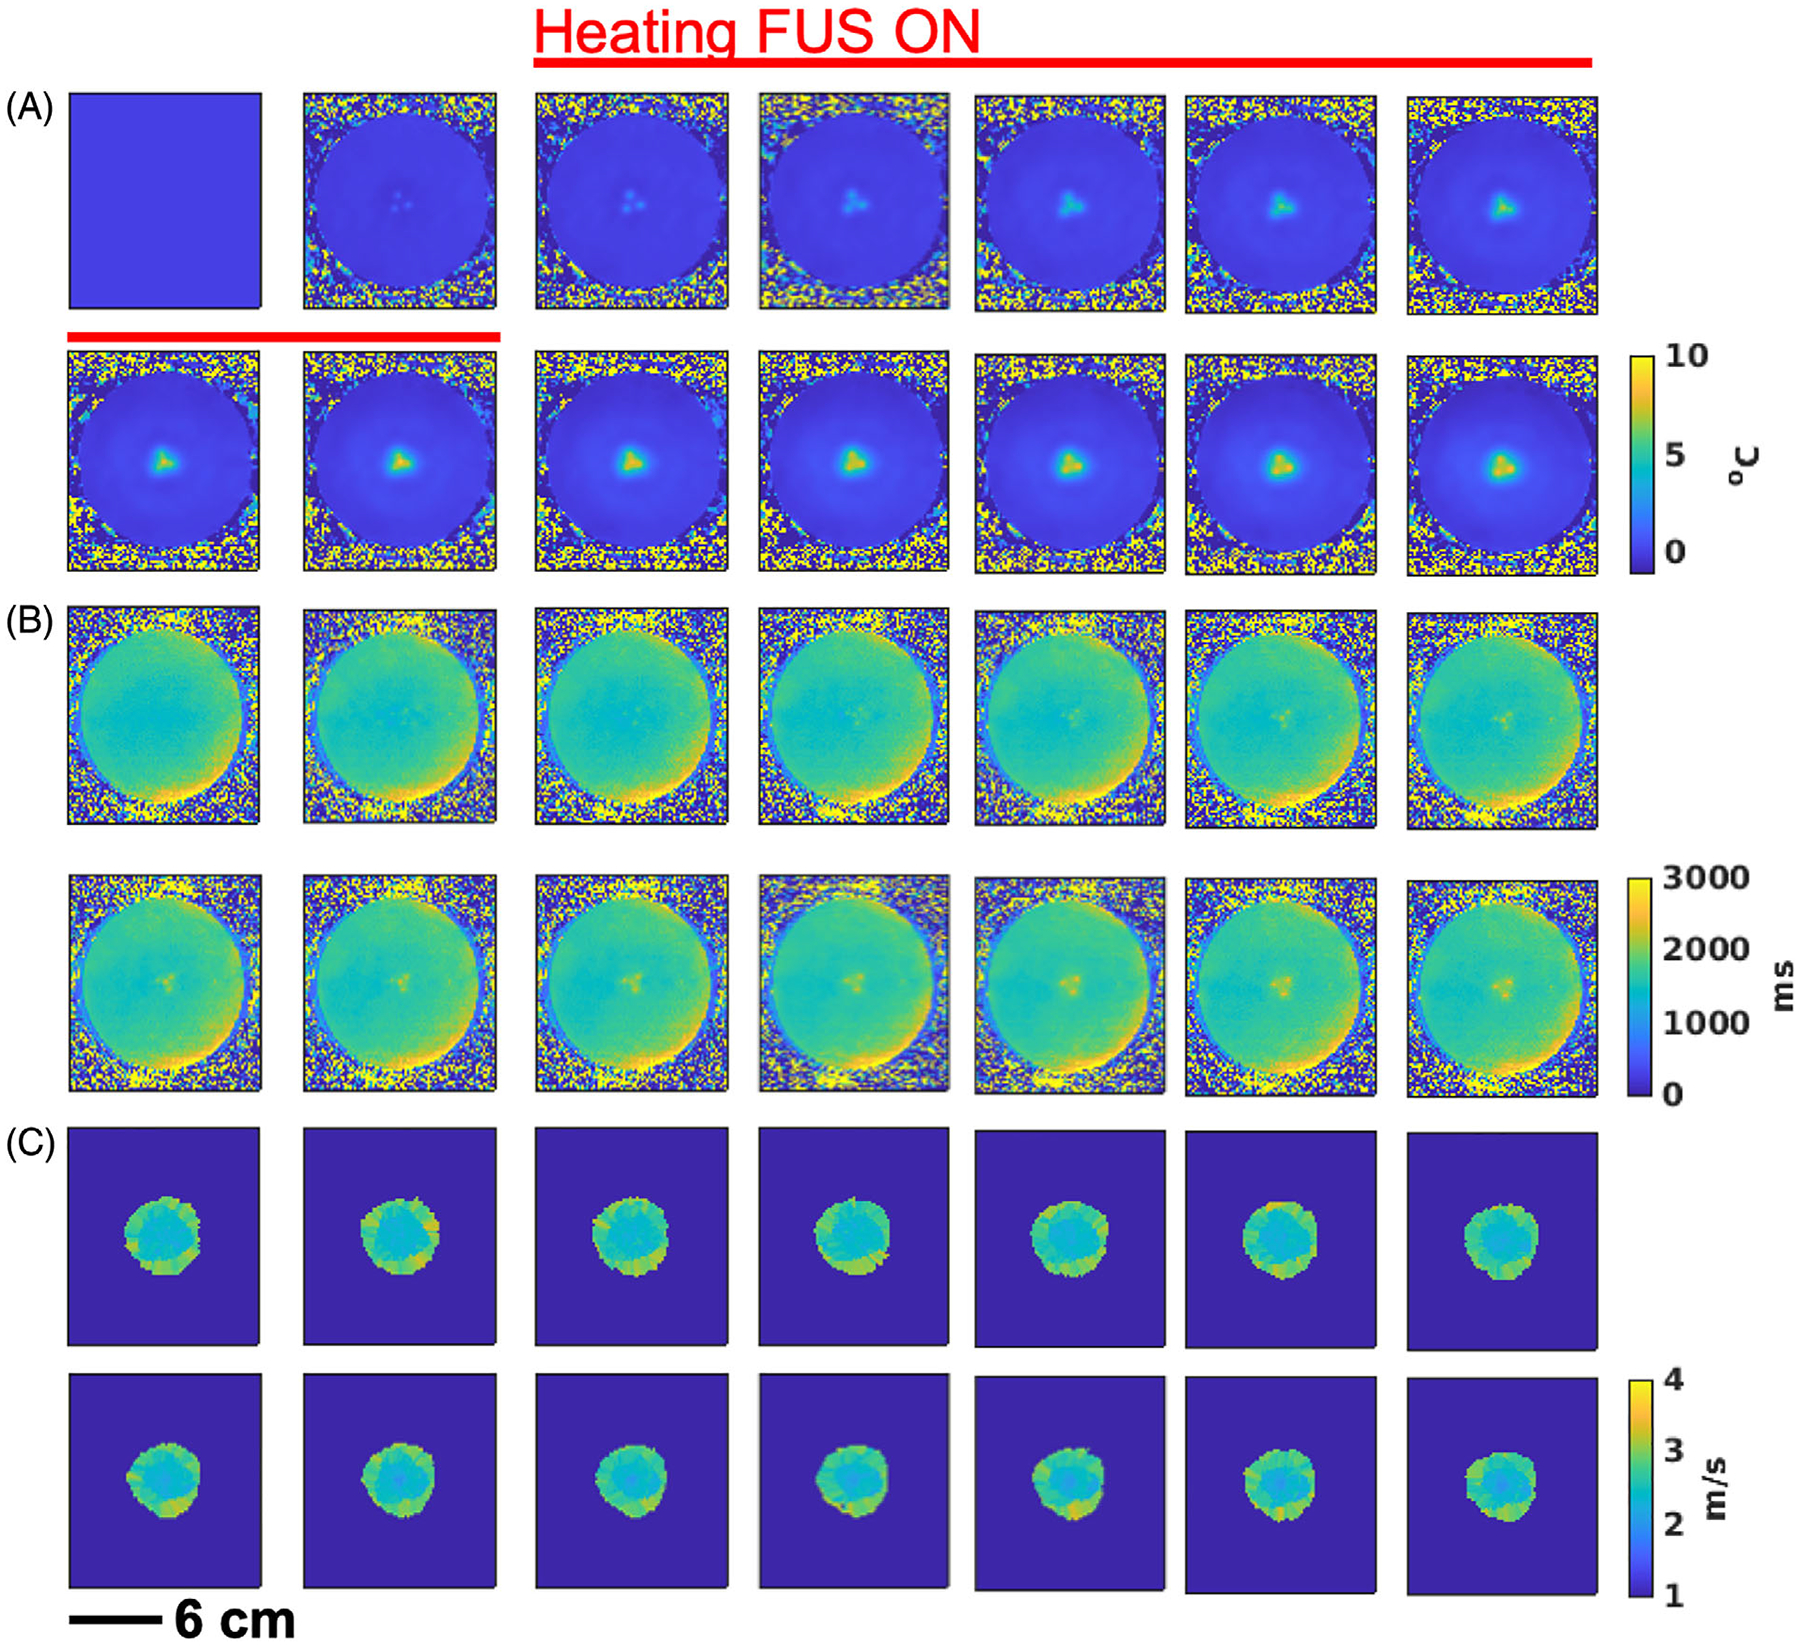
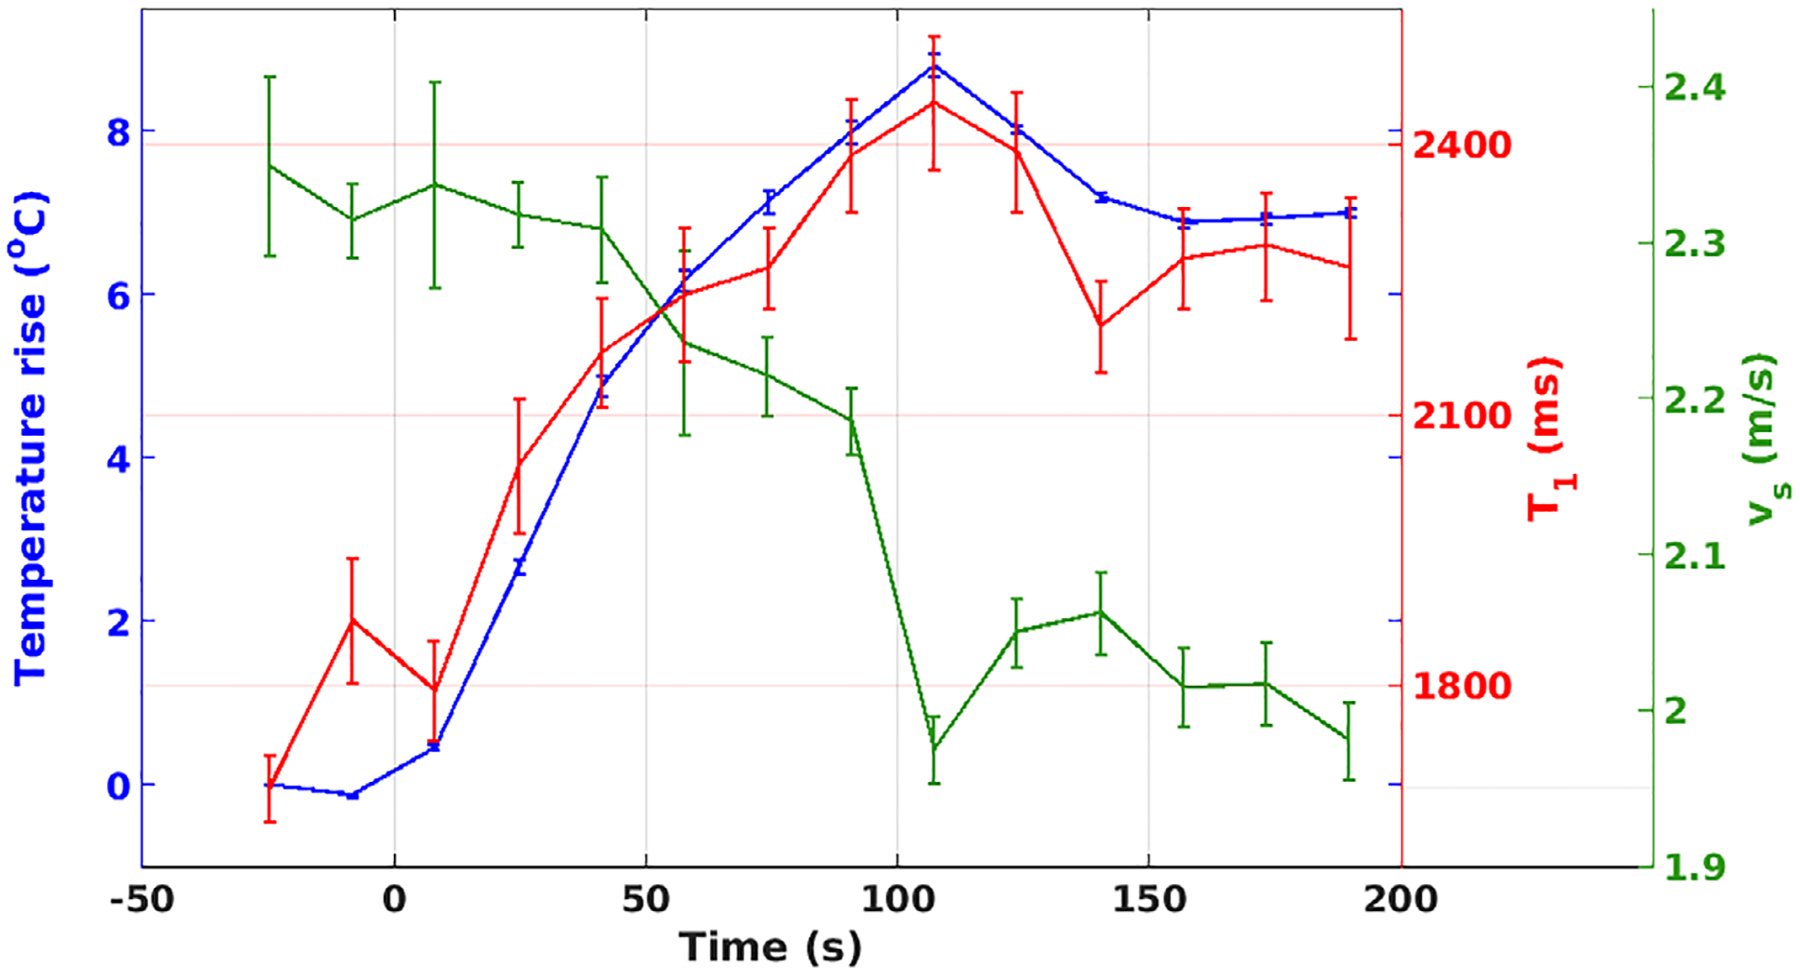
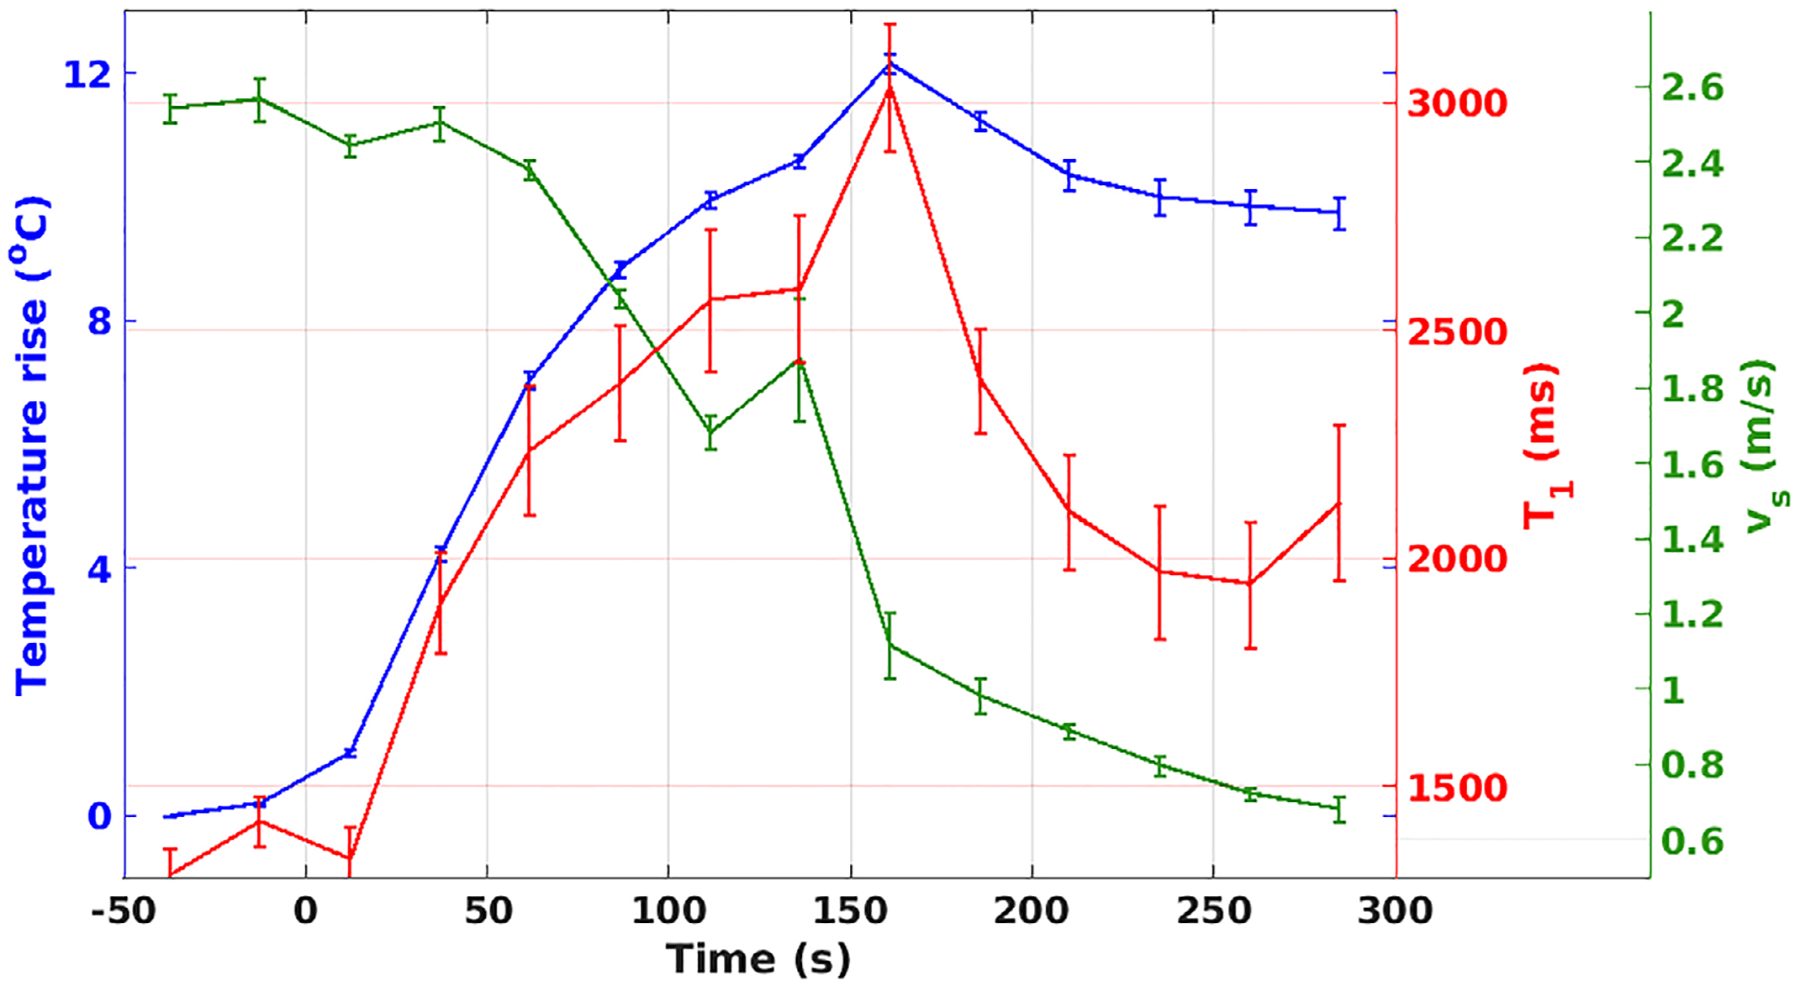
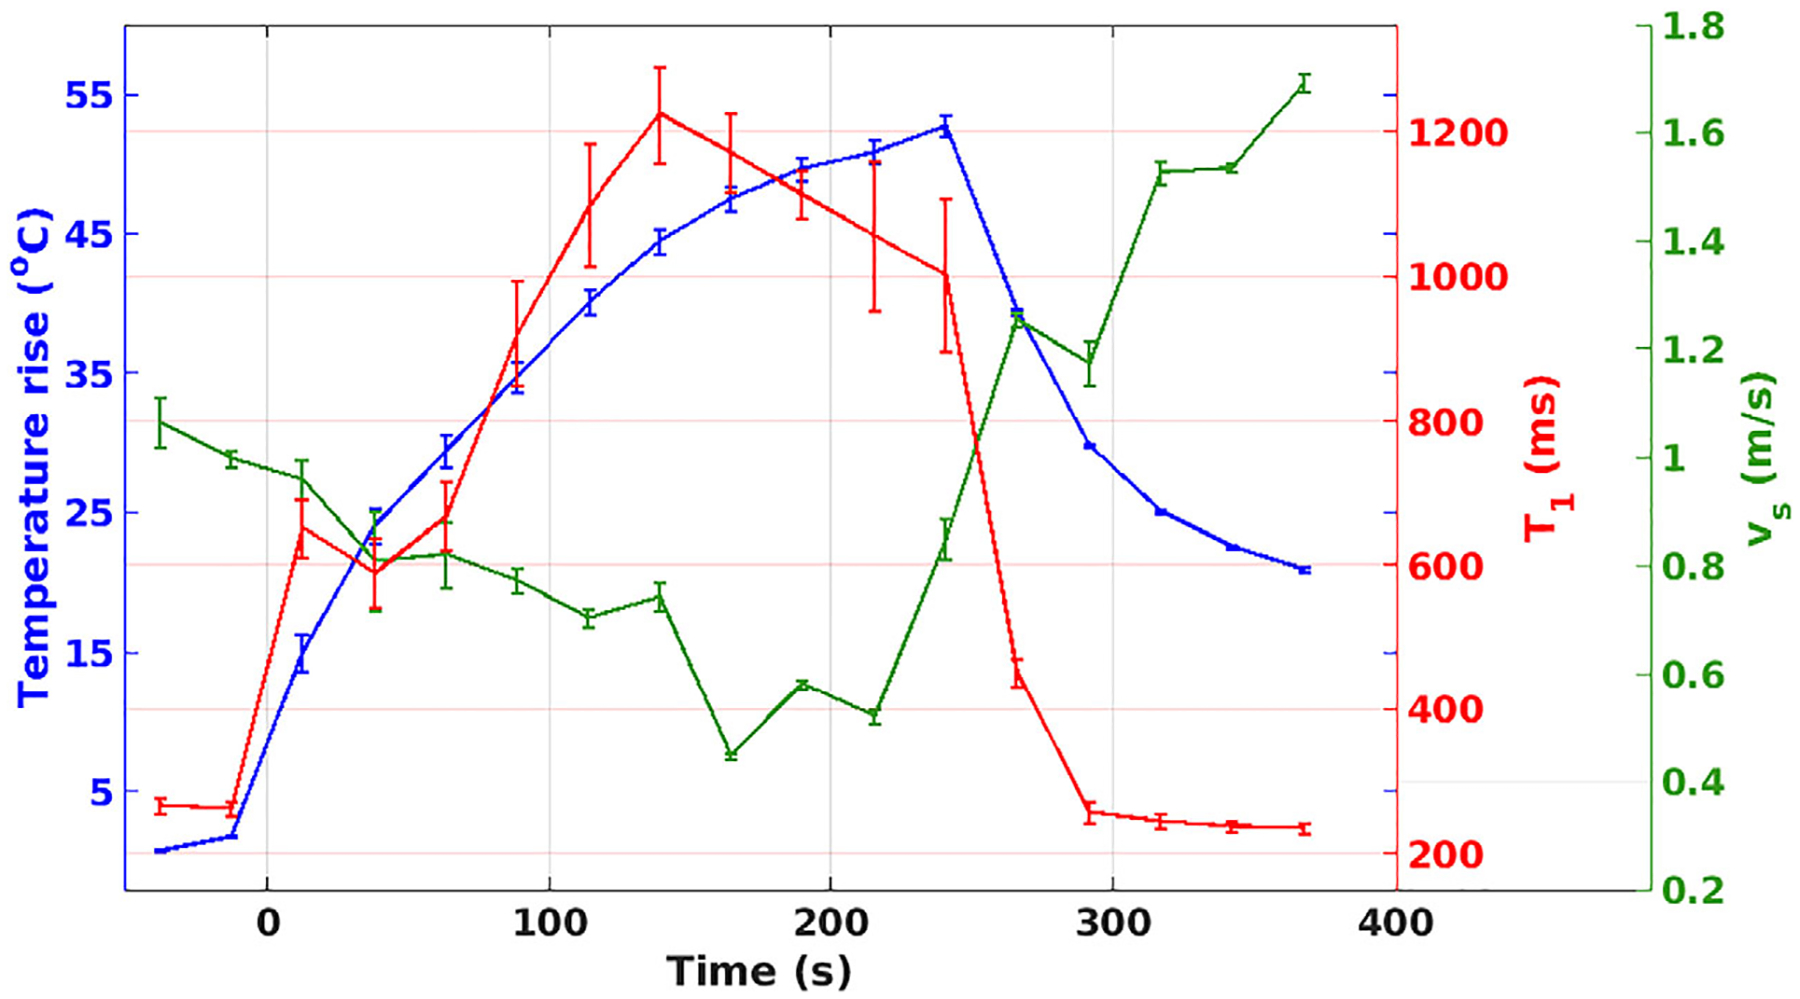
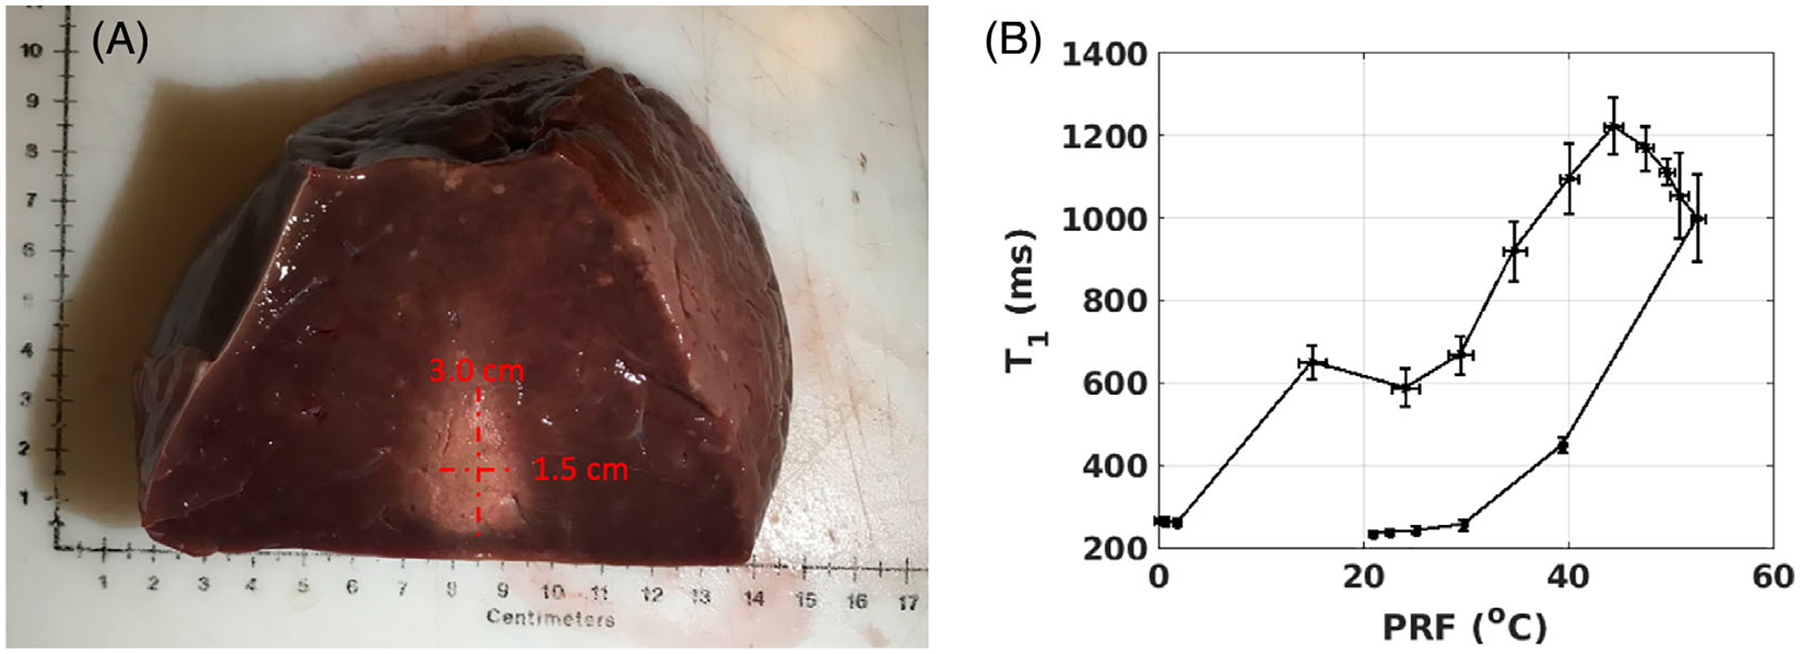
Results: In phantom studies, temperature increases measured with PRFS MRT and increases in T1 correlated with decreased shear wave velocity, consistent with material softening with increasing temperature. During ablation in ex vivo liver, temperature increase measured with PRFS MRT initially correlated with increasing T1 and decreasing shear wave velocity, and after tissue coagulation with decreasing T1 and increasing shear wave velocity. This is consistent with a previously described hysteresis in T1 versus PRFS curves and increased tissue stiffness with tissue coagulation.

Conclusion: An efficient approach for simultaneous and dynamic measurements of PRSF, T1 , and shear wave velocity during treatment is presented. This approach holds promise for providing co-registered dynamic measures of multiple parameters, which correlates to tissue nonviability during and following thermal therapies, such as FUS.

Keywords: T1; focused ultrasound; proton resonance frequency shift; shear-wave elastography; shear-wave velocity.


Figures

FIGURE 1
FIGURE 1
A, Schematic of the motion-encoding gradient (MEG) and focused ultrasound (FUS) interleaving scheme for a three-point experiment. The red dot indicates geometric focus, where ablation was induced. The three MR shear wave elastography (SWE) positions (green, yellow, and blue, respectively) are interleaved with the reference image on a TR basis. The red waveform indicates when FUS energy is applied at the geometric focus to induce ablation. B, Schematic of a five-point experiment and corresponding phase maps from a phantom experiment. The red dot in the schematics (left) indicates the geometric focus where the ablation was applied, and this is color-coded to the red asterisk in the raw phase maps (right). Raw phase maps and phase maps with the automatically detected wavefronts are shown both before heating (right, top two rows) and after heating (right, bottom two rows). In the automatically detected wavefronts, the blue line indicates the first wave front (i.e., closest to the spatial position where the push pulse was applied, encoded by the second MEG lobe); the green line indicates the second wave front (encoded by the third MEG lobe); and the red line indicates the third wavefront (encoded by the fourth MEG lobe). Note that, before heating, the phantom stiffness is homogenous and concentric wave fronts are encoded. After heating, the stiffness where focal heating was applied is decreased, resulting in slower shear wave speed and the wave fronts “bunching up” in that spatial region
FIGURE 2
FIGURE 2
Experimental setup. A, The phased array transducer (black) is at the bottom with a 3D-printed “cone” (red) to contain the water bath on top, which provides acoustic coupling. The five-channel RF coil (gray) surrounds the gelatin phantom. B, Labeled sagittal MRI of the gelatin phantom setup. C, Labeled sagittal MRI of the liver experiment setup
FIGURE 3
FIGURE 3
The slice of the maximum temperature rises as a function of time for proton resonance frequency shift (PRFS) (A), T1 (B), and MR-SWE (C) for the three-point MR-SWE phantom experiment. The red bar over the PRFS maps indicates during which dynamics the heating FUS pulses were applied. The PRFS temperature is shown to increase in the three locations of the MR-SWE pulses before the start of the heating FUS pulse due to power deposited by the MR-SWE FUS pulses. The black bar in the bottom left indicates 6 cm
FIGURE 4
FIGURE 4
Line plots of PRFS temperature rise, T1, and MR-SWE as a function of time for the voxels experiencing the largest temperature rise in Figure 3. Mean ± SD over a 3 × 3 voxel region of interest (ROI) is shown for all plots
FIGURE 5
FIGURE 5
The slice of the maximum temperature rise as a function of time for PRFS (A), T1 (B), and MR-SWE (C) for the five-point MR-SWE phantom experiment. The red bar over the PRFS maps indicates during which dynamics the heating FUS pulses were applied. The PRFS temperature is shown to increase in the five locations of the MR-SWE pulses before the start of the heating FUS pulse due to power deposited by the MR-SWE FUS pulses. The black bar in the bottom left indicates 6 cm
FIGURE 6
FIGURE 6
Line plots of PRFS temperature rise, T1, and MR-SWE shear wave speed as a function of time for the voxels experiencing the largest temperature rise in Figure 5. Mean ± SD over a 3 × 3 voxel ROI is shown for all plots
FIGURE 7
FIGURE 7
Proton resonance frequency (PRF) (A), T1 (B), and MR-SWE (C) maps as a function of time for the liver experiment with five MR-SWE pulses. The black bar in the bottom left indicates 6 cm
FIGURE 8
FIGURE 8
Line plots of PRFS temperature rise, T1, and MR-SWE shear wave speed as a function of time for the voxels experiencing the largest temperature rise in Figure 7. Mean ± SD over a 3 × 3 voxel ROI is shown for all plots
FIGURE 9
FIGURE 9
A, Grossly sliced liver post sonication showing ablated region. B, Absolute T1 plotted as a function of change in temperature from the PRFS measurement. The mean ± SD of the same 3 × 3 voxel ROI as used in Figure 8 is shown here

Similar articles

Cited by

References

    1. Deckers R, Merckel LG, de Senneville BD, et al. Performance analysis of a dedicated breast MR-HIFU system for tumor ablation in breast cancer patients. Phys Med Biol. 2015;60:5527–5542. - PubMed
    1. Ghanouni P, Pauly KB, Elias WJ, et al. Transcranial MRI-guided focused ultrasound: a review of the technologic and neurologic applications. Am J Roentgenol. 2015;205:150–159. doi:10.2214/AJR.14.13632 - DOI - PMC - PubMed
    1. Khanna N, Gandhi D, Steven A, Frenkel V, Melhem ER. Intracranial applications of MR imaging-guided focused ultrasound. Am J Neuroradiol. 2017;38:426–431. doi:10.3174/ajnr.A4902 - DOI - PMC - PubMed
    1. Jacoby VL, Kohi MP, Poder L, et al. PROMISe trial: a pilot, randomized, placebo-controlled trial of magnetic resonance guided focused ultrasound for uterine fibroids. Fertil Steril. 2016;105:773–780. doi:10.1016/j.fertnstert.2015.11.014 - DOI - PubMed
    1. Tay KJ, Cheng CWS, Lau WKO, Khoo J, Thng CH, Kwek JW. Focal therapy for prostate cancer with In-bore MR–guided focused ultrasound: two-year follow-up of a phase I trial—complications and functional outcomes. Radiology. 2017;285:620–628. doi:10.1148/radiol.2017161650 - DOI - PubMed

Publication types