. 2023 Jun;51(6):1181-1198.
doi: 10.1007/s10439-022-03122-9. Epub 2023 Jan 19.

Temperature Dependence of Thermal Properties of Ex Vivo Porcine Heart and Lung in Hyperthermia and Ablative Temperature Ranges

Affiliations

Temperature Dependence of Thermal Properties of Ex Vivo Porcine Heart and Lung in Hyperthermia and Ablative Temperature Ranges

Leonardo Bianchi et al. Ann Biomed Eng. 2023 Jun.

Erratum in

Abstract

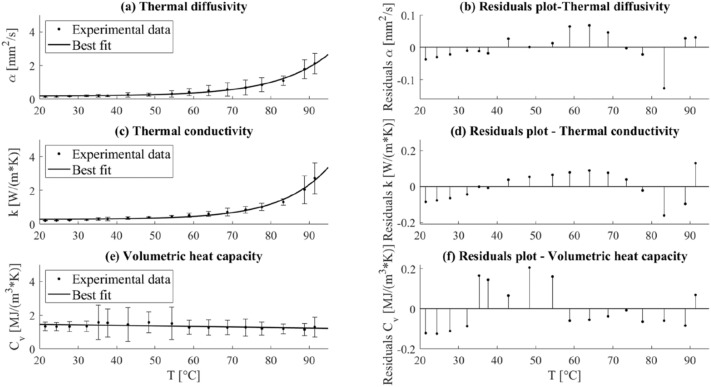
This work proposes the characterization of the temperature dependence of the thermal properties of heart and lung tissues from room temperature up to > 90 °C. The thermal diffusivity (α), thermal conductivity (k), and volumetric heat capacity (Cv) of ex vivo porcine hearts and deflated lungs were measured with a dual-needle sensor technique. α and k associated with heart tissue remained almost constant until ~ 70 and ~ 80 °C, accordingly. Above ~ 80 °C, a more substantial variation in these thermal properties was registered: at 94 °C, α and k respectively experienced a 2.3- and 1.5- fold increase compared to their nominal values, showing average values of 0.346 mm2/s and 0.828 W/(m·K), accordingly. Conversely, Cv was almost constant until 55 °C and decreased afterward (e.g., Cv = 2.42 MJ/(m3·K) at 94 °C). Concerning the lung tissue, both its α and k were characterized by an exponential increase with temperature, showing a marked increment at supraphysiological and ablative temperatures (at 91 °C, α and k were equal to 2.120 mm2/s and 2.721 W/(m·K), respectively, i.e., 13.7- and 13.1-fold higher compared to their baseline values). Regression analysis was performed to attain the best-fit curves interpolating the measured data, thus providing models of the temperature dependence of the investigated properties. These models can be useful for increasing the accuracy of simulation-based preplanning frameworks of interventional thermal procedures, and the realization of tissue-mimicking materials.

Keywords: Heart; Hyperthermia; Lung; Temperature dependence; Thermal ablation; Thermal properties.


Conflict of interest statement

The authors declare no conflict of interest.

Figures

FIGURE 1
FIGURE 1
(a) Experimental setup utilized for the measurement of the thermal properties of heart and lung tissues as a function of temperature: (A) data acquisition system used for the monitoring of the temperature registered by the thermocouples, (B) dual-needle SH-3 sensor probe: the sensor is composed of two needles, 30 mm in length, 1.3-mm diameter with 6 mm spacing, for heating the tissue and sensing the subsequent temperature variation; it can operate in a range of temperatures between − 50 and 150 °C, and it is connected to an analyzer of thermal properties to allow for the measure of k, Cv and α in solid and granular materials, (C) tissue sample, (D) water thermal bath, (E) thermal properties analyzer, (F) fiber optic-based thermometric system including the optical interrogator employed to interrogate the FBG sensors and recover the optical information, thus the tissue temperature variation. (b) Position of the dual-needle probe, thermocouples, and fiber optic sensors within the tissue sample: three-dimensional view (left) and side view (right); the sensing points related to the FBG sensors are also shown.
FIGURE 2
FIGURE 2
Flowchart of the experiment and the performed analysis.
FIGURE 3
FIGURE 3
Temperature distribution as a function of time in the samples across the tissue depths: (a) temperature trends measured by the 10 FBG sensors and (b) temperature map across the sensors and in time. As an example, the results of one of the tests on the heart are reported.
FIGURE 4
FIGURE 4
Preliminary analysis on fresh and frozen-thawed tissues. (A) thermal properties of heart tissue: (a) thermal diffusivity, (b) thermal conductivity, and (c) volumetric heat capacity. (B) thermal properties of lung tissue: (a) thermal diffusivity, (b) thermal conductivity, and (c) volumetric heat capacity. The results of the mean values and the standard deviation of the three consecutive repetitions, at each temperature, are shown from room to ablative temperatures.
FIGURE 5
FIGURE 5
Thermal properties for ex vivo porcine heart as a function of temperature: the average values of the thermal properties, the associated measurement uncertainty, and the best fitting curves for (a) thermal diffusivity, (c) thermal conductivity, and (e) volumetric heat capacity are displayed as well as the plots derived from the analysis of the residuals (b, d, f).
FIGURE 6
FIGURE 6
Intra-sample repeatability analysis for the heart tissue: (a) thermal diffusivity, (b) thermal conductivity, and (c) volumetric heat capacity. The results of the mean values and the standard deviation of the three consecutive repetitions are representatively shown for three heart tissue samples of one experimental trial from room to ablative temperatures (first sample: from room temperature to ~ 51 °C, second sample: from 48 to ~ 71 °C, third sample: from 71 to 94 °C).
FIGURE 7
FIGURE 7
Thermal properties, i.e., (a) thermal diffusivity, (b) thermal conductivity, and (c) volumetric heat capacity of ex vivo porcine lung tissue as a function of temperature and their associated measurement uncertainty. The best-fitting curves interpolating the experimental data are depicted (a, c, e) as well as the plots of the residuals over temperature (b, d, f).
FIGURE 8
FIGURE 8
Analysis of the intra-sample measurement repeatability for the ex vivo lung tissue. For (a) thermal diffusivity, (b) thermal conductivity, and (c) volumetric heat capacity, the mean values and the standard deviation of the three consecutive measurement repetitions are representatively shown for three lung tissue samples of one experimental trial from room to ablative temperatures (first sample: from room temperature to ~ 36 °C, second sample: from 36 to ~ 58 °C, third sample: from 57 to 92 °C).

Similar articles

Cited by

References

    1. Atrial fibrillation ablation - Mayo Clinic.at https://www.mayoclinic.org/tests-procedures/atrial-fibrillation-ablation...
    1. Ahmed M, Brace CL, Lee FT, Goldberg SN. Principles of and advances in percutaneous ablation. Radiology. 2011;258:351–369. - PMC - PubMed
    1. Akhter F, Manrique-Bedoya S, Moreau C, Smith AL, Feng Y, Mayer KM, Hood RL. Characterization of thermal and optical properties in porcine pancreas tissue. Lasers. Surg. Med. 2022;54:702–715. - PubMed
    1. Andreozzi A, Brunese L, Iasiello M, Tucci C, Vanoli GP. Modeling heat transfer in tumors: a review of thermal therapies. Ann. Biomed. Eng. 2019;47:676–693. - PubMed
    1. ANMCO—Associazione Nazionale Medici Cardiologi Ospedalieri.at https://www.anmco.it/pages/entra-in-anmco/aree-anmco/area-aritmie/le-5-c....

LinkOut - more resources