. 2023 Feb 22;8(4):e163820.
doi: 10.1172/jci.insight.163820.

Hypoxia enhances IPF mesenchymal progenitor cell fibrogenicity via the lactate/GPR81/HIF1α pathway

Affiliations

Hypoxia enhances IPF mesenchymal progenitor cell fibrogenicity via the lactate/GPR81/HIF1α pathway

Libang Yang et al. JCI Insight. .

Abstract

Hypoxia is a sentinel feature of idiopathic pulmonary fibrosis (IPF). The IPF microenvironment contains high lactate levels, and hypoxia enhances cellular lactate production. Lactate, acting through the GPR81 lactate receptor, serves as a signal molecule regulating cellular processes. We previously identified intrinsically fibrogenic mesenchymal progenitor cells (MPCs) that drive fibrosis in the lungs of patients with IPF. However, whether hypoxia enhances IPF MPC fibrogenicity is unclear. We hypothesized that hypoxia increases IPF MPC fibrogenicity via lactate and its cognate receptor GPR81. Here we show that hypoxia promotes IPF MPC self-renewal. The mechanism involves hypoxia-mediated enhancement of LDHA function and lactate production and release. Hypoxia also increases HIF1α levels, and this increase in turn augments the expression of GPR81. Exogenous lactate operating through GPR81 promotes IPF MPC self-renewal. IHC analysis of IPF lung tissue demonstrates IPF MPCs expressing GPR81 and hypoxic markers on the periphery of the fibroblastic focus. We show that hypoxia enhances IPF MPC fibrogenicity in vivo. We demonstrate that knockdown of GPR81 inhibits hypoxia-induced IPF MPC self-renewal in vitro and attenuates hypoxia-induced IPF MPC fibrogenicity in vivo. Our data demonstrate that hypoxia creates a feed-forward loop that augments IPF MPC fibrogenicity via the lactate/GPR81/HIF1α pathway.

Keywords: Adult stem cells; Hypoxia; Pulmonology; Stem cells.


Conflict of interest statement

Conflict of interest: The authors have declared that no conflict of interest exists.

Figures

Figure 1
Figure 1. The periphery of the IPF fibroblastic focus contains IPF MPCs, which codistribute with markers of hypoxia.
(A) IHC analysis was performed on human IPF lung tissue (n = 6 IPF patient specimens, 5 sections were imaged in each specimen). H&E staining was used to identify the fibroblastic focus. (BE) IHC was performed using antibodies to procollagen to assess collagen synthesis (B) and HIF1α, HIF2α, and CAIX as markers of hypoxia (CE). (F) IHC staining was performed using SSEA4 to identify IPF MPCs. (A) Scale bar: 200 μm. (CF) Scale bar: 100 μm. Focus cores denoted by asterisks.
Figure 2
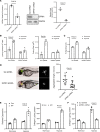
Figure 2. Hypoxia promotes IPF MPC self-renewal and enhances lactate production and excretion.
(A) IPF (left panel) and control (right panel) MPCs (n = 6 each of control and IPF cell lines) were cultured under normoxic (21% O2) or hypoxic (2% O2) conditions for 7 days. At day 7, self-renewal was quantified. (B) IPF and control MPCs were exposed to normoxic or hypoxic conditions. LDHA expression was analyzed by qPCR (left panel) and Western blot (middle left panel). Densitometry values summarizing Western blot data are shown in the middle right panel. GAPDH served as a loading control. LDHA activity was quantified (right panel). n = 4, each of control and IPF cell lines. (CE) IPF and control MPCs were cultured under normoxic and hypoxic conditions for 24 hours. Glucose uptake (C), lactate concentration (D), and lactate release (E) were quantified. For C–E, n = 3 each of control and IPF cell lines used. P values were determined by 2-tailed Student’s t test.
Figure 3
Figure 3. Hypoxia and lactate stimulate IPF MPC self-renewal and migration.
(A) IPF and control MPCs were treated with the indicated lactate concentrations for 7 days. At day 7, self-renewal was quantified. n = 6 each of control and IPF cell lines. (B) IPF and control MPCs were seeded in a modified Boyden chamber and cultured under normoxic or hypoxic conditions for 16 hours, after which the number of migrating cells were quantified. n = 6 each of control and IPF cell lines. (CE) LDHA was knocked down in IPF MPCs using LDHA shRNA (LDHA-shRNA). Scrambled shRNA (Scr-shRNA) served as control. The cells were cultured under hypoxic conditions. LDHA expression was quantified by qPCR (Figure 2C; left panel). LDHA activity was quantified (Figure 2C; middle panel). Lactate levels were quantified in cell lysates (Figure 2C; right panel). (D) Self-renewal was assessed in the colony forming assay. (E) IPF MPC migration was quantified. For CE, n = 3 IPF cell lines used. Data are shown as mean ± SEM. P values were determined by 2-tailed Student’s t test.
Figure 4
Figure 4. IPF MPCs express the lactate receptor GPR81, and IPF MPCs expressing GPR81 are present in a hypoxic niche on the periphery of the fibroblastic focus.
(A) GPR81 expression level in IPF and control (Con) MPCs cultured under normoxic conditions were measured with qPCR (left panel) and Western blot (middle panel). Densitometry values summarizing Western blot data are shown in the right panel. α-Tubulin served as a loading control. n = 4, each of control and IPF cell lines. (B) GPR81 expression levels were quantified in IPF MPCs exposed to normoxic versus hypoxic conditions or 10 mM lactate versus vehicle control by qPCR (left panel) and Western blot (middle panel). Densitometry values summarizing Western blot data are shown in the right panel. α-Tubulin served as a loading control. Three IPF cell lines were used. (C) IHC was performed using GPR81 (red) and SSEA4 (brown-yellow) antibodies to assess the distribution of SSEA4 + MPCs expressing GPR81 (n = 5, IPF patient specimens; 3 sections were imaged in each specimen). Left panel: SSEA4+ cells and GPR81+ cells are present on the periphery of the fibroblastic focus). Asterisk indicates myofibroblast core. Arrows denote SSEA4 and GPR81 double positive cells. Middle and right panels show higher-power images of periphery of the fibroblastic focus demonstrating SSEA4+GPR81+ cells. Scale bar: 50 μm (left); 10 μm (middle). P values were determined by 2-tailed Student’s t test.
Figure 5
Figure 5. Hypoxia promotes IPF MPC self-renewal and motility via the lactate receptor GPR81.
(AC) IPF MPCs were transduced with GPR81 shRNA or scrambled shRNA and cultured under hypoxic conditions (2% O2). (A) GPR81 expression in IPF MPCs were quantified by qPCR (left panel) and Western blot analysis (middle panel). Densitometry values summarizing Western blot data are shown in the right panel. GAPDH served as a loading control. (B) IPF MPC self-renewal was assessed in the colony forming assay. (C) IPF MPC migration was assessed. Three IPF cell lines were used. Data are shown as mean ± SEM. (D) Zebrafish xenograft assay. IPF MPCs transduced with GPR81 or scrambled shRNA (4 independent cells lines) were stained with CFSE, engrafted into zebrafish embryos, and microscopically analyzed in live embryos after 48 hours. Shown are fluorescence (left panels) and bright-field (middle panels) images representative of at least 47 embryos per cell line. The size of the fibrotic reticulum was quantified (right panel). (E) IPF and control MPCs were cultured under normoxic and hypoxic conditions. Collagen I mRNA (left panel) and protein (right panel) levels were quantified by qPCR and ELISA. (F) IPF MPCs were transduced with GPR81 shRNA or scrambled shRNA and cultured under hypoxic conditions (2% O2). Collagen I mRNA (left panel) and protein (right panel) levels were quantified by qPCR and ELISA. For E and F, n = 4 each of control and IPF cell lines used. P values were determined by 2-tailed Student’s t test.
Figure 6
Figure 6. The GPR81/PKA-CREB signal pathway regulates IPF MPC self-renewal.
(A and B) IPF MPCs were cultured in lactate (5 mM) + PKA inhibitor H89 (10 μM) or lactate + vehicle control (Con). Cells cultured in the absence of lactate served as an additional control. Phosphorylated CREB (pCREB) expression was quantified by Western blot analysis (left panel). Total CREB (CREB) and GAPDH served as a loading controls. Densitometry values summarizing Western blot data are shown in the right panel (n = 3 cell lines tested). IPF MPC self-renewal was assessed in the colony forming assay (n = 6 IPF cell lines). (C) PKA and pCREB expression (pCREB ser133) were quantified in IPF MPCs transduced with GPR81 shRNA or scrambled shRNA and cultured in the presence or absence of lactate (5 mM). PKA and pCREB levels were quantified by Western blot analysis (left panel). GAPDH and total CREB served as loading controls. Densitometry values summarizing Western blot data are shown in the right panel. n = 3 IPF cell lines examined. P values were determined by 2-tailed Student’s t test.
Figure 7
Figure 7. Hypoxia promotes GPR81 expression in IPF MPCS via HIF1α.
(A) HIF1α expression was quantified in IPF and control MPCs cultured under normoxic conditions by qPCR (left panel) and Western blot (middle panel). Densitometry values summarizing Western blot data are shown in the right panel. GAPDH served as a loading control. n = 4, each of control and IPF cell lines. (B) HIF1α expression was quantified in IPF and control MPCs exposed to normoxic or hypoxic conditions by qPCR (left panel) and Western blot analysis (middle panel). Densitometry values summarizing Western blot data are shown in the right panel. GAPDH served as a loading control. n = 3, each of control and IPF cell lines used. (C) IPF MPCs were transduced with HIF1α or scrambled shRNA, and the cells were cultured under hypoxic conditions. HIF1α and GPR81 expression levels were quantified by qPCR (left panel) and Western blot analysis (middle panel). Densitometry values summarizing Western blot data are shown in the right panel. GAPDH served as a loading control. Three IPF cell lines were used. (D) ChIP assay. IPF MPCs were cultured under normoxic or hypoxic conditions. HIF1α was immunoprecipitated from nuclear fractions using HIF1α antibody, and qPCR for GPR81 was performed. Immunoprecipitation using isotype antibody (IgG) served as control. Three IPF cell lines were used. Data are shown as mean ± SEM. P values were determined by 2-tailed Student’s t test.
Figure 8
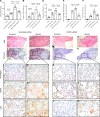
Figure 8. Hypoxia enhances IPF MPC–mediated fibrogenicity in vivo via GPR81.
NSG mice were treated with i.t. bleomycin (1.25 U/kg). Two weeks later, the mice received IPF MPCs transduced with either GPR81 shRNA or scrambled shRNA via tail vein injection (1 × 10⁶ cells/100 μL); 10 mice/group. The mice were maintained under normoxic or hypoxic (10% O2) conditions for the duration of the experiment. Lungs were harvested 4 weeks after cell administration. (A) LDHA activity. (B) Collagen content was quantified in left lungs by Sircol assay (left panel). (C) Semiquantitative analysis of lung collagen deposition was performed by trichrome staining. Three sections from each animal were screened. Three trichrome stained images randomly selected from each section were used for quantification. Scale bar: 500 μm. The blue regions (fibrotic stain) were defined and quantified with ImageJ (NIH); see images HK. (DW) Serial 4 μm sections of right lung tissue from mice receiving IPF MPCs transduced with scrambled-shRNA or GPR81 shRNA (DK, scale bar: 200 μm; LW, scale bar: 50 μm). Representative H&E and trichrome stains assessing fibrosis and collagen deposition, respectively (DK). IHC using an antibody recognizing human procollagen to identify human cells and assess collagen synthesis (LO); an anti–human GPR81 antibody to determine the distribution of GPR81 expressing cells (PS); an anti–human CAIX antibody to determine the distribution of CAIX expressing cells (TW). (X) Semiquantitative analysis of human procollagen I staining in mouse lungs using ImageJ. (Y) Human IPF cell numbers were quantified by qPCR. P values were determined by 1-way ANOVA.

References

    1. [No authors listed] American Thoracic Society. Idiopathic pulmonary fibrosis: diagnosis and treatment. International consensus statement American Thoracic Society (ATS), and the European Respiratory Society (ERS) Am J Respir Crit Care Med. 2000;161(2 pt 1):646–664. doi: 10.1164/ajrccm.161.2.ats3-00. - DOI - PubMed
    1. Basset F, et al. Intraluminal fibrosis in interstitial lung disorders. Am J Pathol. 1986; 122(3): 443–461. - PMC - PubMed
    1. Kuhn C, 3rd, et al. An immunohistochemical study of architectural remodeling and connective tissue synthesis in pulmonary fibrosis. Am Rev Respir Dis. 1989;140(6):1693–1703. doi: 10.1164/ajrccm/140.6.1693. - DOI - PubMed
    1. Kuhn C, McDonald JA. The roles of the myofibroblast in idiopathic pulmonary fibrosis. Ultrastructural and immunohistochemical features of sites of active extracellular matrix synthesis. Am J Pathol. 1991;138(5):1257–1265. - PMC - PubMed
    1. Noble PW, Homer RJ. Idiopathic pulmonary fibrosis: new insights into pathogenesis. Clin Chest Med. 2004;25(4):749–758. doi: 10.1016/j.ccm.2004.04.003. - DOI - PubMed

Publication types

MeSH terms