. 2023 Jul 6;25(7):1262-1274.
doi: 10.1093/neuonc/noad017.

Single-cell transcriptomic analyses provide insights into the cellular origins and drivers of brain metastasis from lung adenocarcinoma

Affiliations

Single-cell transcriptomic analyses provide insights into the cellular origins and drivers of brain metastasis from lung adenocarcinoma

Zihao Wang et al. Neuro Oncol. .

Abstract

Background: Brain metastasis (BM) is the most common intracranial malignancy causing significant mortality, and lung cancer is the most common origin of BM. However, the cellular origins and drivers of BM from lung adenocarcinoma (LUAD) have yet to be defined.

Methods: The cellular constitutions were characterized by single-cell transcriptomic profiles of 11 LUAD primary tumor (PT) and 10 BM samples (GSE131907). Copy number variation (CNV) and clonality analysis were applied to illustrate the cellular origins of BM tumors. Brain metastasis-associated epithelial cells (BMAECs) were identified by pseudotime trajectory analysis. By using machine-learning algorithms, we developed the BM-index representing the relative abundance of BMAECs in the bulk RNA-seq data indicating a high risk of BM. Therapeutic drugs targeting BMAECs were predicted based on the drug sensitivity data of cancer cell lines.

Results: Differences in macrophages and T cells between PTs and BMs were investigated by single-cell RNA (scRNA) and immunohistochemistry and immunofluorescence data. CNV analysis demonstrated BM was derived from subclones of PT with a gain of chromosome 7. We then identified BMAECs and their biomarker, S100A9. Immunofluorescence indicated strong correlations of BMAECs with metastasis and prognosis evaluated by the paired PT and BM samples from Peking Union Medical College Hospital. We further evaluated the clinical significance of the BM-index and identified 7 drugs that potentially target BMAECs.

Conclusions: This study clarified possible cellular origins and drivers of metastatic LUAD at the single-cell level and laid a foundation for early detection of LUAD patients with a high risk of BM.

Keywords: Brain metastasis; S100A9; immune microenvironment; lung adenocarcinoma; scRNA-seq.


Conflict of interest statement

The authors have no conflicts of interest to declare.

Figures

Figure 1.
Figure 1.
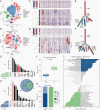
Distinct cellular constitutions in LUAD primary tumor (PT) and brain metastasis (BM) samples delineated by scRNA-seq analysis. (A) Overall workflow of the present study. The main cell types annotated by known cell lineages in PT (B) and BM (C) samples are illustrated by tSNE plots. The number and proportions of the main cell types were ranked from high to low in PT (D) and BM (E) samples, respectively. (F) A comparison of the proportions of the main cell types between the PT and BM is displayed by the bar plot.
Figure 2.
Figure 2.
Subclustering and annotation of macrophages and T cells. The tSNE plot of macrophages was color-coded by clusters (A) and cell types (B). (C) Comparison of the cell type proportions of macrophages between primary tumors (PTs) and brain metastases (BMs). (D) Gene set variation analysis (GSVA) demonstrated differences in hallmark pathways in macrophages between PT and BM samples. The tSNE plot of T cells, color-coded by clusters (E) and cell types (F). (G) Comparison of the cell type proportions of T cells between the PT and BM. (H) GSVA demonstrated differences in hallmark pathways in T cells between PT and BM samples.
Figure 3.
Figure 3.
Copy number variation (CNV) and clonality analysis of epithelial cells (ECs) from the primary tumors (PTs) and brain metastases (BMs). ECs (marked by the circle) from PT (A) and BM (B) samples were extracted for inferCNV analysis. Large-scale CNVs of ECs from the PT (C) and BM (D) were displayed by hierarchical heatmaps to identify malignant cells. Gains or losses were inferred by averaging expression over 100 gene stretches on the respective chromosomes. The evolutionary phylogenetic trees of all malignant cells from PT (E) and BM (F). The length of each branch is proportional to the number of cells in each subclone containing the corresponding CNVs. Some key CNV events were labeled in the clonality tree. UpSet plots revealed the numbers of genes located on chromosome 7 shared by the subclones with 7p/7q gain in PT (G) and BM (H). Red bars and dots represent the genes shared by all subclones. The Venn diagram indicated that copy number gains of 35 genes on chromosome 7 were shared by all malignant cells from PT and BM samples. Comparisons of the diversity score (J), representing intratumoral heterogeneity, and malignant cell proportions (K), representing tumor purity, between the PT and BM. (L) GSVA demonstrated differences in hallmark pathways in malignant ECs between PT and BM samples.
Figure 4.
Figure 4.
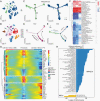
Identification of specific EC subpopulations associated with brain metastasis (BM). The tSNE plot of epithelial cells (ECs), color-coded by origins (A) and clusters (B). (C) Pseudotime trajectory analysis of malignant ECs from primary tumors (PTs) (left) and BMs (right) ordered and annotated by 7 cellular states. Trajectory analysis of cluster EC2 yielded 3 cellular states (D) organized into 1 root and 2 branches generated by cell fate decisions (E). (F) The differential hallmark pathways among the three cellular states by gene set variation analysis (GSVA). nsP > .05, *P <.05, and ***P < .001. (G) Heatmap of 45 branch-dependent genes across 3 states identified by branched expression analysis modeling. The white arrow represents the transitions from state S1 (prebranch) to S2 (cell fate 1) or S3 (cell fate 2). (H) GSVA demonstrated the differential hallmark pathways between brain metastasis-associated epithelial cells and MECs in PT.
Figure 5.
Figure 5.
Validation of brain metastasis-associated epithelial cells (BMAECs) associated with metastasis and prognosis in the Peking Union Medical College Hospital cohort. (A) The workflow for identifying the most representative genes for BMAECs. (B) Representative multiplex IF staining plots of the primary tumor (PT) and brain metastasis (BM) samples. The inserts are zoomed-in views of S100A9+EPCAM+ cells (arrows). Scale bar: 100 μm. (C) Comparisons of the BMAEC proportions among PT, BM, and NMPT samples. (D) Comparisons of the BMAEC proportions among PT, MBM, and PBM samples. nsP > .05, **P < .01, and ****P < .0001. (E) ROC curve for evaluating the performance of the BMAEC proportion to discriminate LUAD samples with or without BM. (F) Confusion matrices of the binary results of the BMAEC proportion for discriminating PT and NMPT. K–M survival analysis for evaluating the associations between metastasis-free survival (G), OS (H), and BMAEC proportions in LUAD patients.
Figure 6.
Figure 6.
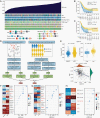
Identification of therapeutic drugs with high drug sensitivity for brain metastasis-associated epithelial cells (BMAECs) and high-brain metastasis (BM) index patients. (A) An overview of the association between the BM index and clinicopathological features of patients. Columns represent LUAD patients ranked by BM index from low to high (top row), and other rows represent the clinical features. *P < .05 and ***P < .001. (B) K–M survival analyses demonstrated significantly poorer OS (B) and DFS (C) in patients with a high BM index. (D) The overall workflow for identifying highly sensitive candidate drugs targeting BMAECs and for patients with a high BM index. (E) The differential drug-response analysis (boxplots, upper panel) and Spearman’s correlation analysis (lower panel) of lapatinib. Spearman’s correlation analysis between gene/protein expressions of drug targets of lapatinib and drug-response AUCs in BMAECs/MECs (F, left panel), high/low-BM-index patients (G, left panel; H, left panel). The differential expression analysis of drug targets between BMAECs and MECs (F, right panel), high- and low-BM-index patients (G, right panel; H, right panel). The vertical dotted line represents the cutoff value of the false discovery rate as 0.05.

References

    1. Turkaj A, Morelli AM, Vavalà T, Novello S. Management of leptomeningeal metastases in non-oncogene addicted non-small cell lung cancer. Front Oncol. 2018;8:278. - PMC - PubMed
    1. Siam L, Bleckmann A, Chaung HN, et al. . The metastatic infiltration at the metastasis/brain parenchyma-interface is very heterogeneous and has a significant impact on survival in a prospective study. Oncotarget. 2015;6(30):29254–29267. - PMC - PubMed
    1. Suh JH, Kotecha R, Chao ST, et al. . Current approaches to the management of brain metastases. Nat Rev Clin Oncol. 2020;17(5):279–299. - PubMed
    1. Jenkinson MD, Haylock B, Shenoy A, Husband D, Javadpour M. Management of cerebral metastasis: evidence-based approach for surgery, stereotactic radiosurgery and radiotherapy. Eur J Cance. 2011;47(5):649–655. - PubMed
    1. Waqar SN, Samson PP, Robinson CG, et al. . Non-small-cell lung cancer with brain metastasis at presentation. Clin Lung Cancer. 2018;19(4):e373–e379. - PMC - PubMed

Publication types