. 2023 Jan 24;120(4):e2204098120.
doi: 10.1073/pnas.2204098120. Epub 2023 Jan 19.

Minimizing habitat conflicts in meeting net-zero energy targets in the western United States

Affiliations

Minimizing habitat conflicts in meeting net-zero energy targets in the western United States

Grace C Wu et al. Proc Natl Acad Sci U S A. .

Abstract

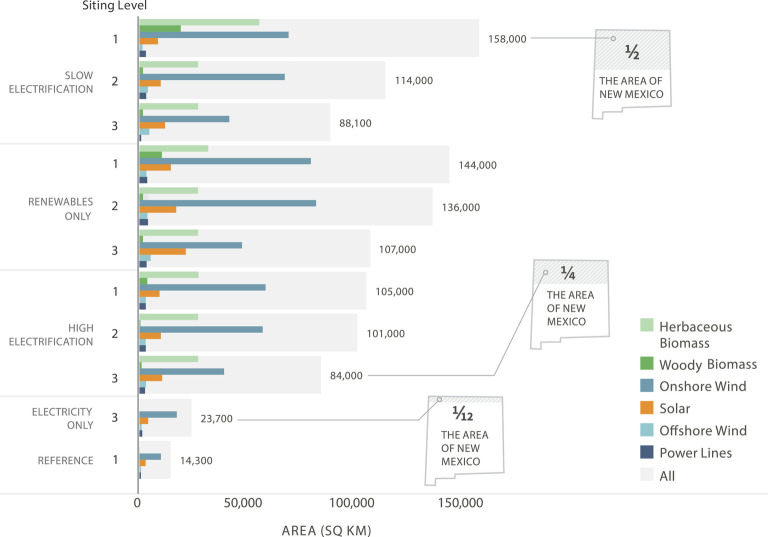
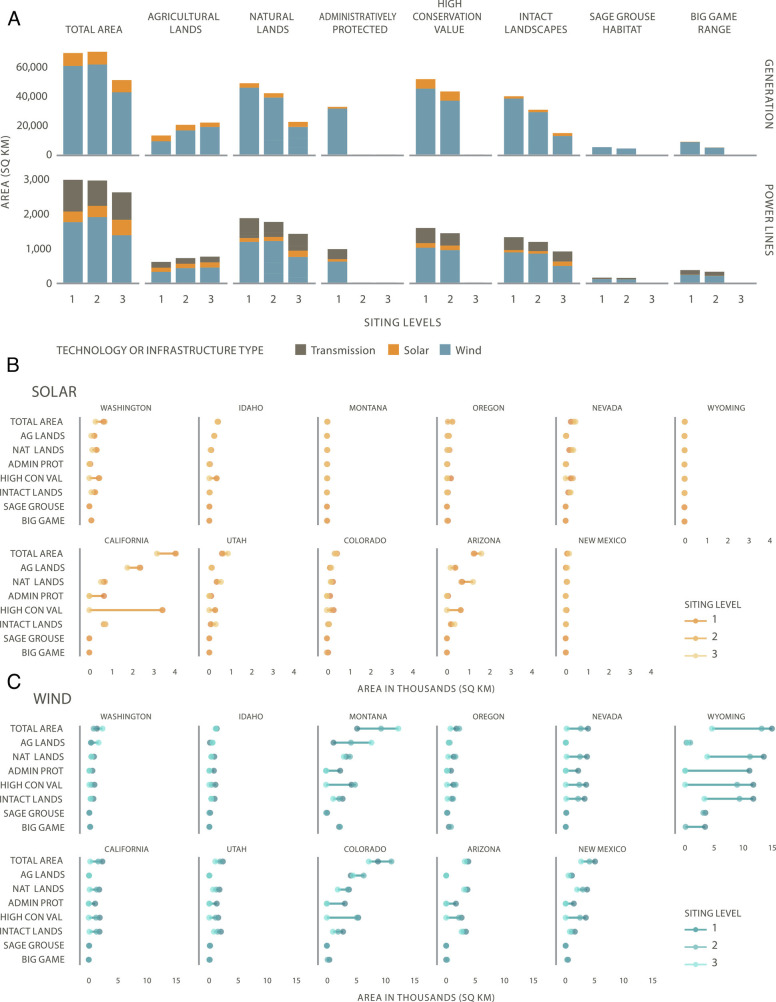
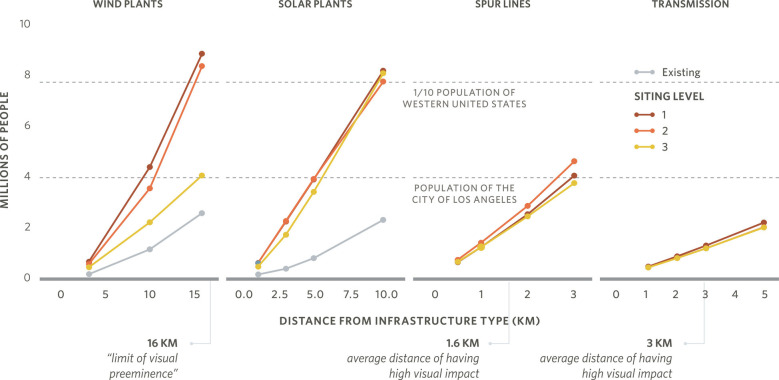
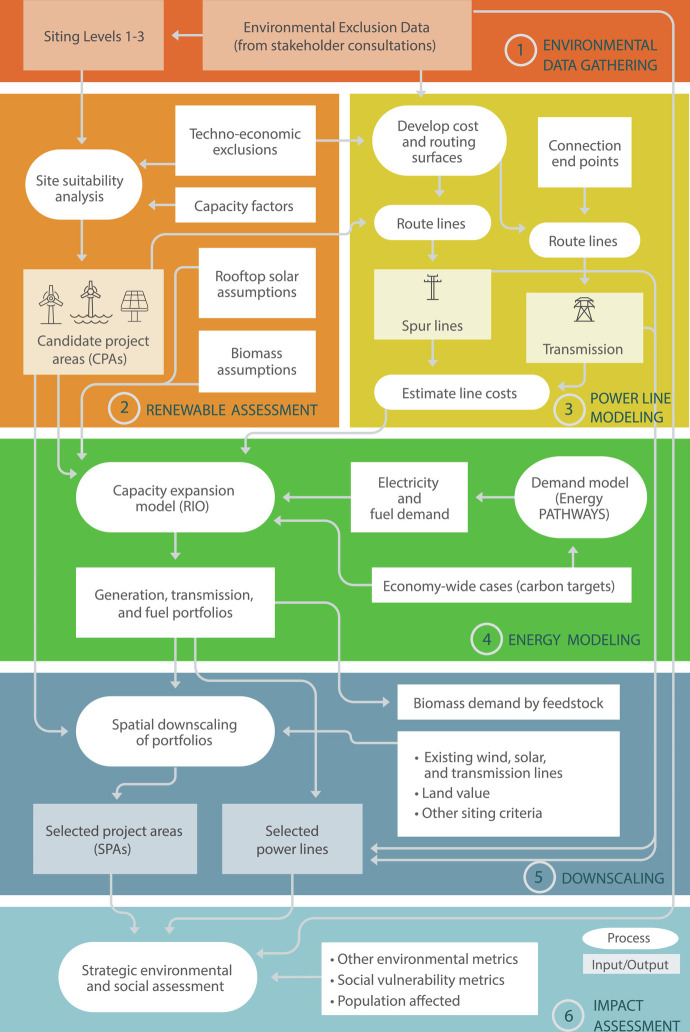
The scale and pace of energy infrastructure development required to achieve net-zero greenhouse gas (GHG) emissions are unprecedented, yet our understanding of how to minimize its potential impacts on land and ocean use and natural resources is inadequate. Using high-resolution energy and land-use modeling, we developed spatially explicit scenarios for reaching an economy-wide net-zero GHG target in the western United States by 2050. We found that among net-zero policy cases that vary the rate of transportation and building electrification and use of fossil fuels, nuclear generation, and biomass, the "High Electrification" case, which utilizes electricity generation the most efficiently, had the lowest total land and ocean area requirements (84,000 to 105,000 km2 vs. 88,100 to 158,000 km2 across all other cases). Different levels of land and ocean use protections were applied to determine their effect on siting, environmental and social impacts, and energy costs. Meeting the net-zero target with stronger land and ocean use protections did not significantly alter the share of different energy generation technologies and only increased system costs by 3%, but decreased additional interstate transmission capacity by 20%. Yet, failure to avoid development in areas with high conservation value is likely to result in substantial habitat loss.

Keywords: biodiversity; carbon neutrality; land use; renewables; siting.


Conflict of interest statement

The authors declare no competing interest.

Figures

Fig. 1.
Fig. 1.
Land and ocean area for renewable resource and additional biomass resources required in 2050 for each scenario. Gray bars indicate the total area summed across the grouped bars for each scenario. Onshore and offshore wind plant area shown represents the total area, which includes spacing between turbines. The land requirements for hydropower, natural gas, coal, and nuclear are not included because their capacities either remained constant or declined over time. Direct air capture (DAC) and geothermal plants are also not included because their land requirements were minuscule compared to wind, solar, transmission, and biomass. However, all renewable generation used to power DAC is reflected in the area requirements (17, 18).
Fig. 2.
Fig. 2.
Electricity demand (Load) (A), generation (B), and installed capacity (C) across the western United States for scenarios that achieve different decarbonization targets (reference, electricity only, and economy-wide net-zero cases) or with different decarbonization pathways (High Electrification, Slow Electrification, and Renewables Only). The reference case uses Siting Level 1 (SL1) protections, while all other scenarios have Siting Level 3 (SL3) protections. Values for onshore wind and all solar generation and capacity (large-scale, urban infill, and rooftop) are labeled.
Fig. 3.
Fig. 3.
Additional build-out by 2050 of large-scale solar plants (A), wind plants (B), transmission and spur lines (C), and the western United States share of purpose-grown biomass area requirements (D) under different levels of environmental protection and supply constraints for the High Electrification case (Siting Level 1 in the left column through Siting Level 3 in the right column). The total capacity for each infrastructure type in gigawatts (GW) is indicated by the bars in the lower left corner of each map. Total solar capacity bars include large-scale, urban infill, and rooftop solar, whereas the map shows the location of only additional large-scale solar plants. Biomass maps indicate the area in each state required to supply the western US states’ share of purpose-grown biomass. Siting Levels 2 and 3 restrict purpose-grown herbaceous biomass cultivation to land dedicated to growing corn for corn ethanol. These modifications preclude downscaling biomass demand beyond the state level.
Fig. 4.
Fig. 4.
Net annual levelized supply-side cost in 2050 for scenarios is shown relative to the High Electrification Siting Level 1 scenario. Bars above the x-axis represent an increase in costs, while bars below represent a decrease in relative cost. Labeled points provide the net cost. The secondary y-axis shows the percentage cost increases compared with the High Electrification SL1 scenario, which costs 260 billion USD.
Fig. 5.
Fig. 5.
Land use, land cover, and select ecological impacts of solar and onshore wind project areas (generation) and transmission lines selected for each Siting Level under the High Electrification case (A). Impacts of selected solar and onshore wind project areas for the same metrics are reported by state (B and C). The length of the lines connecting points for each metric indicates the difference between Siting Levels or the degree of impact of land use protections. Natural lands comprise grasslands, shrubland, and conifer land cover classes.
Fig. 6.
Fig. 6.
Human population found within a certain distance from all selected wind plants, solar plants, spur lines, and transmission lines for each Siting Level in the High Electrification case. Population counts were estimated for the buffered distances indicated by the points. Visual impact studies have identified 16 km as the limit of visual preeminence for wind plants, 1.6 km for 230-kV lines, and 2-3 km for 500-kV transmission towers. The population of the city of Los Angeles and a fraction of the population of the western United States are provided for reference.
Fig. 7.
Fig. 7.
Methodological framework.

References

    1. Rogelj J., et al. , Mitigation Pathways Compatible with 1.5∘C in the Context of Sustainable Development (chapter 2). Global Warming of 1.5∘C. An IPCC Special Report on the impacts of global warming of 1.5∘C above pre-industrial levels and related global greenhouse gas emission pathways, in the context of strengthening the global response to the threat of climate change, sustainable development, and efforts to eradicate poverty p. 82 (2018). 00011.
    1. Clean Energy States Alliance, Table of 100% Clean Energy States (2022).
    1. Williams J. H., et al. , The technology path to deep greenhouse gas emissions cuts by 2050: The pivotal role of electricity. Science 335, 53–59 (2012). - PubMed
    1. Intergovernmental Panel on Climate Change , Chapter 6: Assessing Transformation Pathways: Climate Change 2014 Mitigation of Climate Change: Working Group III Contribution to the Fifth Assessment Report of the Intergovernmental Panel on Climate Change (Cambridge University Press, Cambridge, 2014), p. 00150.
    1. Williams J. H., et al. , Carbon-neutral pathways for the United States. AGU Adv. 2, e2020AV000284 (2021).

LinkOut - more resources