. 2023 Jan 24;120(4):e2211933120.
doi: 10.1073/pnas.2211933120. Epub 2023 Jan 19.

Metformin acts in the gut and induces gut-liver crosstalk

Affiliations

Metformin acts in the gut and induces gut-liver crosstalk

Natália Tobar et al. Proc Natl Acad Sci U S A. .

Abstract

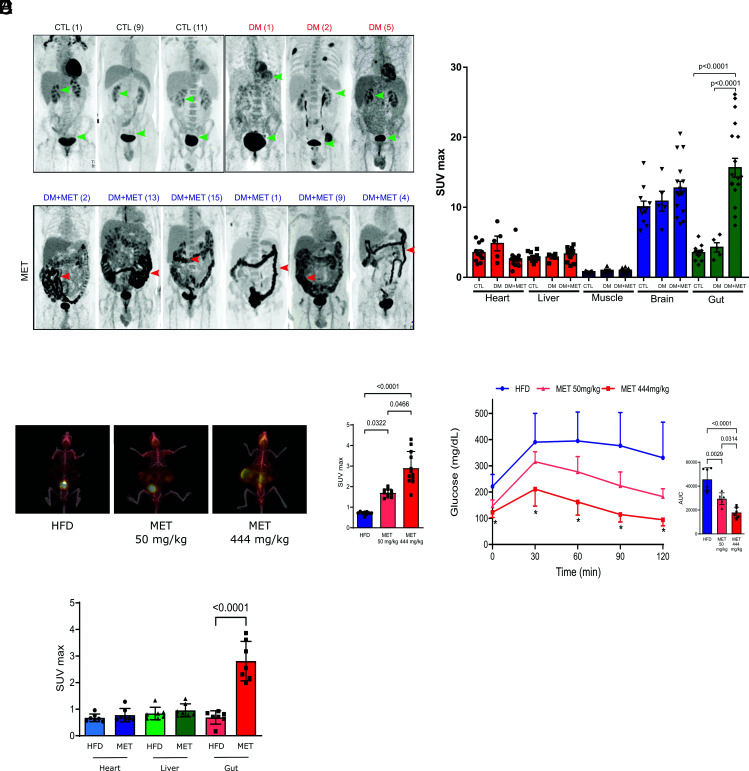
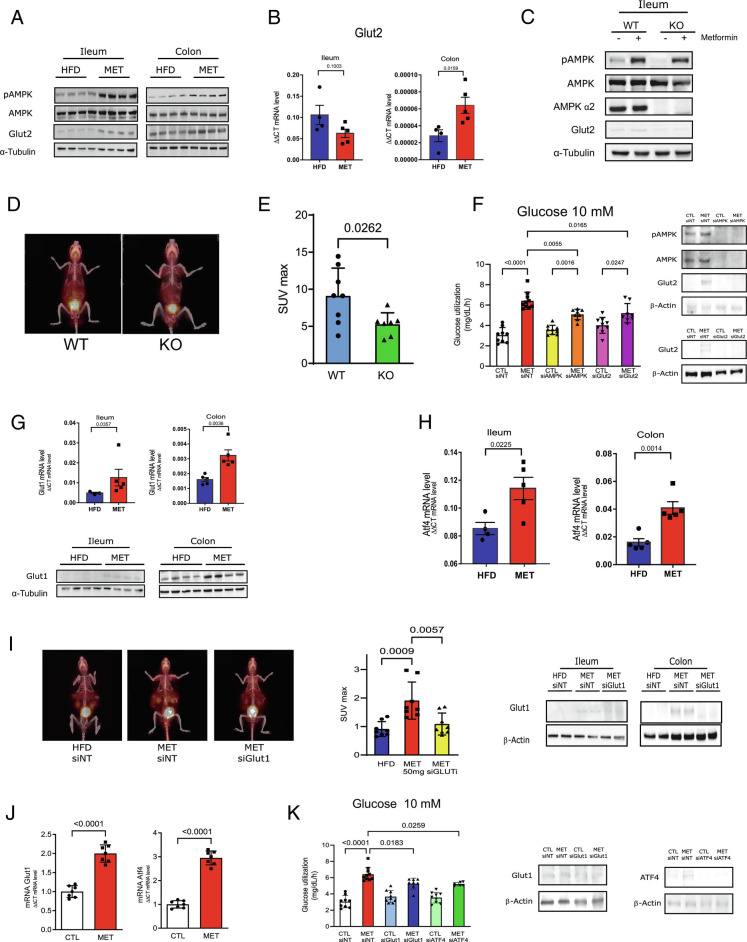
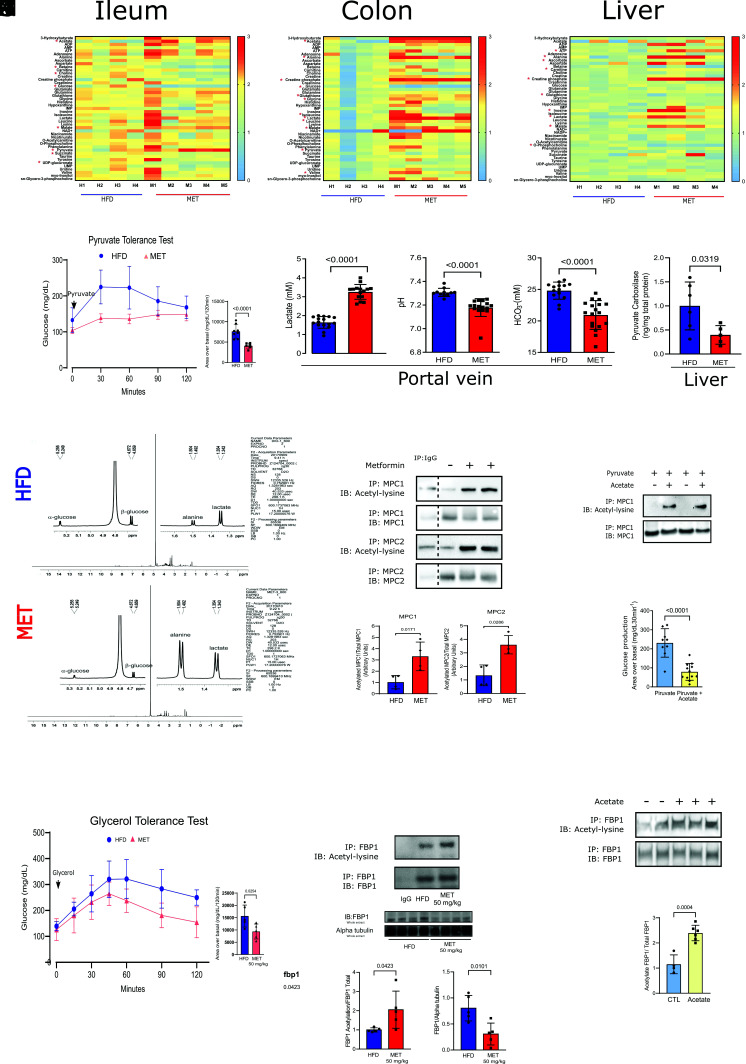
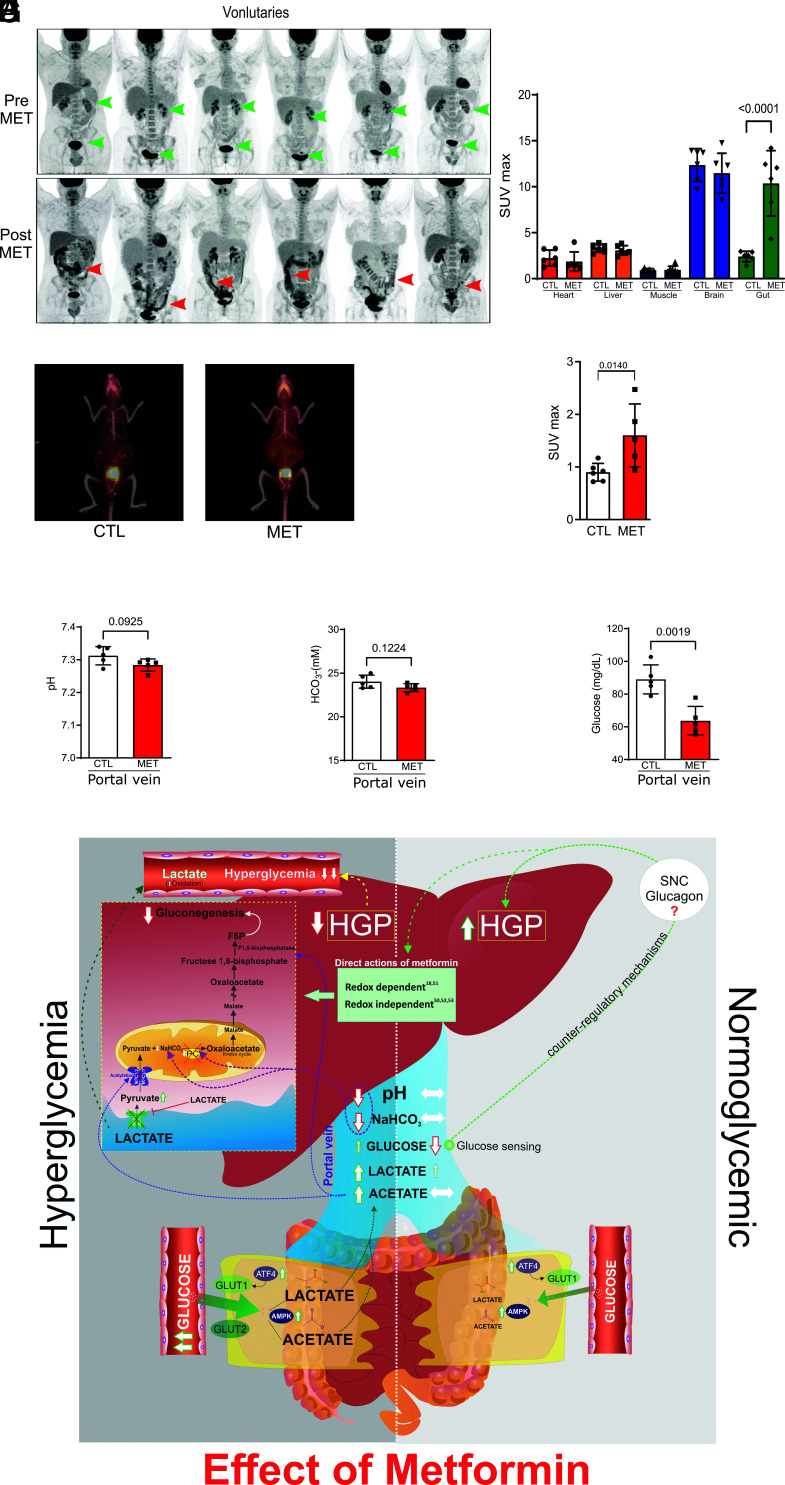
Metformin is the most prescribed drug for DM2, but its site and mechanism of action are still not well established. Here, we investigated the effects of metformin on basolateral intestinal glucose uptake (BIGU), and its consequences on hepatic glucose production (HGP). In diabetic patients and mice, the primary site of metformin action was the gut, increasing BIGU, evaluated through PET-CT. In mice and CaCo2 cells, this increase in BIGU resulted from an increase in GLUT1 and GLUT2, secondary to ATF4 and AMPK. In hyperglycemia, metformin increased the lactate (reducing pH and bicarbonate in portal vein) and acetate production in the gut, modulating liver pyruvate carboxylase, MPC1/2, and FBP1, establishing a gut-liver crosstalk that reduces HGP. In normoglycemia, metformin-induced increases in BIGU is accompanied by hypoglycemia in the portal vein, generating a counter-regulatory mechanism that avoids reductions or even increases HGP. In summary, metformin increases BIGU and through gut-liver crosstalk influences HGP.

Keywords: Diabetes; Metformin; glucose metabolism; gut-liver crosstalk.


Conflict of interest statement

The authors declare no competing interest.

Figures

Fig. 1.
Fig. 1.
Metformin increases basolateral intestinal glucose uptake and utilization (BIGU) in diabetic patients and in obese mice and improves glucose tolerance in these mice. (A) Representative images of whole-body 18F-FDG PET/CT scanning from control individuals (CTL, n = 11) diabetic patients (DM, n = 5) and diabetic patients in use of metformin (DM+MET, n = 16). 18F-FDG PET/CT uptake is color-coded, and areas of increased signal exhibit black color. (B18F-FDG biodistribution analysis (SUVmax) in different tissues from CTL, DM and DM+MET diabetic patients. (C) Representative images of whole-body 18F-FDG PET/CT scanning from mice on HFD and treated with vehicle or metformin (MET) with low (50 mg/kg) and high (444 mg/kg) dose for 10 d and 2 h before the PET/CT. 18F-FDG PET/CT uptake is color coded, and areas of increased signal exhibit red-orange color. (D18F-FDG biodistribution analysis (SUVmax) in the intestine from mice treated with vehicle (HFD) or treated with metformin (MET) at a low and high dose, respectively. (E) Blood glucose levels from HFD and MET treated mice during a glucose tolerance test (GTT). (F18F-FDG biodistribution analysis (SUVmax) in different tissues from HFD and MET mice (50 mg/kg/day for 10 d). All tests performed were one-way ANOVA with Bonferroni’s post-test.
Fig. 2.
Fig. 2.
Metformin induces AMPK phoshorylation and modulates GLUT2 and GLUT1 in ileum and colon. (A) Protein phosphorylation and expression of AMPK and protein expression of Glut2 in ileum and colon from HFD and MET-treated mice (50 mg/kg for 10 d). (B) Glut-2 mRNA expression in ileum and colon from HFD and MET mice (50 mg/kg for 10 d). (C) Protein phosphorylation and expression of AMPK and expression of Glut2 in ileum from wild type (WT) and AMPK knock-out (KO) littermates mice treated or not with metformin (MET) (50 mg/kg for 10 d). (D) Representative images of whole-body 18F-FDG PET/CT scanning from mice and 18F-FDG biodistribution analysis (SUVmax) in the intestine from AMPK wild type (WT) and knock-out (KO) mice treated with metformin and (E) SUVmax quantification in the intestine. (Student’s t test, P < 0.05, n = 5). (F) Glucose uptake at 10 mM glucose concentrations in CaCo2 cells after the incubation with metformin (MET 1 mM to 16 h) in cells pre-treated with siRNA of AMPK, GLUT2 and non-targeting, as control (siNT) (one-way ANOVA and Bonferroni’s test, P < 0.05). (G) Glut-1 mRNA and protein expression in ileum and colon from HFD and MET mice (50 mg/kg for 10 d). (H) ATF-4 mRNA expression in ileum and colon from HFD and MET mice (50 mg/kg for 10 d) (n = 6). (I) Representative images of whole-body 18F-FDG PET/CT scanning from mice and 18F-FDG biodistribution analysis (SUVmax) in the intestine from mice treated with non-targeting siRNA or Glut1siRNA and with metformin (50 mg/kg for 10 d) and expression of Glut1 in ileum and colon (ANOVA, Bonferroni post test, P < 0.05, n = 5). (J) Glut-1 and ATF4 mRNA expressions in CaCo2 cells. (K) Glucose uptake at 10 mM glucose concentrations in CaCo2 cells after the incubation with metformin (MET 1mM to 16h) and siRNA-mediated knockdown of GLUT1, ATF4 and non-targeting, as control (siNT) and expression of Glut1 and Atf4 in CaCo2 cells (one-way ANOVA and Bonferroni’s test.)
Fig. 3.
Fig. 3.
Metformin increases glycolysis in ileum and colon and reduces HGP in animals on HFD (AC) Metabolomic analysis of ileum, colon and liver from the HFD and MET mice treated (50 mg/kg/day) for 10 d (one-way ANOVA and Bonferroni’s test, *P < 0.05, n = 4 to 5) (D) PTT curve and area under curve of metformin treated mice (50 mg/kg/day for 10 d) (n = 5). (E) Lactate, pH and bicarbonate levels in blood from the portal vein of HFD and MET Wistar rats. (F) Pyruvate carboxylase levels in liver from HFD and MET treated Wistar rats. (G) (1H) NMR spectra acquired at 600 MHz in D2O. (H) Acetylation of MPC1/2 in the liver of HFD and MET treated C57BL6/J mice (n = 5). (I) Acetylation of MPC1 in HuH7 cells treated with pyruvate and acetate. (J) Glucose production of Huh7 cells treated with pyruvate and acetate. (K) Glycerol tolerance test curve and area under curve of metformin treated mice (50 mg/kg/day for 10 d) (n = 5). (L) Acetylation and tissue protein levels of FBP1 in the liver of HFD and MET treated C57BL6/J mice (n = 5). (M) Acetylation of FBP1 in HuH7 cells treated with acetate.
Fig. 4.
Fig. 4.
Metformin induces moderate increase BIGU in control individuals and normal glucose-tolerant rodents and does not reduce HGP in the liver of these rodents. (A) Representative images of whole-body 18F-FDG PET/CT scanning from the same healthy subjects before (PRE) and after metformin (2 g/day for 5 d) (POST). 18F-FDG PET/CT uptake is color coded, and areas of increased signal exhibit black color. (B) 18F-FDG biodistribution analysis (SUVmax) in different tissues from CTL and MET subjects (one-way ANOVA and Bonferroni’s test, P < 0.001, n = 6). (C) Representative images of whole-body 18F-FDG PET/CT scanning from mice on control chow mice treated with vehicle or metformin (MET 50 mg/kg/day for 10 d) and for 2 h before the PET/CT, 18F-FDG PET/CT uptake is color coded, and areas of increased signal exhibit red-orange color. 18F-FDG PET/CT images from lean mice (CTL) and treated with vehicle or metformin (MET). (D) SUVmax in the intestine of CTL and MET treated mice (50 mg/kg/day for 10 d) (one-way ANOVA and Bonferroni’s test, P < 0.05, n = 5 to 6). (E and F) pH and bicarbonate levels in blood from the portal vein of CTL and MET (250 mg/kg/10 d) treated Wistar rats. (G) Glucose levels in CTL and MET treated (250 mg/kg/day for 10 d) in lean Wistar rats (Student’s t test, P < 0.05, n = 5). (H) Schematic representation of metformin actions in conditions of hyperglycemia and normoglycemia. In hyperglycemic conditions, metformin induces GLUT1 and GLUT2 in the colon and ileum, where both these glucose transporters are expected to promote BIGU. In enterocytes, the glucose is metabolized to lactate, which will decrease pH and NaHCO3 in the portal vein and decrease gluconeogenesis via PC inhibition. In parallel, an increase in acetate production in the gut will induce acetylation and inhibit MPC1/2, leading to cytosolic accumulation of pyruvate, which in turn prevents the uptake of extracellular lactate through MCT1. Acetylation also blocks FBP1. These mechanisms demonstrate that metformin establishes a crosstalk between gut and liver to reduce gluconeogenesis in hyperglycemic conditions. In normoglycemic conditions, metformin induces GLUT1 and 2 expressions, but considering the Km of the glucose transporters, GLUT1 is expected to be preferentially used to modestly increase BIGU. In this condition, the increase in lactate will be discreet, and no alteration in acid–base equilibrium in the portal vein will be observed. The moderate increase in BIGU will induce hypoglycemia in the portal vein, which can induce portal glucose sensing and a possible counter-regulatory response that will avoid a decrease in HGP or even increase it. It is important to mention that other actions of metformin directly in the liver can synergize with the demonstrated gut-liver crosstalk to reduce HGP. However, in conditions of normoglycemia, the counter-regulatory mechanisms may overcome these direct actions.

References

    1. Bailey C. J., Metformin: Historical overview. Diabetologia 60, 1566–1576 (2017), 10.1007/s00125-017-4318-z. - DOI - PubMed
    1. Bailey C. J., Wilcock C., Scarpello J. H., Metformin and the intestine. Diabetologia 51, 1552–1553 (2008), 10.1007/s00125-008-1053-5. - DOI - PubMed
    1. Sanchez-Rangel E., Inzucchi S. E., Metformin: Clinical use in type 2 diabetes. Diabetologia 60, 1586–1593 (2017), 10.1007/s00125-017-4336-x. - DOI - PubMed
    1. Gormsen L. C., et al. , Metformin increases endogenous glucose production in non-diabetic individuals and individuals with recent-onset type 2 diabetes. Diabetologia 62, 1251–1256 (2019), 10.1007/s00125-019-4872-7. - DOI - PubMed
    1. McCreight L. J., et al. , Metformin increases fasting glucose clearance and endogenous glucose production in non-diabetic individuals. Diabetologia 63, 444–447 (2020), 10.1007/s00125-019-05042-1. - DOI - PMC - PubMed

Publication types

LinkOut - more resources