. 2023 Feb 3;40(2):msad014.
doi: 10.1093/molbev/msad014.

How Many Sirtuin Genes Are Out There? Evolution of Sirtuin Genes in Vertebrates With a Description of a New Family Member

Affiliations

How Many Sirtuin Genes Are Out There? Evolution of Sirtuin Genes in Vertebrates With a Description of a New Family Member

Juan C Opazo et al. Mol Biol Evol. .

Abstract

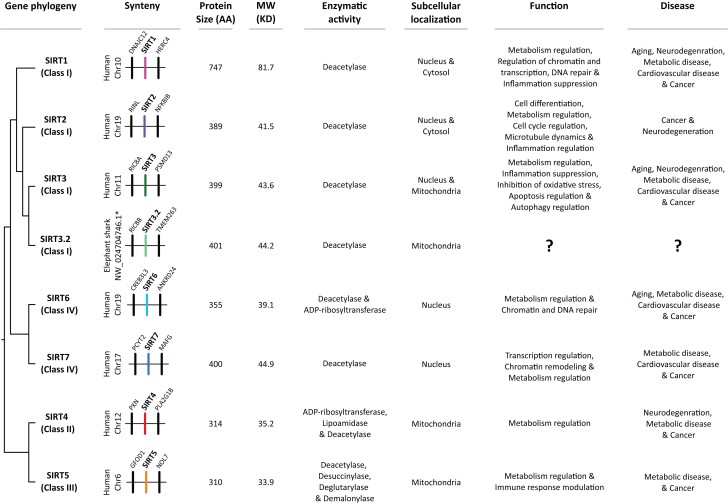
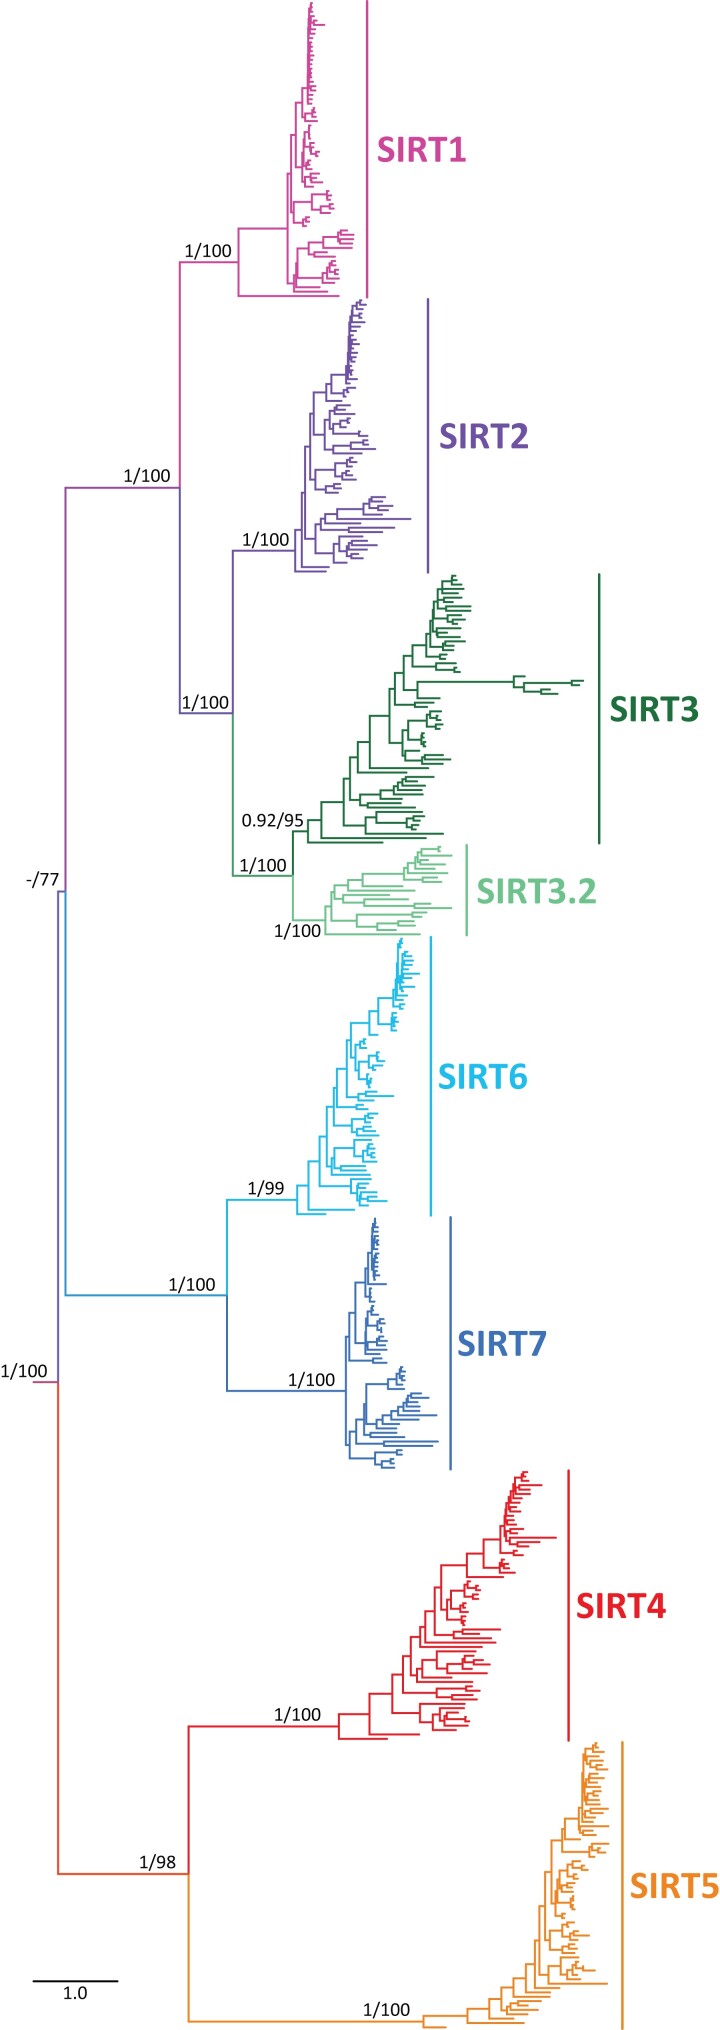
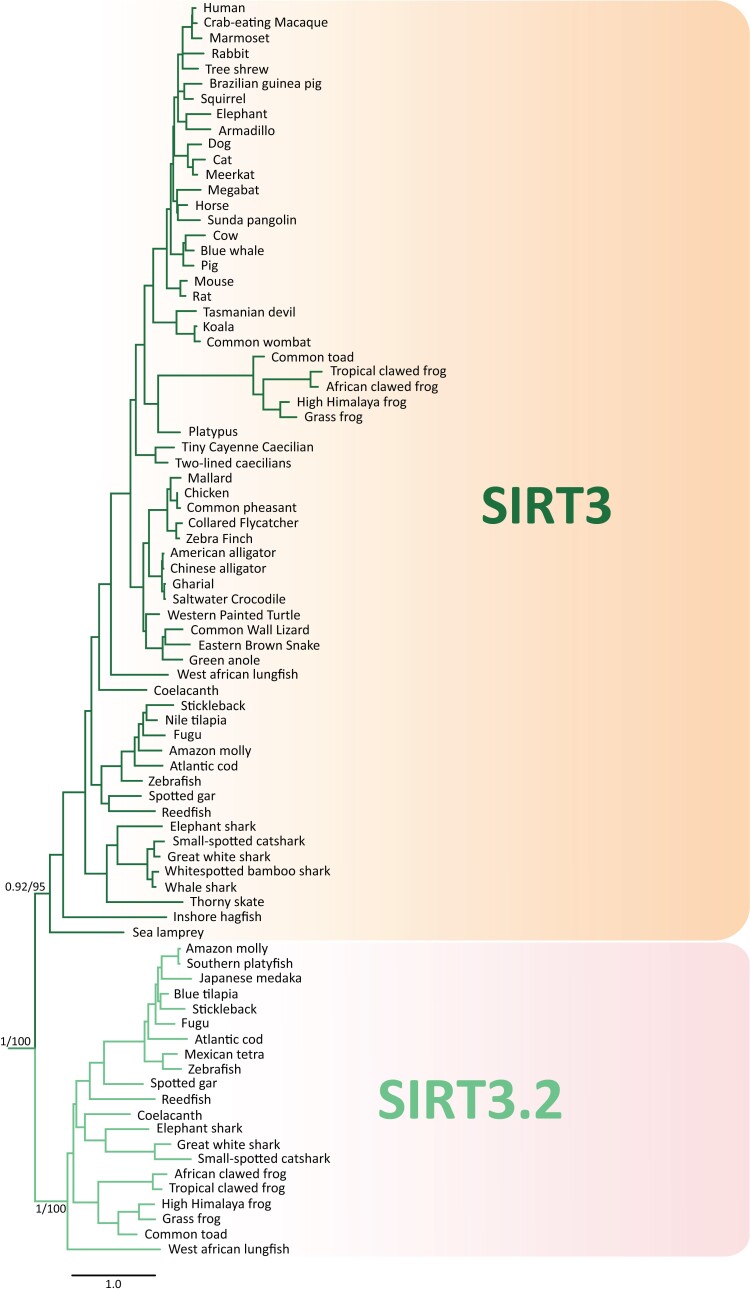
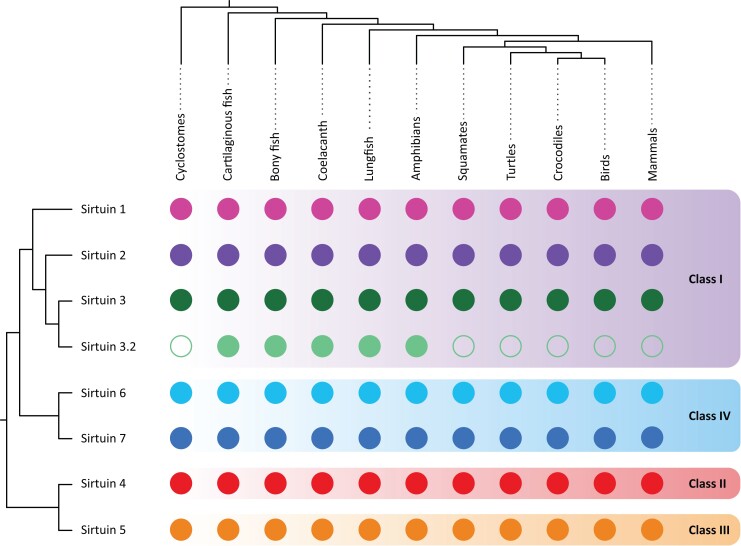
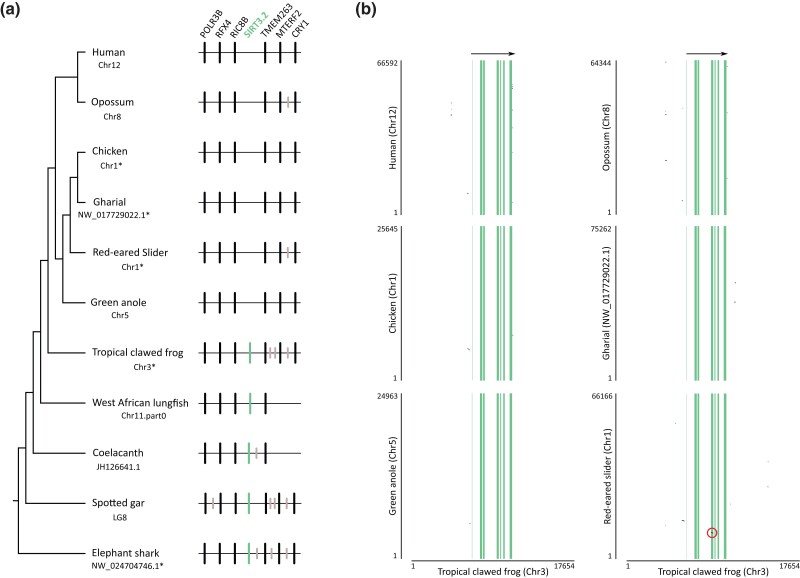
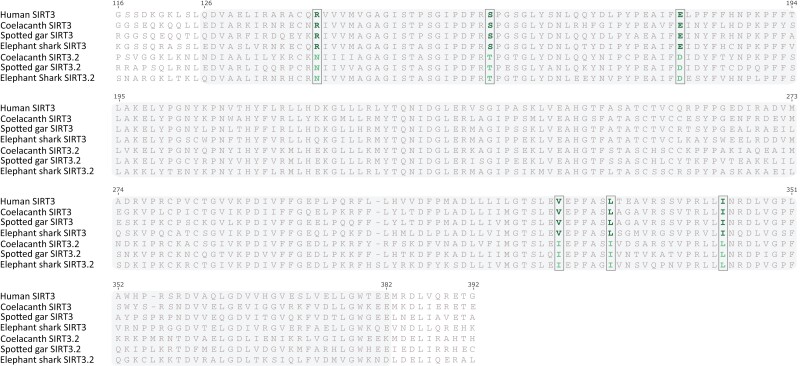
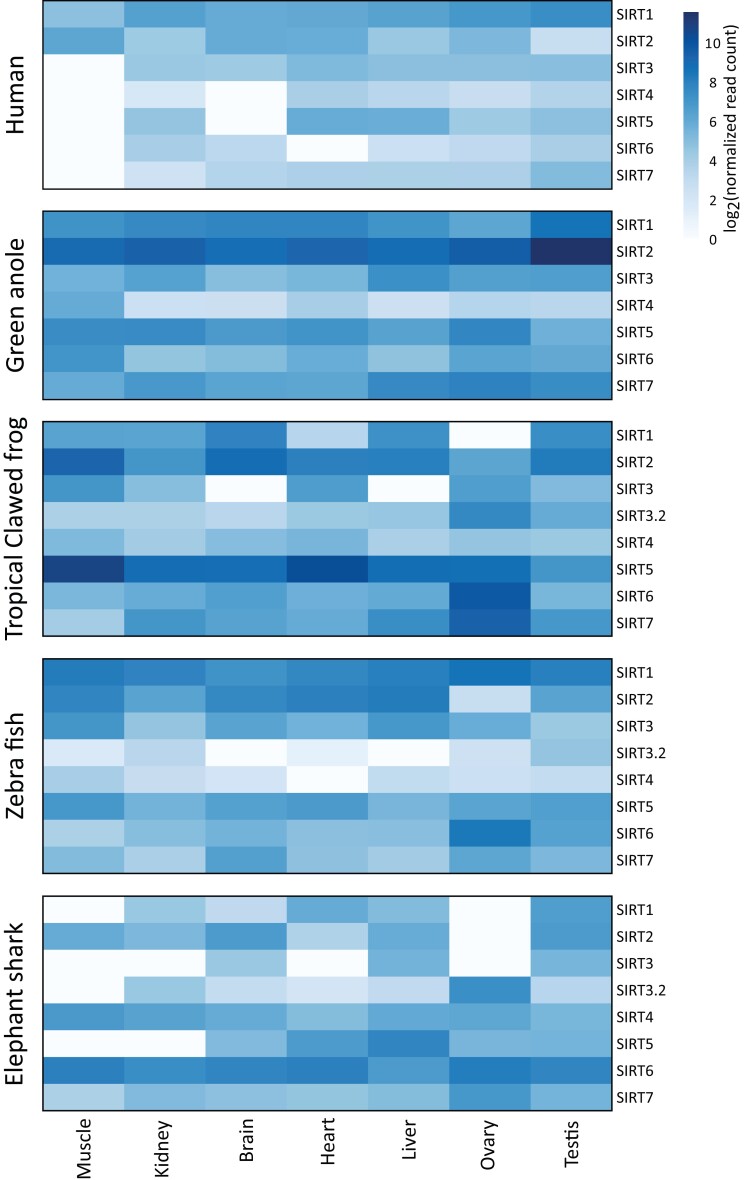
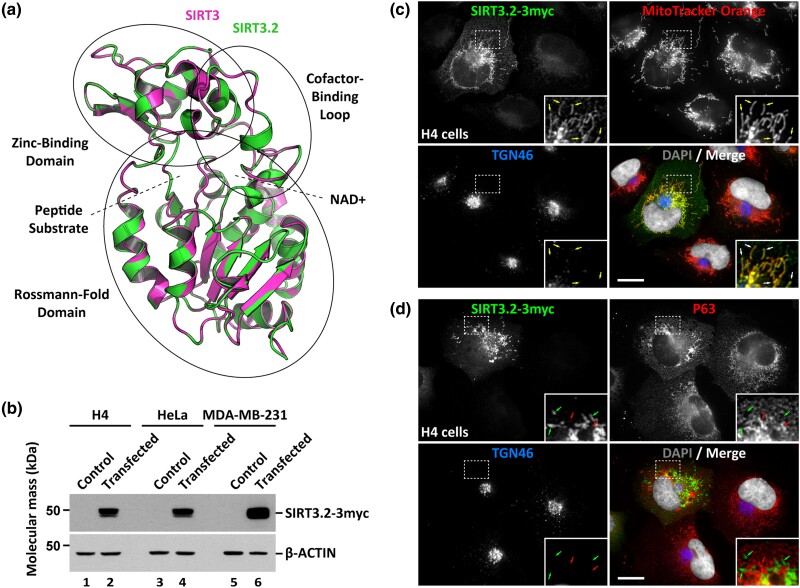
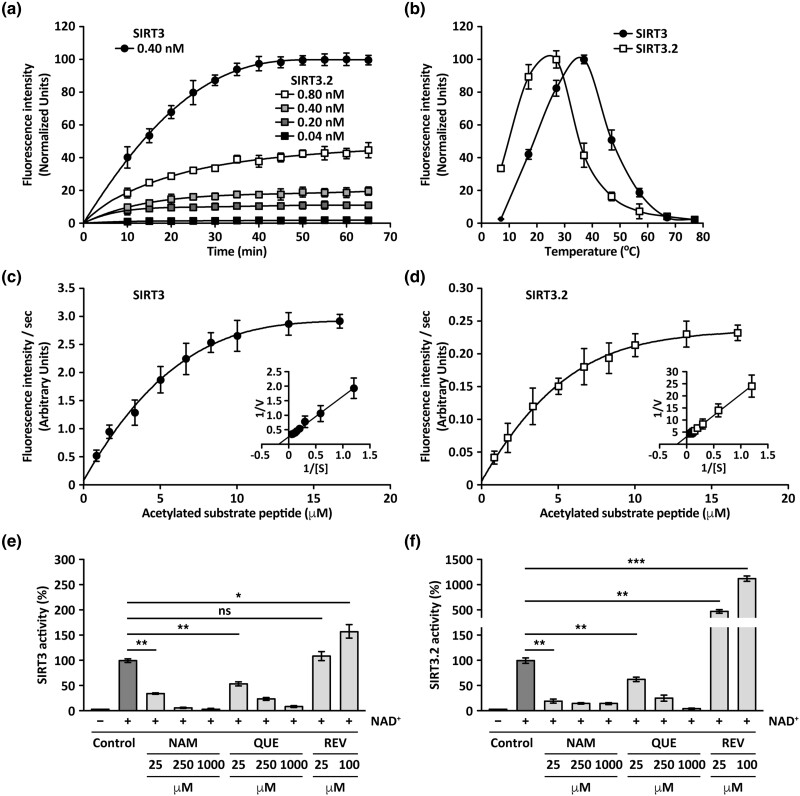
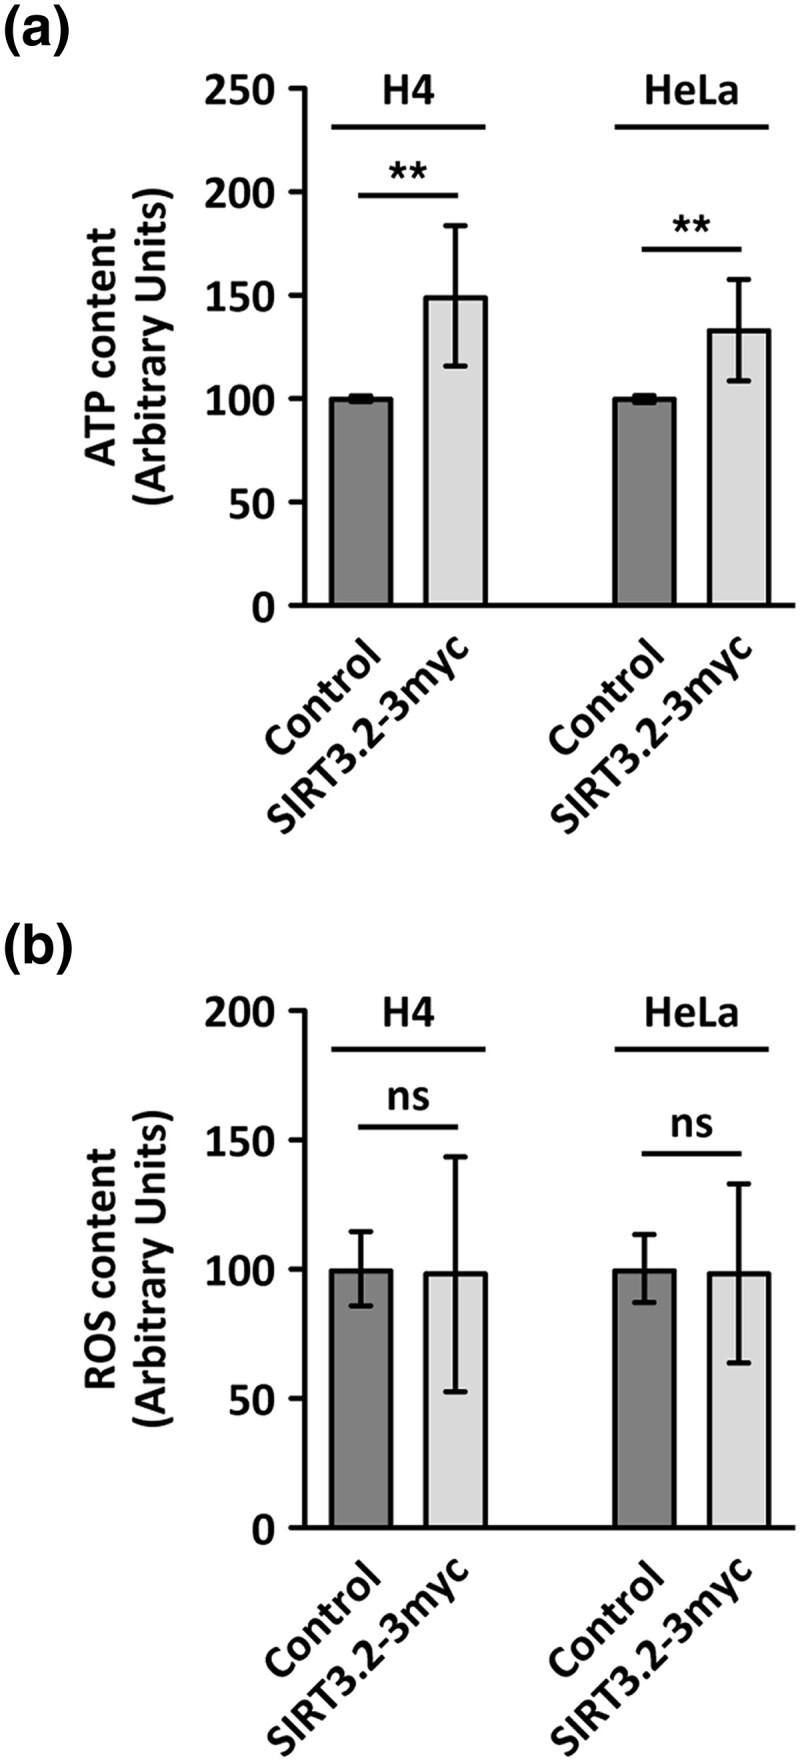
Studying the evolutionary history of gene families is a challenging and exciting task with a wide range of implications. In addition to exploring fundamental questions about the origin and evolution of genes, disentangling their evolution is also critical to those who do functional/structural studies to allow a deeper and more precise interpretation of their results in an evolutionary context. The sirtuin gene family is a group of genes that are involved in a variety of biological functions mostly related to aging. Their duplicative history is an open question, as well as the definition of the repertoire of sirtuin genes among vertebrates. Our results show a well-resolved phylogeny that represents an improvement in our understanding of the duplicative history of the sirtuin gene family. We identified a new sirtuin gene family member (SIRT3.2) that was apparently lost in the last common ancestor of amniotes but retained in all other groups of jawed vertebrates. According to our experimental analyses, elephant shark SIRT3.2 protein is located in mitochondria, the overexpression of which leads to an increase in cellular levels of ATP. Moreover, in vitro analysis demonstrated that it has deacetylase activity being modulated in a similar way to mammalian SIRT3. Our results indicate that there are at least eight sirtuin paralogs among vertebrates and that all of them can be traced back to the last common ancestor of the group that existed between 676 and 615 millions of years ago.

Keywords: SIRT; aging; deacetylase; gene duplication; gene family evolution; mitochondria.


Figures

<sc>Fig.</sc> 1.
Fig. 1.
Gene phylogeny, synteny, protein size, molecular weight, enzymatic activity, subcellular localization, functions, and diseases associated with sirtuin genes. Information regarding the sister-group relationships among sirtuin genes was obtained from this study, synteny from ENSEMBL v.106 (Howe et al. 2021), protein size from Fujita and Yamashita (2018), molecular weight from Vassilopoulos et al. (2011) whereas enzymatic activity, subcellular localization, functions, and diseases from Zhang et al. (2020). In the case of the SIRT3.2 of the elephant shark, synteny information was obtained from the NCBI (Sharma et al. 2019), protein size, molecular weight, enzymatic activity, and subcellular localization from this study.
<sc>Fig.</sc> 2.
Fig. 2.
Maximum-likelihood tree showing sister-group relationships among sirtuin genes of vertebrates. Numbers on the nodes correspond to support from the aBayes and ultrafast bootstrap values. NNT sequences from the human (Homo sapiens) mouse (Mus musculus), spotted gar (Lepisosteus oculatus), and zebrafish (Danio rerio) were used as outgroups (not shown). The scale denotes substitutions per site.
<sc>Fig.</sc> 3.
Fig. 3.
Maximum-likelihood tree showing sister-group relationships among SIRT3 and SIRT3.2 genes in vertebrates. Numbers on the nodes correspond to support from the aBayes and ultrafast bootstrap values. The scale denotes substitutions per site. This tree does not represent a novel phylogenetic analysis, it is the SIRT3/SIRT3.2 clade that was recovered from figure 2.
<sc>Fig.</sc> 4.
Fig. 4.
Phyletic distribution of sirtuin genes in vertebrates. The sister-group relationships among sirtuin genes were obtained from this study, whereas organismal phylogeny was obtained from the most updated phylogenetic hypotheses available in the literature (Iwabe et al. 2005; Delsuc et al. 2006, 2008; Hara et al. 2018).
<sc>Fig.</sc> 5.
Fig. 5.
(a) Patterns of conserved synteny in the chromosomal region that harbor SIRT3.2 genes in gnathostomes. Asterisks denote that the orientation of the genomic piece is from 3´ to 5´, gray lines represent intervening genes that do not contribute to conserved synteny. (b) Pairwise dot-plot comparison of the genomic region of the tropical clawed frog (Xenopus tropicalis) with the corresponding region in the human (Homo sapiens), opossum (Monodelphis domestica), chicken (Gallus gallus), gharial (Gavialis gangeticus), red-eared slider (Trachemys scripta), and green anole (Anolis carolinensis). Vertical lines denote exons and regions in between are introns. Dot-plots were based on the complete coding region in addition to 6.7 kb of upstream and downstream flanking sequence. The red circle highlights the vestiges of the fourth exon in the red-eared slider (Trachemys scripta).The genome assembly version of the species depicted in this figure is the following: Human: GRCh38.p13; Opossum: ASM229v1; Chicken: GRCg6a; Gharial: GavGan_comp1; red-eared slider: CAS_Tse_1.0; Green anole: AnoCar2.0v2; Tropical clawed frog: UCB_Xtro_10.0; Coelacanth: LatCha1; Spotted gar: LepOcu1 and Elephant shark: Callorhinchus_milii-6.1.3.
<sc>Fig.</sc> 6.
Fig. 6.
Alignment of the catalytic domain of SIRT3 in humans (Homo sapiens), and SIRT3 and SIRT3.2 of spotted gar (Lepisosteus oculatus), coelacanth (Latimeria chalumnae), and elephant shark (Callorhinchus milii). The shaded region denotes the catalytic domain. Diagnostic characters—that is, amino acid positions that distinguish between SIRT3 and SIRT3.2 gene lineages—are indicated with a rectangle.
<sc>Fig.</sc> 7.
Fig. 7.
Heatmap representation of within-species relative transcriptional levels of sirtuin paralogs between seven chosen tissues. Transcription values were calculated independently for each species and normalized over all tissues.
<sc>Fig.</sc> 8.
Fig. 8.
Structural model of elephant shark SIRT3.2 and expression of SIRT3.2-like-3myc in mammalian cells. (a) Superposition of the ribbon representations of elephant shark SIRT3.2 (amino acids G95 to Q365) and human SIRT3 (pdb: 4bvh.1.A; amino acids G121 to G392). Depicted in ellipses are the indicated functional/structural domains of SIRT3 and in dotted lines the binding sites for peptide substrates and NAD+. (b) The indicated cells were left untreated (Control, lanes 1, 3, and 5) or transfected to express SIRT3.2-3myc (lanes 2, 4, and 6), followed by immunoblot analysis with antibody against the c-Myc epitope or antibody against β-ACTIN used as loading control. The position of molecular mass markers is indicated on the left. SIRT3.2-3myc exhibits an electrophoretic mobility corresponding to a protein of 48.3 kDa, which is expected considering the extra amino acids of the three copies of the c-Myc epitope at the C-terminus. (c) and (d) H4 cells grown in glass coverslips were transfected to express SIRT3.2-3myc and incubated with the mitochondrial probe MitoTracker Orange (c) or mock incubated (d). Cells were fixed, permeabilized, and double- (c) or triple-labeled (d) with mouse monoclonal antibody against the c-Myc epitope (c and d), rabbit polyclonal antibody against the endoplasmic reticulum protein Cytoskeleton-associated protein 4 (P63; d) and sheep polyclonal antibody against the Golgi apparatus protein Trans-Golgi network integral membrane protein 2 (TGN46; c and d). Secondary antibodies were Alexa-Fluor-488-conjugated donkey antimouse IgG (SIRT3.2-3myc channel), Alexa-Fluor-594-conjugated donkey antirabbit IgG (P63 channel), and Alexa-Fluor-647-conjugated donkey antisheep IgG (TGN46 channel), and nuclei were stained with the DNA probe DAPI. Stained cells were examined by fluorescence microscopy. Insets: ×3 magnification with yellow arrows indicating colocalization (c) and green and red arrows indicating the lack of colocalization (d). Bar, 10 μm.
<sc>Fig.</sc> 9.
Fig. 9.
Comparison of deacetylase activity between human SIRT3 and elephant shark ΔNT-SIRT3.2. (af) Results obtained with a fluorometric deacetylation assay of an acetylated substrate peptide. (a) Time course of deacetylase activity at the indicated concentration of SIRT3 and concentrations of ΔNT-SIRT3.2. (b) Temperature dependence of deacetylase activity. (c) and (d) Michaelis–Menten plot and Lineweaver–Burk plot of SIRT3 (c) and ΔNT-SIRT3.2 (d) deacetylase activity. (e) and (f) NAD+ dependence and concentration-dependent effects of the SIRT3 inhibitors NAM and QUE and of the SIRT3 activator REV on the deacetylase activity of SIRT3 (e) and ΔNT-SIRT3.2 (f). In ad, graphs depict the mean ± standard deviation (n = 3). In ef, bars represent the mean ± standard deviation. Statistical analysis was performed using two-tailed unpaired Student's t-test (n = 3; * P < 0.05; ** P < 0.01; *** P < 0.001; ns, not statistically significant).
<sc>Fig.</sc> 10.
Fig. 10.
SIRT3.2-3myc expression causes an increment on ATP cellular content with no difference in ROS levels. (a) ATP levels were measured by a luciferin/luciferase bioluminescence assay in H4 and HeLa cells either left untreated (Control) or transiently expressing SIRT3.2-3myc. (b) ROS content was measured by the intensity fluorescence of the dye CM-H2DCFDA in H4 and HeLa cells either left untreated (Control) or transiently expressing SIRT3.2-3myc. Bars represent the mean ± standard deviation. Statistical analysis was performed using two-tailed unpaired Student's t-test (n = 4; ** P < 0.01; ns, not statistically significant).

Similar articles

Cited by

References

    1. Albalat R, Cañestro C. 2016. Evolution by gene loss. Nat Rev Genet. 17:379–391. - PubMed
    1. Albertson RC, Craig Albertson R, Cresko W, William Detrich H, Postlethwait JH. 2009. Evolutionary mutant models for human disease. Trends Genet. 25:74–81. - PMC - PubMed
    1. Altenhoff AM, Train C-M, Gilbert KJ, Mediratta I, Mendes de Farias T, Moi D, Nevers Y, Radoykova H-S, Rossier V, Warwick Vesztrocy A, et al. 2021. OMA orthology in 2021: website overhaul, conserved isoforms, ancestral gene order and more. Nucleic Acids Res. 49:D373–D379. - PMC - PubMed
    1. Altschul SF, Gish W, Miller W, Myers EW, Lipman DJ. 1990. Basic local alignment search tool. J Mol Biol. 215:403–410. - PubMed
    1. Anders S, Huber W. 2010. Differential expression analysis for sequence count data. Genome Biol. 11:R106. - PMC - PubMed

Publication types