. 2023 Jan 18;14(1):58-71.e5.
doi: 10.1016/j.cels.2022.12.006.

Instance segmentation of mitochondria in electron microscopy images with a generalist deep learning model trained on a diverse dataset

Affiliations

Instance segmentation of mitochondria in electron microscopy images with a generalist deep learning model trained on a diverse dataset

Ryan Conrad et al. Cell Syst. .

Abstract

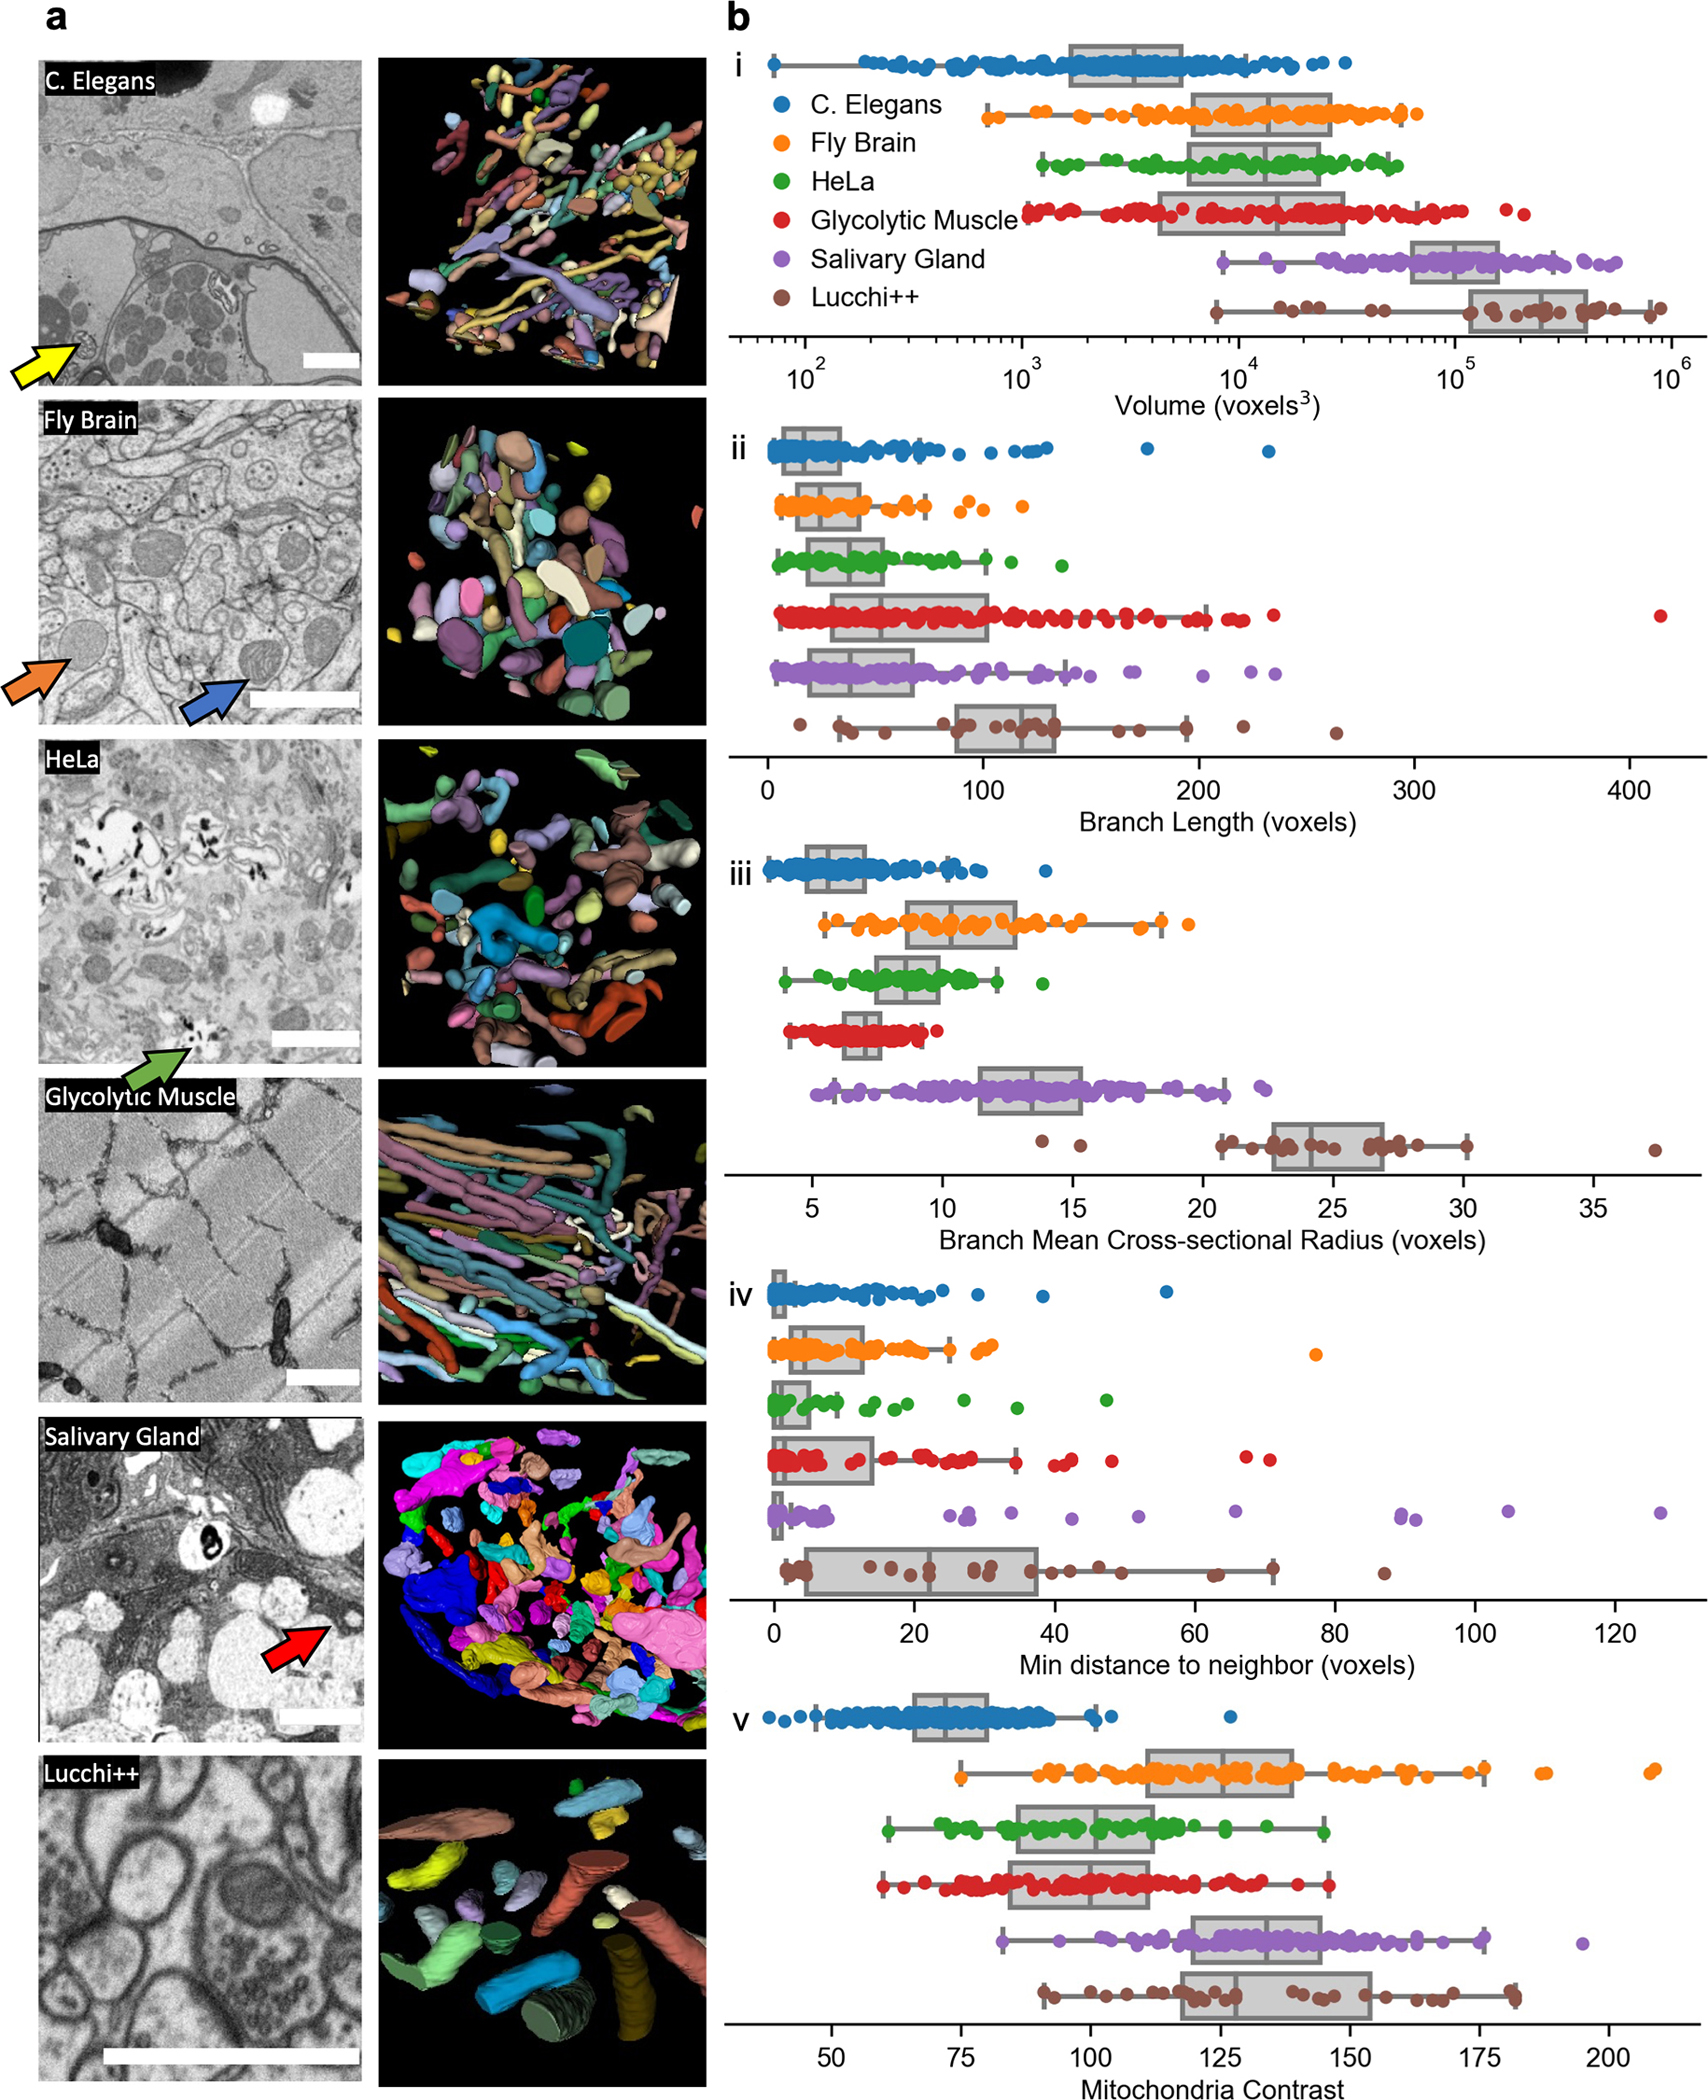
Mitochondria are extremely pleomorphic organelles. Automatically annotating each one accurately and precisely in any 2D or volume electron microscopy (EM) image is an unsolved computational challenge. Current deep learning-based approaches train models on images that provide limited cellular contexts, precluding generality. To address this, we amassed a highly heterogeneous ∼1.5 × 10⁶ image 2D unlabeled cellular EM dataset and segmented ∼135,000 mitochondrial instances therein. MitoNet, a model trained on these resources, performs well on challenging benchmarks and on previously unseen volume EM datasets containing tens of thousands of mitochondria. We release a Python package and napari plugin, empanada, to rapidly run inference, visualize, and proofread instance segmentations. A record of this paper's transparent peer review process is included in the supplemental information.

Keywords: benchmark; crowdsourcing; deep learning; electron microscopy; image dataset; mitochondria; panoptic; segmentation; volume EM; volume electron miscroscopy.


Conflict of interest statement

Declaration of interests The authors declare no competing interests.

Figures

Figure 1:
Figure 1:. Creation of a diverse and representative dataset for mitochondrial instance segmentation.
a. Schematic of the data curation pipeline. Volume EM reconstructions and 2D EM images were curated to create CEM1.5M. Random patches from previously labeled data (legacy annotations, red) and crowdsource annotated patches from CEM1.5M (green) were combined to form CEM-MitoLab. b. Example of crowdsourced annotation with ground truth (GT, top left), consensus annotation (bottom left) and ten independent student annotations of a representative image showing a high degree of consensus. c-e. Dataset distribution by various parameters in CEM-MitoLab. c. Imaging plane pixel sizes of volume EM images (n=489). Dashed lines, 2D EM images. d. Imaging technique, e. Source organism, f. Source tissue (vertebrates only, in vitro cells grouped under Not Defined; n=593).
Figure 2:
Figure 2:. Challenging and diverse volume EM benchmarks for evaluating automatic instance segmentation performance.
a. 2D representative images (left) and 3D reconstructions (right) for the benchmark test sets. Top to bottom: C. elegans, Fly brain, HeLa cell, Glycolytic muscle, Salivary gland, Lucchi++. Yellow arrow, membranous organelle; orange and blue arrows, lightly and darkly stained mitochondria; green arrow, heavy metal precipitate; red arrow, mitochondrion and tightly apposed salivary granule in the acinus. b. Comparison of individual mitochondria and box plots across benchmarks by (top to bottom): (i) volume (log scale), (ii) branch length, (iii) mean cross-section radius, (iv) minimum distance to neighbor (all in voxels) and (v) mitochondrial contrast. Blue, C. elegans n=241; orange, fly brain n=91; green, HeLa cell n=68; red, glycolytic muscle n=104; purple, salivary gland n=131; brown, Lucchi++ n=33. Scale bar 1 μm.
Figure 3:
Figure 3:. Deep learning model and postprocessing pipeline to create 2D or 3D instance segmentations.
a. Schematic of Panoptic-DeepLab showing the input grayscale image (left;, blue boxes, encoder layer outputs; black boxes, ASPP layer outputs; gray boxes, decoder layer output. Outputs of the network are (left to right) semantic segmentation, up-down offsets, left-right offsets, and the instance centers heatmap. Far right, instance segmentation created from the outputs. b. Instance matching across adjacent slices uses intersection-over-union (IoU) and intersection-over-area (IoA) scores. Clockwise from top left: predicted segmentation of slice j, j+1, IoU and IoA merging, IoU only merging. c. Result of median filtering in direction of black arrow d. From left to right: Stacked 2D segmentations of before matching, after forward matching only and after forward and backward matching. Black arrows denote direction of matching. e. An example of 3D instance segmentation of mitochondria after running inference in (left to right) xy, xz, yz directions, and far right, and merging them into a consensus.
Figure 4.
Figure 4.. MitoNet results on benchmarks.
a. Representative 2D images showing MitoNet segmentation performance; left column shows predictions and right column shows ground truth. Top to bottom: C. elegans, Fly brain, HeLa cell, Glycolytic muscle, Salivary gland, Lucchi++, and TEM benchmarks. b. Representative 3D ground truth and predicted segmentations from MitoNet on the volume EM benchmarks. Red and green, predicted mitochondrial instances, blue and orange, ground truth instances. Black arrow, example of segmentation expected to return a high IoU but low F1 score. c. Left, MitoNet F1 score on each benchmark as a function of IoU threshold; right, IoU scores. d. Left, MitoNet F1 scores on volume EM benchmarks as a function of IoU threshold, after model finetuning on a small fraction of labeled patches; right, IoU scores achieved by the finetuned models. Numbers indicate number of patches used for finetuning e. Left, comparison of mean F1 score for models trained on different datasets plotted against IoU threshold; right, mean IoU scores. All benchmarks except the salivary gland are included in the mean. Crowd., crowdsourced. Scale bar 1 μm.
Figure 5.
Figure 5.. MitoNet results on volumes of mouse liver and kidney.
a. Rows from top to bottom correspond to kidney distal tubule, kidney proximal tubule, and liver. Left column shows representative 2D images of MitoNet segmentation (scale bar, 5 μm); right column shows 3D predictions on the entire volume (small and boundary objects removed). b. Left column shows a zoomed in ROI of raw model predictions (basolateral surfaces of cells on top); right column shows representative mitochondrial models after manual cleanup. c. Plot of the fraction and type of cleanup operation required for a randomly chosen sample of model-predicted instances from kidney distal (n=347), kidney proximal (n=256) and liver (n=319) tissue. d. Plot of distance to the nearest basolateral surface, in microns, for randomly sampled mitochondria from kidney distal (blue) and kidney proximal (red) volumes after cleanup. e. Box plot comparisons of mitochondrial volume, surface area, cross-sectional radius, elongation, and flatness across the three volumes after cleanup (outliers not shown). Blue, kidney distal (n=405 for d and e), green, kidney proximal (n=250), orange, liver (n=321).

References

    1. Peddie CJ, and Collinson LM (2014). Exploring the third dimension: Volume electron microscopy comes of age. Micron 61, 9–19. 10.1016/J.MICRON.2014.01.009. - DOI - PubMed
    1. Titze B, and Genoud C (2016). Volume scanning electron microscopy for imaging biological ultrastructure. Biol. Cell 108, 307–323. 10.1111/BOC.201600024. - DOI - PubMed
    1. Scheffer LK, Xu CS, Januszewski M, Lu Z, Takemura SY, Hayworth KJ, Huang GB, Shinomiya K, Maitin-Shepard J, Berg S, et al. (2020). A connectome and analysis of the adult drosophila central brain. Elife 9, 1–74. 10.7554/ELIFE.57443. - DOI - PMC - PubMed
    1. Turner NL, Macrina T, Bae JA, Yang R, Wilson AM, Schneider-Mizell C, Lee K, Lu R, Wu J, Bodor AL, et al. (2022). Reconstruction of neocortex: Organelles, compartments, cells, circuits, and activity. Cell 0, 17. 10.1016/J.CELL.2022.01.023. - DOI - PMC - PubMed
    1. Yin W, Brittain D, Borseth J, Scott ME, Williams D, Perkins J, Own CS, Murfitt M, Torres RM, Kapner D, et al. (2020). A petascale automated imaging pipeline for mapping neuronal circuits with high-throughput transmission electron microscopy. Nat. Commun. 2020 111 11, 1–12. 10.1038/s41467-020-18659-3. - DOI - PMC - PubMed

Publication types

LinkOut - more resources