. 2023 Feb 21;4(2):100911.
doi: 10.1016/j.xcrm.2022.100911. Epub 2023 Jan 18.

Using patient-derived organoids to predict locally advanced or metastatic lung cancer tumor response: A real-world study

Affiliations

Using patient-derived organoids to predict locally advanced or metastatic lung cancer tumor response: A real-world study

Han-Min Wang et al. Cell Rep Med. .

Abstract

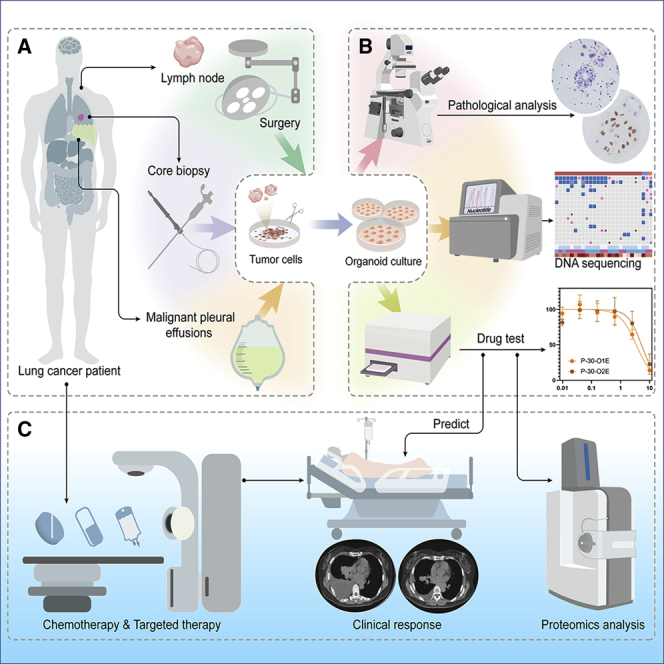
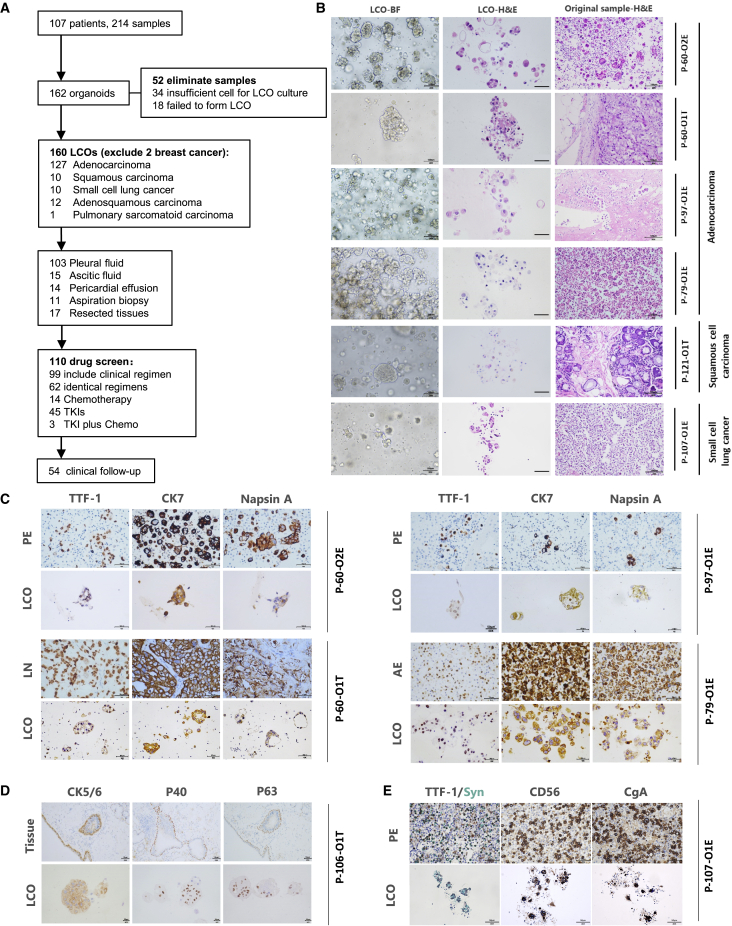
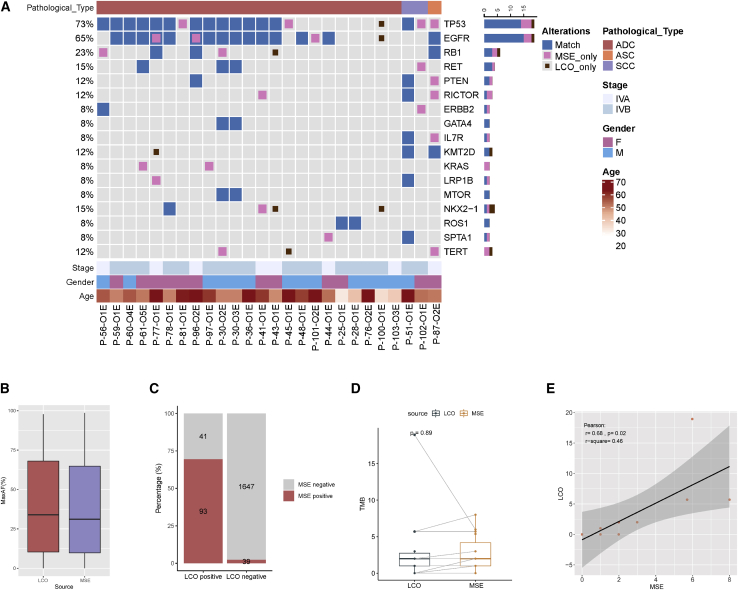
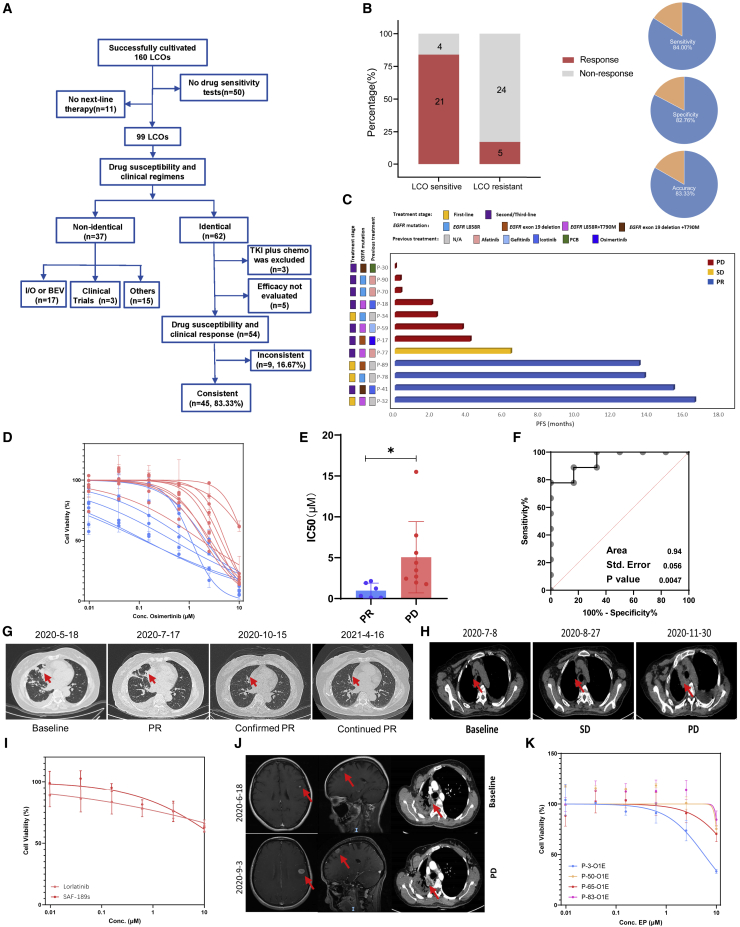
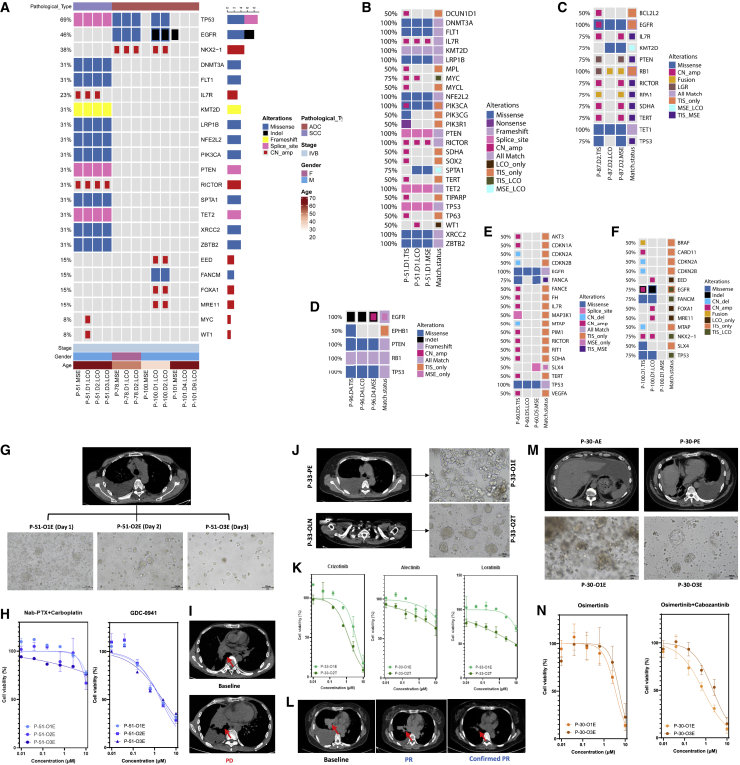
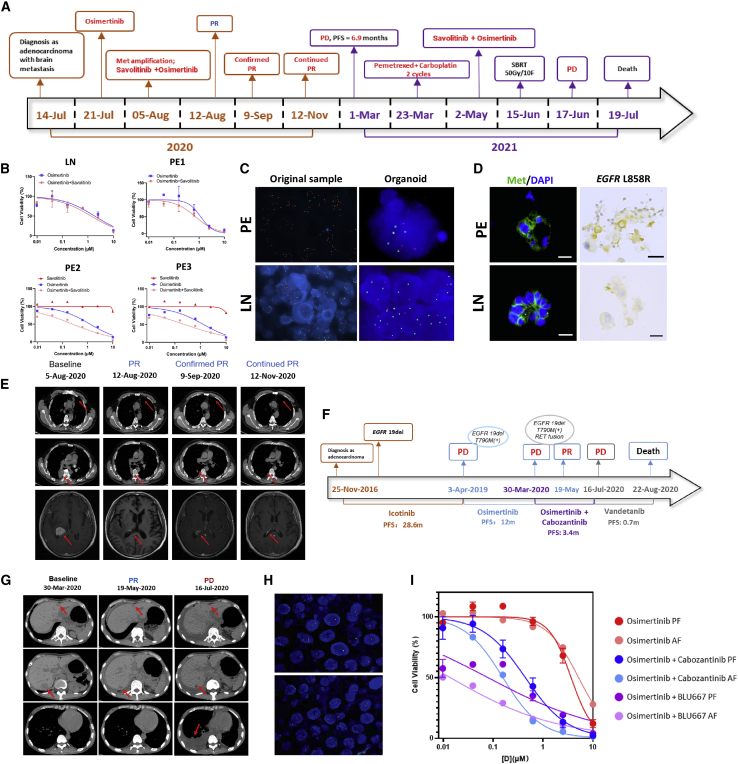
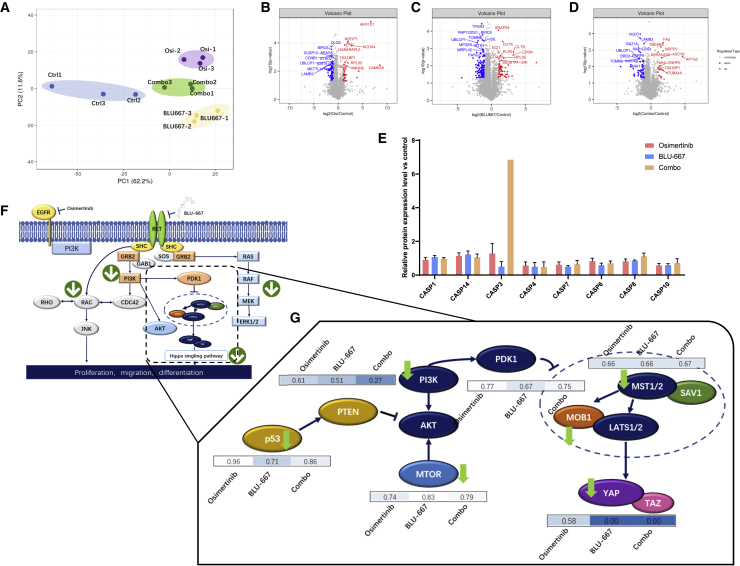
Predicting the clinical response to chemotherapeutic or targeted treatment in patients with locally advanced or metastatic lung cancer requires an accurate and affordable tool. Tumor organoids are a potential approach in precision medicine for predicting the clinical response to treatment. However, their clinical application in lung cancer has rarely been reported because of the difficulty in generating pure tumor organoids. In this study, we have generated 214 cancer organoids from 107 patients, of which 212 are lung cancer organoids (LCOs), primarily derived from malignant serous effusions. LCO-based drug sensitivity tests (LCO-DSTs) for chemotherapy and targeted therapy have been performed in a real-world study to predict the clinical response to the respective treatment. LCO-DSTs accurately predict the clinical response to treatment in this cohort of patients with advanced lung cancer. In conclusion, LCO-DST is a promising precision medicine tool in treating of advanced lung cancer.

Keywords: chemotherapy; drug sensitivity test; lung cancer; patient-derived organoid; personalized medicine; real-world study; targeted therapy.


Conflict of interest statement

Declaration of interests The authors declare no competing interests.

Figures

None
Graphical abstract
Figure 1
Figure 1
Study flow chart and preservation of lung histopathology in LCOs (A) Study workflow. See also Figure S1 and Tables S1–S3. (B) Bright-field images of LCOs (left column), H&E staining of advanced lung cancer-derived LCOs (middle column), and the primary tumor malignant effusions (right column), including the pericardial effusion, pleural effusion (PE), and ascitic effusion (AE). Scale bars, 100 μm. (C) IHC staining of the adenocarcinoma-derived LCOs as well as the original tissue with classic subtype markers TTF-1 (left column), CK7 (middle column), and Napsin A (right column). Scale bar, 50 μm. (D) IHC staining of CK5/6, P40, and P63 in squamous cell carcinoma. Scale bar for the tissue, 50 μm. Scale bar for the LCO, 20 μm. (E) IHC staining of TTF-1, Syn, CgA, and CD56 markers of small cell lung cancer. Scale bar, 50 μm.
Figure 2
Figure 2
Genomic profiling of LCO samples (A) The overlap of somatic alteration in effusion and LCO samples. Blue indicates alterations detected from both sources, pink indicates alterations that were present only in the effusion samples, and scarlet indicates alterations were present only in the LCO samples. See also Figures S2A and S2B, and Tables S1 and S2. (B) The difference of maxAF between effusion and LCO samples. (C) The concordance for somatic alterations between effusion and LCO samples. (D) The difference of TMB between effusion and LCO samples. p values are determined using the two-tailed t-test or Mann–Whitney U test for continuous variables. (E) Correlation between effusion-based and LCO-based TMB (Pearson correlation coefficient, two-tailed). ADC, adenocarcinoma; ASC, adenosquamous carcinoma; CN, copy number; F, female; Indel, small insertion and deletion; LCO, lung cancer organoid; LGR, large genomic rearrangements; M, male; maxAF, maximum allele frequency; MSE, malignant serous effusion; SCC, squamous cell carcinoma; TMB, tumor mutational burden.
Figure 3
Figure 3
Comparison of LCO-based drug screening and clinical response See also Figure S3 and Table S6. (A) Flowchart of LCO-DST and clinical follow-ups in this study. (B) The overall correlation between LCO-DST sensitivity and clinical response. (C) Swimming graph of the progression-free survival (PFS) of patients who received osimertinib treatment. (D) Dose-effect curves of LCO based on in vitro sensitivity of osimertinib. (E) Violin plot of the IC50 values of osimertinib for clinical PR and PD groups. (F) Receiver operating characteristic (ROC) analysis of osimertinib LCO drug tests showed an area under the curve (AUC) of 0.94 with a p value of 0.0047. p values are determined from the normal distribution (two-tail) for the comparison to a chance-level ROC curve (AUC = 0.5). (G) Computed tomography (CT) scan of P-41 at the baseline, PR, and confirmed PR stages. (H) CT scan of P-59 at the baseline, SD, and PD stages. (I) Dose-effect curve of loratinib and SAF-189s for LCOs derived from P-63. (J) CT scan of the brain and thoracic cavity of P-63 at baseline and PD stages. (K) Dose-effect curves of the EP regimen (etoposide and paclitaxel) for LCOs derived from P-3, P-50, P-65, P-83. ∗: p <0.05.
Figure 4
Figure 4
Stability and heterogeneity of LCOs (A) Concordance for somatic alterations detected in MSE and LCO samples at different sampling times in four patients. See also Figure S4. ADC, adenocarcinoma; CN, copy number; D, day; F, female; Indel, small insertion and deletion; LCO, lung cancer organoid; LGR, large genomic rearrangements; M, male; MSE, malignant serous effusion; P, patient; SCC, squamous cell carcinoma. (B) The concordance of SNVs between MSE and LCO of P-51. (C) The concordance of SNVs between MSE and LCO of P-87. (D) The concordance of SNVs between MSE and LCO of P-96. (E) The concordance of SNVs between MSE and LCO of P-60. (F) The concordance of SNVs between MSE and LCO of P-100. (G) CT scan of P-51 presents the location of the pleural effusion (PE) and bright-field images of the PE-derived LCOs on days 1, 2, and 3. (H) Dose-response curve of Nab-PTX plus carboplatin and GDC-0941 for LCOs of P-51. (I) CT scans of P-51 at the baseline and after Nab-PTX + carboplatin treatment. (J) CT scan of P-33 shows the location of the PE and lymph node (LN) and bright-field images of the PE- and LN-derived LCOs. (K) Dose-response curve of crizotinib, alectinib, and loratinib for P-33 LCOs. (L) CT scan of P-33 at the baseline and after alectinib treatment. (M) CT scan of P-30 shows the location of the ascitic effusion (AE) and PE, as well as the bright-field images of the AE- and PE-derived LCOs. (N) Dose-response curve of osimertinib and osimertinib + cabozantinib for P-30 LCOs.
Figure 5
Figure 5
LCOs predict dual-targeted therapy for drug-resistant cases See also Figure S5. (A) Disease progression of P-60. (B) Dose-effect curve of LCOs derived from the lymph node (LN) and pericardial effusion of P-60. (C) FISH of MET amplification of the LN, pericardial effusion, and LCOs derived from pericardial effusion and the LN. (D) Immunofluorescence staining of MET and DAPI, and immunohistochemistry staining of EGFR L858R for LCOs derived from pericardial effusion and lymph nodes of P-60. Scale bar, 20 μm. (E) CT scans indicating the progression of the disease of P-60. (F) Disease progression of P-61. (G) CT scans of P-61. (H) FISH of RET rearrangement in pleural effusion (PE) and ascitic effusion (AE)-derived organoids of P-61. (I) Dose-effect curve of LCOs derived from the PE and AE of P-61.
Figure 6
Figure 6
Proteomic profiles of pleural fluid-derived organoids indicated drug resistance mechanisms (A) PCA plot of the protein expression levels of different groups. The control group is shown in blue. The combination group, in which the LCOs were treated with both osimertinib and BLU-667, is shown in green. The groups treated with osimertinib (Osi) and BLU-667 alone are shown in purple and yellow, respectively. (B) Volcano plots of differentially expressed proteins (DEPs) are shown for the osimertinib versus control group. (C) Volcano plot of DEPs is shown for the BLU-667 versus control group. (D) Volcano plot of DEPs is shown for the combo versus control group. (E) Expression levels of the caspase family in osimertinib versus control (orange), BLU-667 versus control (blue), and combo versus control (light purple). (F) An overview of the alteration of the signaling cascade of EGFR and RET; arrows indicate the trend of the expression of related proteins. (G) Changes in the expression levels of key proteins among the osimertinib versus control, BLU-667 versus control, and combo versus control groups. See also Figure S6.

Comment in

References

    1. Sung H., Ferlay J., Siegel R.L., Laversanne M., Soerjomataram I., Jemal A., Bray F. Global cancer statistics 2020: GLOBOCAN estimates of incidence and mortality worldwide for 36 cancers in 185 countries. CA. Cancer J. Clin. 2021;71:209–249. doi: 10.3322/caac.21660. - DOI - PubMed
    1. Wang N., Mengersen K., Tong S., Kimlin M., Zhou M., Wang L., Hu W. Lung cancer mortality in China: spatial and temporal trends among subpopulations. Chest. 2019;156:972–983. doi: 10.1016/j.chest.2019.07.023. - DOI - PubMed
    1. Porcel J.M., Gasol A., Bielsa S., Civit C., Light R.W., Salud A. Clinical features and survival of lung cancer patients with pleural effusions. Respirology. 2015;20:654–659. doi: 10.1111/resp.12496. - DOI - PubMed
    1. Pauli C., Hopkins B.D., Prandi D., Shaw R., Fedrizzi T., Sboner A., Sailer V., Augello M., Puca L., Rosati R., et al. Personalized in vitro and in vivo cancer models to guide precision medicine. Cancer Discov. 2017;7:462–477. doi: 10.1158/2159-8290.CD-16-1154. - DOI - PMC - PubMed
    1. Wu L., Wang Y., Xu X., Liu Y., Lin B., Zhang M., Zhang J., Wan S., Yang C., Tan W. Aptamer-based detection of circulating targets for precision medicine. Chem. Rev. 2021;121:12035–12105. doi: 10.1021/acs.chemrev.0c01140. - DOI - PubMed

Publication types