. 2023 Jan;11(1):e005902.
doi: 10.1136/jitc-2022-005902.

Clinicopathological and predictive value of MAIT cells in non-small cell lung cancer for immunotherapy

Affiliations

Clinicopathological and predictive value of MAIT cells in non-small cell lung cancer for immunotherapy

Lin Shi et al. J Immunother Cancer. 2023 Jan.

Abstract

Background: Immune-checkpoint inhibitors (ICIs) remain ineffective in a large group of non-small cell lung cancer (NSCLC) patients. Mucosal-associated invariant T (MAIT) cells, a population of unconventional innate-like T lymphocytes abundant in the human body, play important roles in human malignancies. Little is known about the immune characteristics of MAIT cells in NSCLC and correlation with prognosis and response rate of ICIs treatment.

Methods: To investigate the distribution, activation status, and function of MAIT cells in NSCLC patients and their correlations with anti-PD-1 immunotherapy, MAIT cells in peripheral blood, tumor and paratumor samples from NSCLC patients with or without anti-PD-1 immunotherapy were analyzed using flow cytometry and single-cell RNA-sequencing.

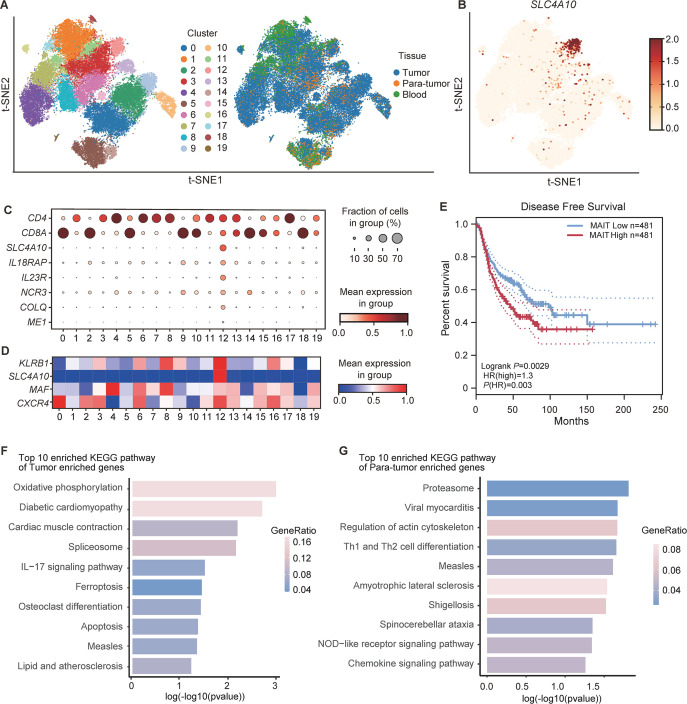
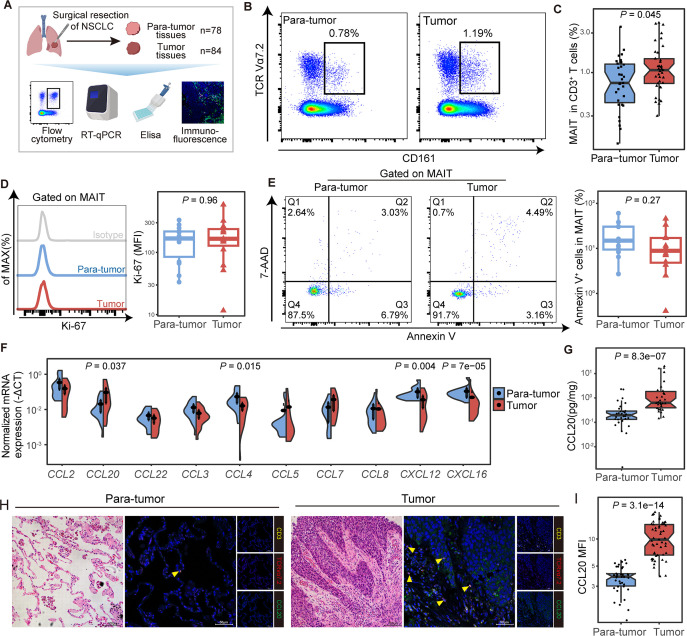
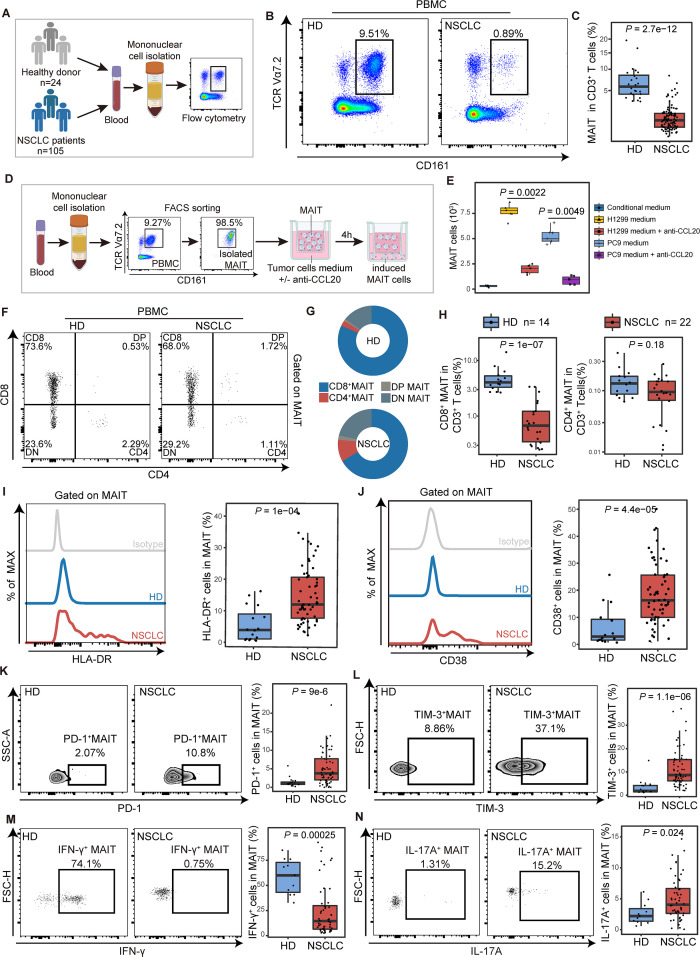
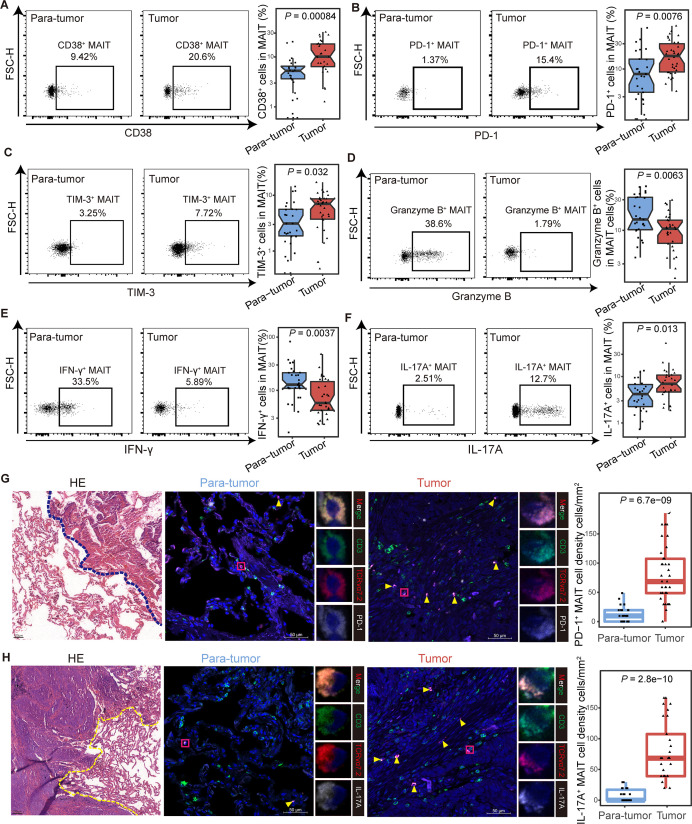
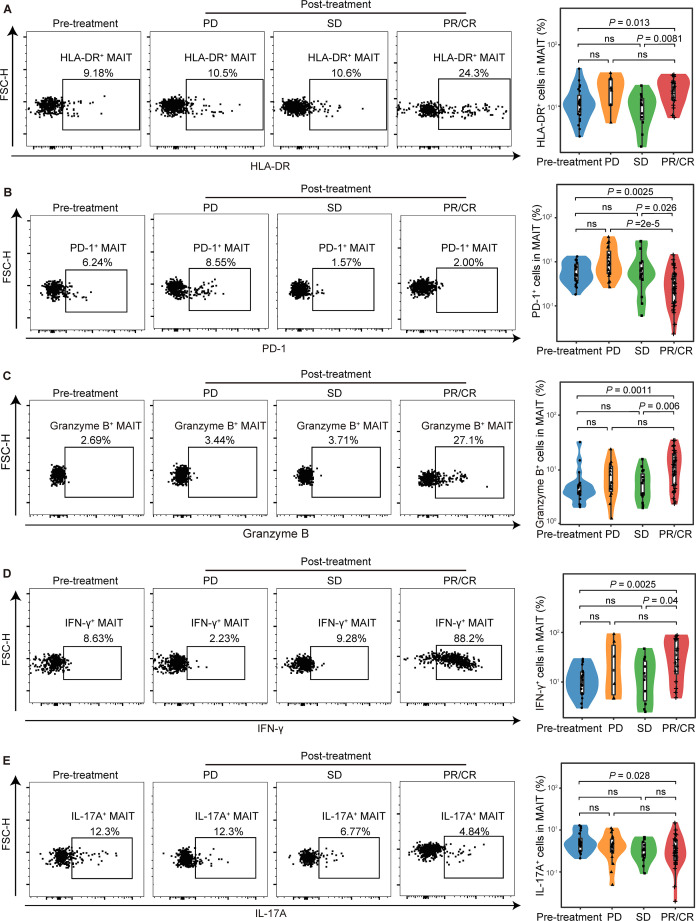
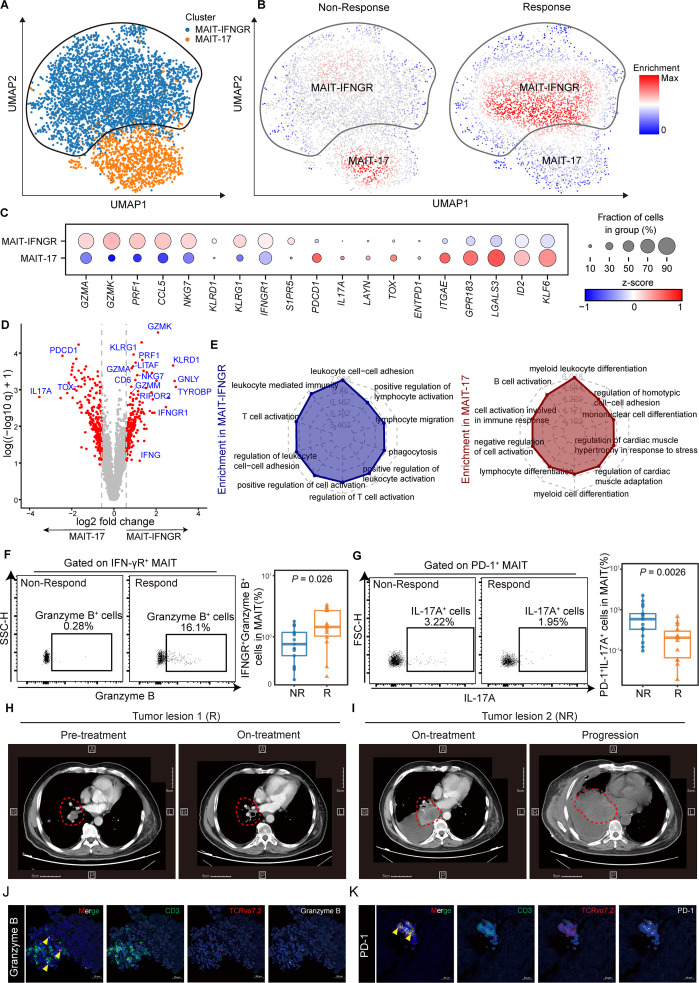
Results: MAIT cells were enriched in the tumor lesions of NSCLC patients migrating from peripheral blood via the CCR6-CCL20 axis. Both peripheral and tumor-infiltrating MAIT cells displayed an exhausted phenotype with upregulated PD-1, TIM-3, and IL-17A while less IFN-γ. Anti-PD-1 therapy reversed the function of circulating MAIT cells with higher expression of IFN-γ and granzyme B. Subcluster MAIT-17s (defined as cells highly expressing exhausted and Th17-related genes) mainly infiltrated in the non-responsive tissues, while the subcluster MAIT-IFNGRs (cells expressing genes related to cytotoxic function) were mainly enriched in responsive tissues. Moreover, we found predictive value of circulating MAIT cells for anti-PD-1 immunotherapy in NSCLC patients.

Conclusions: MAIT cells shifted to an exhausted tumor-promoting phenotype in NSCLC patients and the circulating MAIT subset could be a predictor for patients who respond to anti-PD-1 immunotherapy.

Keywords: biomarkers, tumor; immunotherapy; lung neoplasms.


Conflict of interest statement

Competing interests: No, there are no competing interests.

Figures

Figure 1
Figure 1
The abundance and transcriptional profiles of MAIT cells in non-small cell lung cancer (NSCLC) patients based on scRNA-seq data (14 patients from GSE99254 and 11 patients from GSE162498). (A) t-Distributed Stochastic Neighbor Embedding (t-SNE) plot displaying 20 clusters identified on the basis of gene expression levels of CD3+ T cells in peripheral blood, tumor, and paratumor tissues from NSCLC patients. Cells are colored according to the 20 clusters defined in an unsupervised manner. (B) Expression of SLC4A10 in CD3+ T cells from peripheral blood, tumor and paratumor tissues of NSCLC patients. (C) Dot plot for markers characterizing MAIT cells with tumor-homing properties in NSCLC patients. The color intensity of each dot corresponds to the average gene expression across all cells in each cluster. (D) Dot plot for selected markers characterizing mucosal-associated invariant T (MAIT) cells with tumor-homing properties (cluster 12) that were reported previously. The color intensity of each dot corresponds to the average gene expression across all cells in each cluster. (E) Kaplan-Meier curves for disease-free survival (DFS) according to MAIT cell frequency in NSCLC patients from the TCGA database. (F) The top 10 enriched KEGG pathway of tumor enriched genes in MAIT cells from NSCLC patients. (G) The top 10 enriched KEGG pathway of paratumor enriched genes in MAIT cell from NSCLC patients. Survival analysis was determined by the log-rank (Mantel-Cox) test.
Figure 2
Figure 2
Mucosal-associated invariant T (MAIT) cells were enriched in tumor tissues potentially via the CCR6-CCL20 axis in non-small cell lung cancer (NSCLC) patients. (A) Scheme of the study design. Flow cytometry was applied to analyze MAIT cells distribution in tumor and paratumor tissues of patients with NSCLC. (B, C) Representative plots of MAIT cells (gated on CD3+ CD161+ TCR Vα7.2+) in tumor and paratumor tissues of NSCLC patients and its summary data (paratumor, n=31; tumor, n=37). (D) Representative plots of Ki-67 expression in MAIT cells from tumor and paratumor tissues of NSCLC patients and its summary data (n=14). (E) Representative Annexin V/7-ADD dot plots that demonstrate the percentage of apoptotic MAIT cells in tumor and para-tumor tissues of NSCLC patients and its summary data (n=12). (F) Relative expressions of chemokines that recruit MAIT cells in tumor and para-tumor tissues of NSCLC patients (n=20) using quantitative real-time PCR (RT-qPCR). (G) Expression of CCL20 in paired tumor and paratumor tissues of NSCLC patients (n=30) by ELISA. (H, I) Tumor and paratumor tissue sections were stained with hematoxylin and eosin (HE) (left) and immunofluorescence staining for CD3, TCR Vα7.2, and CCL20 (right) and its summary data. Immunofluorescence was performed on paired paratumor and tumor tissues from 7 NSCLC patients. Each dot represents one individual high-power field. Scale bar, 100 µm or 50 µm. The upper and lower ends of the boxes represented IQR of values. The lines in the boxes represented median value. Statistical significance was calculated via Mann-Whitney U test.
Figure 3
Figure 3
The chemotaxis and functional phenotype of mucosal-associated invariant T (MAIT) cells from PBMCs in non-small cell lung cancer (NSCLC) patients. (A) Scheme of the study design. Flow cytometry was applied to analyze MAIT cells from PBMCs of healthy donors (HD) and NSCLC patients. (B and C) Representative plots of MAIT cells (gated on CD3+CD161+TCR Vα7.2+) in peripheral blood of healthy donors and NSCLC patients and its summary data. (HD, n=16; NSCLC, n=61). (D) Flow chart of in vitro MAIT cell chemotactic migration assay. The purity of isolated MAITs is shown. (E) Summary data of MAIT cell migration treated with or without the neutralizing antibody (±anti-CCL20) in the bottom. MAIT cells (103) induced in each condition were evaluated (n=6). (F) Representative plots of MAIT cell subsets (gated on CD3+ CD161+ TCR Vα7.2+) from PBMCs of healthy donors (HD) and NSCLC patients. (G) MAIT cell subset composition in peripheral blood of HD and NSCLC patients. (H) Quantification of CD8+ MAIT cells and CD4+ MAIT cells in CD3+ T cells in peripheral blood of HD and NSCLC patients. (HD, n=14; NSCLC, n=22). (I and J) Expression of the activation markers HLA-DR and CD38 on MAIT cells from PBMCs of HD and NSCLC patients detected by FCM (gated on CD3+ CD161+ TCR Vα7.2+) and their summary data. (HD, n=16; NSCLC, n=61). (K and L) Expression of the immune inhibitory molecules PD-1 and TIM-3 on MAIT cells from PBMCs of HD and NSCLC patients detected by FCM (gated on CD3+ CD161+ TCR Vα7.2+) and their summary data. (HD, n=16; NSCLC, n=61). (M and N) Expression of the effector molecules IFN-γ and IL-17A in MAIT cells from PBMCs of HD and NSCLC patients detected by FCM (gated on CD3+ CD161+ TCR Vα7.2+) after stimulated with PMA and ionomycin for 4 hours and their summary data. (HD, n=11; NSCLC, n=52). The upper and lower ends of the boxes represented IQR of values. The lines in the boxes represented median value. Statistical significance was calculated via Mann-Whitney U test. PBMC, peripheral blood mononuclear cells.
Figure 4
Figure 4
Functional phenotype of tumor-infiltrating mucosal-associated invariant T (MAIT) cells in non-small cell lung cancer (NSCLC) patients. (A) Expression of the activation marker CD38 on MAIT cells from tumor and para-tumor tissues of NSCLC patients detected by FCM (gated on CD3+ CD161+ TCR Vα7.2+) and its summary data. (Paratumor, n=27; tumor, n=28). (B and C) Expression of the immune inhibitory molecules PD-1 (B) and TIM-3 (C) on MAIT cells from tumor and paratumor tissues of NSCLC patients detected by FCM (gated on CD3+ CD161+ TCR Vα7.2+) and their summary data. (Paratumor, n=27; tumor, n=34). (D–F) Expression of the effector molecules granzyme B (D), IFN-γ (E) and IL-17A (F) in MAIT cells from tumor and para-tumor tissues of NSCLC patients detected by FCM (gated on CD3+ CD161+ TCR Vα7.2+) after stimulated with PMA and ionomycin for 4 hours and their summary data. (Paratumor, n=27; tumor, n=30). (G) Tumor and paratumor tissue sections were stained with hematoxylin and eosin (left) and immunofluorescence staining for CD3, TCR Vα7.2, and PD-1 (right) and summary of density information of PD-1+ MAIT cells. Scale bar, 50 µm. (H) Tumor and paratumor tissue sections were stained with H&E (left) and immunofluorescence staining for CD3, TCR Vα7.2, and IL-17A (right) and summary of density information of IL-17A+ MAIT cells. Immunofluorescence was performed on paired paratumor and tumor tissues from 5 NSCLC patients. Each dot represents one individual high-power field. Scale bar, 100 µm or 50 µm. The upper and lower ends of the boxes represented IQR of values. The lines in the boxes represented median value. Statistical significance was calculated via Mann-Whitney U test. FCM, flow cytometry; PMA, phorbol-12-myristate-13-acetate.
Figure 5
Figure 5
Functional alterations of circulating mucosal-associated invariant T (MAIT) cells in non-small cell lung cancer (NSCLC) patients who responded to anti-PD-1 therapy. Expression of HLA-DR (A), PD-1 (B), granzyme B (C), and IFN-γ (D), and IL-17A (E) in MAIT cells from peripheral blood of pretreatment NSCLC patients (HLA-DR, PD-1, n=26; IFN-γ, granzyme B, IL-17A, n=20), patients with progressive disease (PD) (HLA-DR, n=8; PD-1, n=18; IFN-γ, n=6; granzyme B, n=18; IL-17A, n=15), patients with stable disease (SD) (HLA-DR, n=11; PD-1, n=15; IFN-γ, n=11; granzyme B, IL-17A, n=15) and patients with complete response or partial response (CR/PR) (HLA-DR, n=18; PD-1, n=31; IFN-γ, n=16; granzyme B, IL-17A, n=29) detected by FCM (gated on CD3+ CD161+ TCR Vα7.2+) and their summary data. The upper and lower ends of the boxes represented IQR of values. The lines in the boxes represented median value. Statistical significance was calculated via Mann-Whitney U test or one-way ANOVA and Tukey multiple comparison tests. ANOVA, analysis of variance.FCM, flow cytometry.
Figure 6
Figure 6
Mucosal-associated invariant T (MAIT) cells can be devided into two different subclusters and are associated with immune-checkpoint inhibitor (ICI) responsiveness. (A) UMAP (uniform manifold approximation and projection) plot displaying two subclusters identified on the basis of gene expression levels of MAIT cells from paired non-small cell lung cancer (NSCLC) tumor tissues pre-anti-PD-1 and post-anti-PD-1 therapy (GSE176022). Cells are colored according to the two subclusters defined in an unsupervised manner. (B) UMAP plot displaying MAIT cell subclusters enrichment in tumor tissues from the responders (R, n=6) and non-responders (NR, n=8). (C) Dot plot for markers characterizing MAIT-IFNGR and MAIT-17 cells in NSCLC tumor tissues. The color intensity of each dot corresponds to the z-score across all cells in each cluster. (D) Volcano plot showing differentially expressed genes between the MAIT-17 and MAIT-IFNGR subclusters. Each red dot denotes an individual gene with adjusted q<0.05 and fold change >1.5. (E) Radar chart for gene enrichment in MAIT-IFNGR and MAIT-17. (F) Expression of granzyme B on tumor-infiltrating IFN-γR + MAIT cells of NSCLC patients who received anti-PD-1 therapy detected by FCM (gated on CD3+ CD161+ TCR Vα7.2+ IFN-γR+) and its summary data (NR, n=17; R, n=14). (G) Expression of IL-17A on tumor-infiltrating PD-1+ MAIT cells of NSCLC patients who received anti-PD-1 therapy detected by FCM (gated on CD3+ CD161+ TCR Vα7.2+ PD-1+) and its summary data (NR, n=17; R, n=14).(H and I) CT scan of NSCLC patient who received anti-PD-1 therapy. Respective tumor tissue sections were immunofluorescence stained with anti-CD3, TCR Vα7.2, granzyme B (J), and PD-1 (K). Scale bar, 20 µm. The upper and lower ends of the boxes represented the IQR of values. The lines in the boxes represented the median value. Statistical significance was calculated via Mann-Whitney U test.

Similar articles

Cited by

References

    1. Hirsch FR, Scagliotti GV, Mulshine JL, et al. . Lung cancer: current therapies and new targeted treatments. Lancet 2017;389:299–311. 10.1016/S0140-6736(16)30958-8 - DOI - PubMed
    1. Doroshow DB, Sanmamed MF, Hastings K, et al. . Immunotherapy in non-small cell lung cancer: facts and hopes. Clin Cancer Res 2019;25:4592–602. 10.1158/1078-0432.CCR-18-1538 - DOI - PMC - PubMed
    1. Niu M, Yi M, Li N, et al. . Predictive biomarkers of anti-PD-1/PD-L1 therapy in NSCLC. Exp Hematol Oncol 2021;10:18. 10.1186/s40164-021-00211-8 - DOI - PMC - PubMed
    1. Peters S, Kerr KM, Stahel R. PD-1 blockade in advanced NSCLC: a focus on pembrolizumab. Cancer Treat Rev 2018;62:39–49. 10.1016/j.ctrv.2017.10.002 - DOI - PubMed
    1. Rizvi NA, Hellmann MD, Snyder A, et al. . Cancer immunology. mutational landscape determines sensitivity to PD-1 blockade in non-small cell lung cancer. Science 2015;348:124–8. 10.1126/science.aaa1348 - DOI - PMC - PubMed

Publication types

MeSH terms