

Optimization of Albuminuria-Lowering Treatment in Diabetes by Crossover Rotation to Four Different Drug Classes: A Randomized Crossover Trial
- PMID: 36657986
- PMCID: PMC10020026
- DOI: 10.2337/dc22-1699
Optimization of Albuminuria-Lowering Treatment in Diabetes by Crossover Rotation to Four Different Drug Classes: A Randomized Crossover Trial
Abstract
Objective: Renin-angiotensin system (RAS) inhibitors decrease the urinary albumin to creatinine ratio (UACR) but are ineffective in up to 40% of patients. We hypothesized that rotation through different drug classes overcomes RAS inhibitor resistance and tested this in a randomized crossover trial.
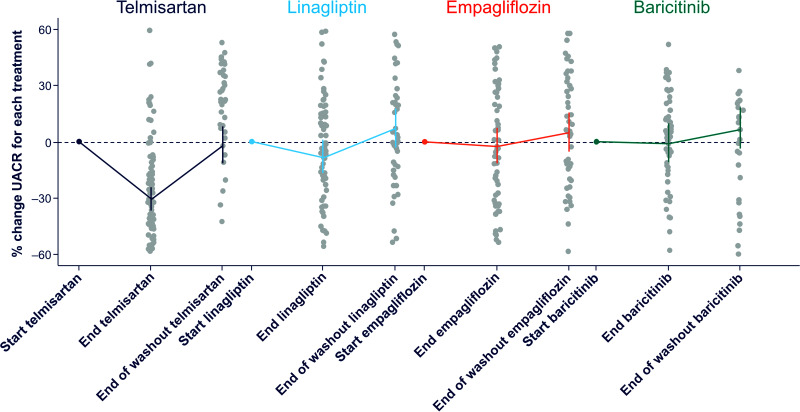
Research design and methods: We assigned 26 adults with type 1 diabetes and 37 with type 2 diabetes and UACR between 30 and 500 mg/g and estimated glomerular filtration rate >45 mL/min/1.73 m2 to 4-week treatment periods with telmisartan 80 mg, empagliflozin 10 mg, linagliptin 5 mg, and baricitinib 2 mg in random order, separated by 4-week washout periods. Each participant was then re-exposed for 4 weeks to the drug that induced that individual's largest UACR reduction. Primary outcome was the difference in UACR response to the best-performing drug during the confirmation period versus UACR response to the other three drugs.
Results: There was substantial variation in the best-performing drug. Telmisartan was best performing for 33 participants (52%), empagliflozin and linagliptin in 11 (17%), and baricitinib in 8 participants (13%). The individuals' best-performing drug changed UACR from baseline during the first and confirmatory exposures by a mean of -39.6% (95% CI -44.8, -33.8; P < 0.001) and -22.4% (95% CI -29.7, -12.5; P < 0.001), respectively. The Pearson correlation for first versus confirmatory exposure was 0.39 (P = 0.017). The mean change in UACR with the other three drugs was +1.6% (95% CI -4.3%, 8.0%; P = 0.593 versus baseline; difference versus individuals' best-performing drug at confirmation, 30.9% [95% CI 18.0, 45.3]; P < 0.001).
Conclusions: We demonstrated a large and reproducible variation in participants' responses to different UACR-lowering drug classes. These data support systematic rotation through different drug classes to overcome therapy resistance to RAS inhibition.
© 2023 by the American Diabetes Association.
Conflict of interest statement
Figures


Similar articles
-
Overall and inter-individual effect of four different drug classes on soluble urokinase plasminogen activator receptor in type 1 and type 2 diabetes.Diabetes Obes Metab. 2023 Nov;25(11):3152-3160. doi: 10.1111/dom.15209. Epub 2023 Jul 7. Diabetes Obes Metab. 2023. PMID: 37417375 Clinical Trial.
-
Effects of empagliflozin on the urinary albumin-to-creatinine ratio in patients with type 2 diabetes and established cardiovascular disease: an exploratory analysis from the EMPA-REG OUTCOME randomised, placebo-controlled trial.Lancet Diabetes Endocrinol. 2017 Aug;5(8):610-621. doi: 10.1016/S2213-8587(17)30182-1. Epub 2017 Jun 27. Lancet Diabetes Endocrinol. 2017. PMID: 28666775
-
Albuminuria-Lowering Effect of Dapagliflozin, Eplerenone, and Their Combination in Patients with Chronic Kidney Disease: A Randomized Crossover Clinical Trial.J Am Soc Nephrol. 2022 Aug;33(8):1569-1580. doi: 10.1681/ASN.2022020207. Epub 2022 Apr 19. J Am Soc Nephrol. 2022. PMID: 35440501 Free PMC article. Clinical Trial.
-
Association of Empagliflozin Treatment With Albuminuria Levels in Patients With Heart Failure: A Secondary Analysis of EMPEROR-Pooled.JAMA Cardiol. 2022 Nov 1;7(11):1148-1159. doi: 10.1001/jamacardio.2022.2924. JAMA Cardiol. 2022. PMID: 36129693 Free PMC article. Clinical Trial.
-
Effect of SGLT2 inhibitor on renal function in patients with type 2 diabetes mellitus: a systematic review and meta-analysis of randomized controlled trials.Int Urol Nephrol. 2019 Apr;51(4):655-669. doi: 10.1007/s11255-019-02112-6. Epub 2019 Mar 4. Int Urol Nephrol. 2019. PMID: 30830656
Cited by
-
Combination therapy for kidney disease in people with diabetes mellitus.Nat Rev Nephrol. 2024 Jul;20(7):433-446. doi: 10.1038/s41581-024-00827-z. Epub 2024 Apr 3. Nat Rev Nephrol. 2024. PMID: 38570632 Review.
-
Experimental Designs for Multicomponent Interventions in Kidney and Cardiometabolic Diseases.J Am Soc Nephrol. 2024 Oct 1;35(10):1438-1441. doi: 10.1681/ASN.0000000000000449. Epub 2024 Jul 5. J Am Soc Nephrol. 2024. PMID: 39078403 No abstract available.
-
Combining SGLT2is, GLP1-RAs and nsMRAs in Diabetes: A Scoping Review of Current and Future Perspectives.Diabetes Ther. 2025 May;16(5):799-811. doi: 10.1007/s13300-025-01726-7. Epub 2025 Mar 15. Diabetes Ther. 2025. PMID: 40088324 Free PMC article. Review.
-
Studying and learning.J Diabetes. 2023 Mar;15(3):200-203. doi: 10.1111/1753-0407.13379. Epub 2023 Mar 7. J Diabetes. 2023. PMID: 36882995 Free PMC article. No abstract available.
-
Albuminuria, Forgotten No More: Underlining the Emerging Role in CardioRenal Crosstalk.J Clin Med. 2024 Jan 29;13(3):777. doi: 10.3390/jcm13030777. J Clin Med. 2024. PMID: 38337471 Free PMC article. Review.
References
-
- Brenner BM, Cooper ME, de Zeeuw D, et al. .; RENAAL Study Investigators . Effects of losartan on renal and cardiovascular outcomes in patients with type 2 diabetes and nephropathy. N Engl J Med 2001;345:861–869 - PubMed
-
- Lewis EJ, Hunsicker LG, Clarke WR, et al. .; Collaborative Study Group . Renoprotective effect of the angiotensin-receptor antagonist irbesartan in patients with nephropathy due to type 2 diabetes. N Engl J Med 2001;345:851–860 - PubMed
-
- Parving HH, Lehnert H, Bröchner-Mortensen J, Gomis R, Andersen S; Irbesartan in Patients with Type 2 Diabetes and Microalbuminuria Study Group . The effect of irbesartan on the development of diabetic nephropathy in patients with type 2 diabetes. N Engl J Med 2001;345:870–878 - PubMed
-
- Coresh J, Heerspink HJL, Sang Y, et al. .; Chronic Kidney Disease Prognosis Consortium and Chronic Kidney Disease Epidemiology Collaboration . Change in albuminuria and subsequent risk of end-stage kidney disease: an individual participant-level consortium meta-analysis of observational studies. Lancet Diabetes Endocrinol 2019;7:115–127 - PMC - PubMed
Publication types
MeSH terms
Substances
LinkOut - more resources
Full Text Sources
Medical
