

Cutaneous α-Synuclein Signatures in Patients With Multiple System Atrophy and Parkinson Disease
- PMID: 36657992
- PMCID: PMC10103107
- DOI: 10.1212/WNL.0000000000206772
Cutaneous α-Synuclein Signatures in Patients With Multiple System Atrophy and Parkinson Disease
Erratum in
-
Cutaneous α-Synuclein Signatures in Patients With Multiple System Atrophy and Parkinson Disease.Neurology. 2023 Oct 10;101(15):684. doi: 10.1212/WNL.0000000000207614. Epub 2023 Jun 30. Neurology. 2023. PMID: 37399431 Free PMC article. No abstract available.
Abstract
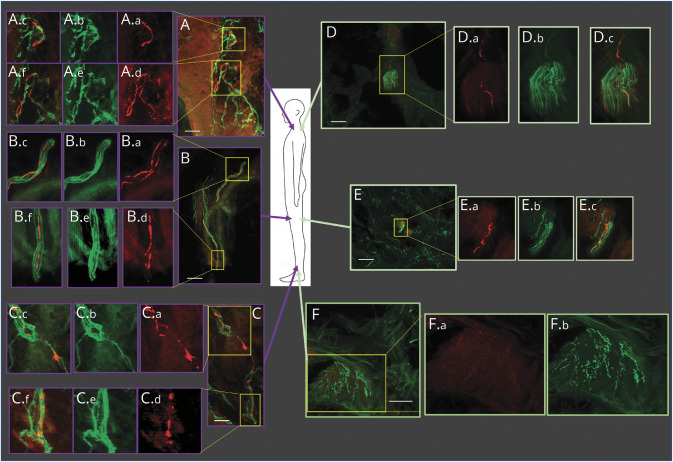
Background and objectives: Multiple system atrophy (MSA) is a progressive neurodegenerative disorder caused by the abnormal accumulation of α-synuclein in the nervous system. Clinical features include autonomic and motor dysfunction, which overlap with those of Parkinson disease (PD), particularly at early disease stages. There is an unmet need for accurate diagnostic and prognostic biomarkers for MSA and, specifically, a critical need to distinguish MSA from other synucleinopathies, particularly PD. The purpose of the study was to develop a unique cutaneous pathologic signature of phosphorylated α-synuclein that could distinguish patients with MSA from patients with PD and healthy controls.
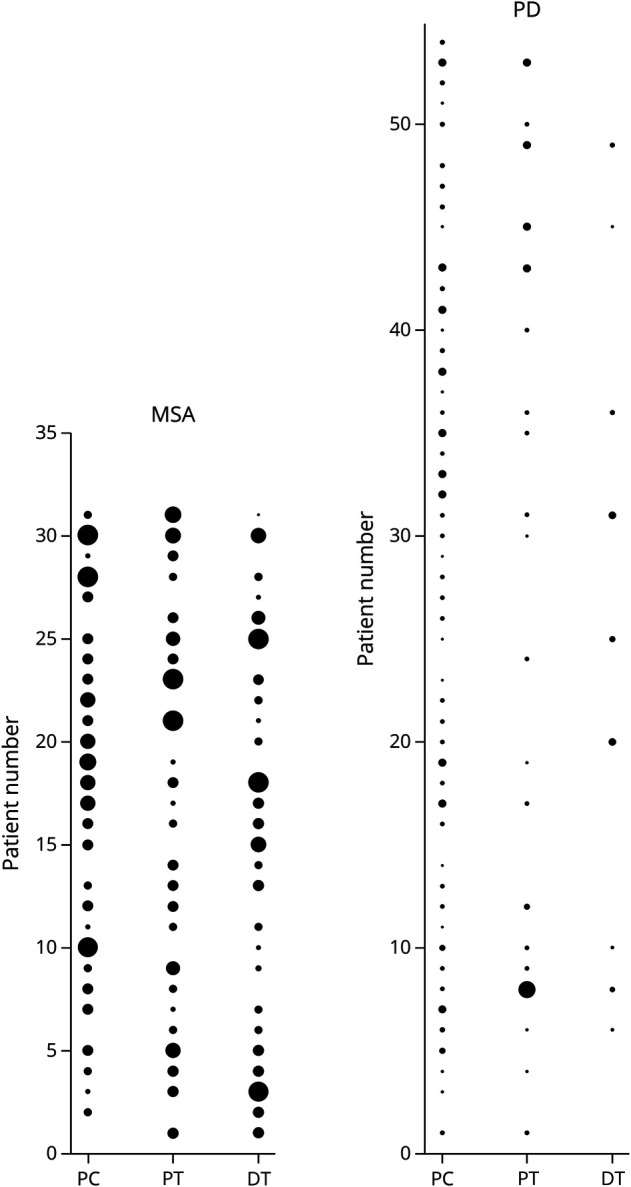
Methods: We studied 31 patients with MSA and 54 patients with PD diagnosed according to current clinical consensus criteria. We also included 24 matched controls. All participants underwent neurologic examinations, autonomic testing, and skin biopsies at 3 locations. The density of intraepidermal, sudomotor, and pilomotor nerve fibers was measured. The deposition of phosphorylated α-synuclein was quantified. Results were compared with clinical rating assessments and autonomic function test results.
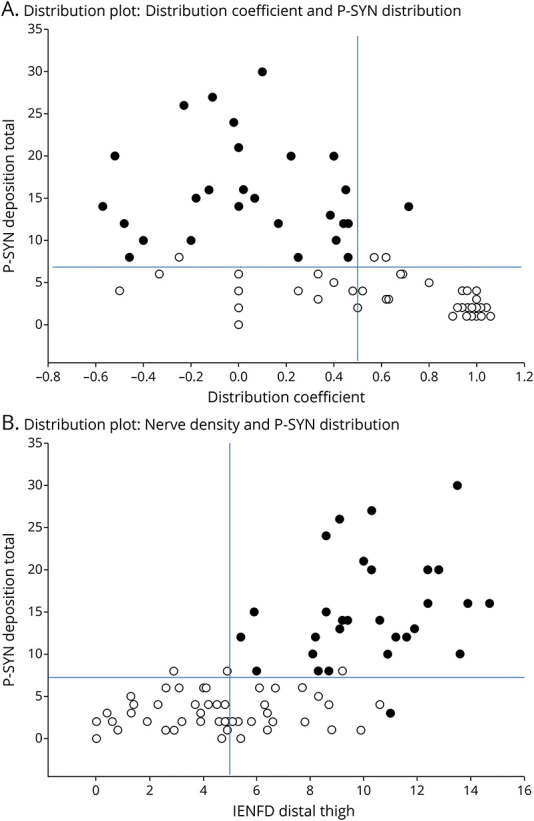
Results: Patients with PD had reduced nerve fiber densities compared with patients with MSA (p < 0.05, all fiber types). All patients with MSA and 51/54 with PD had evidence of phosphorylated α-synuclein in at least one skin biopsy. No phosphorylated α-synuclein was detected in controls. Patients with MSA had greater phosphorylated α-synuclein deposition (p < 0.0001) and more widespread peripheral distribution (p < 0.0001) than patients with PD. These results provided >90% sensitivity and specificity in distinguishing between the 2 disorders.
Discussion: α-synuclein is present in the peripheral autonomic nerves of patients with MSA and when combined with synuclein distribution accurately distinguishes MSA from PD.
Classification of evidence: This study provides Class II evidence that measurement of phosphorylated α-synuclein in skin biopsies can differentiate patients with MSA from those with PD.
© 2023 American Academy of Neurology.
Conflict of interest statement
C.H. Gibbons serves as a scientific advisor and has stock options in CND Life Sciences. R. Freeman serves as a scientific advisor and has stock options in CND Life Sciences. R. Freeman previously served on the board of directors for CND Life Sciences. The other authors report no relevant disclosures. Go to
Figures
Comment in
-
On the Track of α-Synuclein in the Body: Skin Biopsies for Diagnosing Synucleinopathies?Neurology. 2023 Apr 11;100(15):691-692. doi: 10.1212/WNL.0000000000206881. Epub 2023 Jan 19. Neurology. 2023. PMID: 36657990 No abstract available.
-
Skin α-synuclein differentiates synucleinopathies.Nat Rev Neurol. 2023 Mar;19(3):129. doi: 10.1038/s41582-023-00785-3. Nat Rev Neurol. 2023. PMID: 36750670 No abstract available.
-
Recent updates in autonomic research: orthostatic hypotension and cognitive function in Parkinson disease and multiple system atrophy, the skin as a window into synuclein pathology, and RFC1 repeat expansions in hereditary sensory autonomic neuropathies.Clin Auton Res. 2023 Aug;33(4):387-389. doi: 10.1007/s10286-023-00968-4. Epub 2023 Jul 26. Clin Auton Res. 2023. PMID: 37493897 No abstract available.
References
Publication types
MeSH terms
Substances
Grants and funding
LinkOut - more resources
Full Text Sources
Medical