

The diagnostic value of ictal SPECT-A retrospective, semiquantitative monocenter study
- PMID: 36658093
- PMCID: PMC9977750
- DOI: 10.1002/epi4.12694
The diagnostic value of ictal SPECT-A retrospective, semiquantitative monocenter study
Abstract
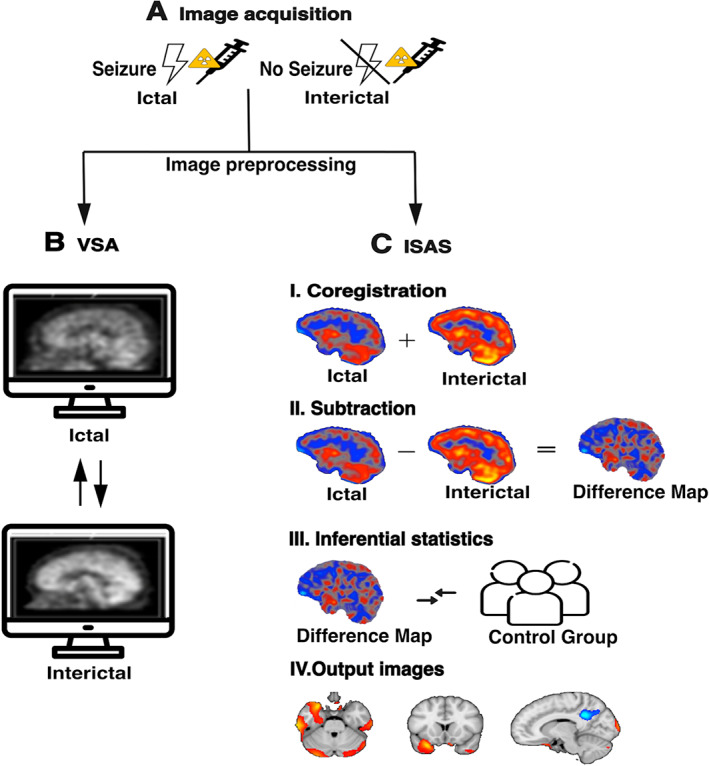
Objective: Ictal single photon emission computed tomography (SPECT) can be used as an advanced diagnostic modality to detect the seizure onset zone in the presurgical evaluation of people with epilepsy. In addition to visual assessment (VSA) of ictal and interictal SPECT images, postprocessing methods such as ictal-interictal SPECT analysis using SPM (ISAS) can visualize regional ictal blood flow differences. We aimed to evaluate and differentiate the diagnostic value of VSA and ISAS in the Bonn cohort.
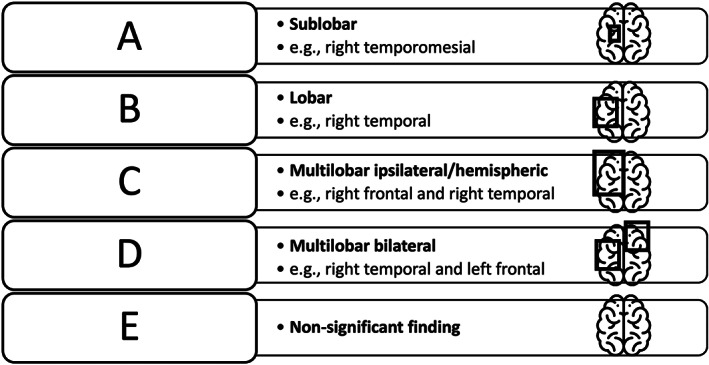
Methods: We included 161 people with epilepsy who underwent presurgical evaluation at the University Hospital Bonn between 2008 and 2020 and received ictal and interictal SPECT and ISAS. We retrospectively assigned SPECT findings to one of five categories according to their degree of concordance with the clinical focus hypothesis.
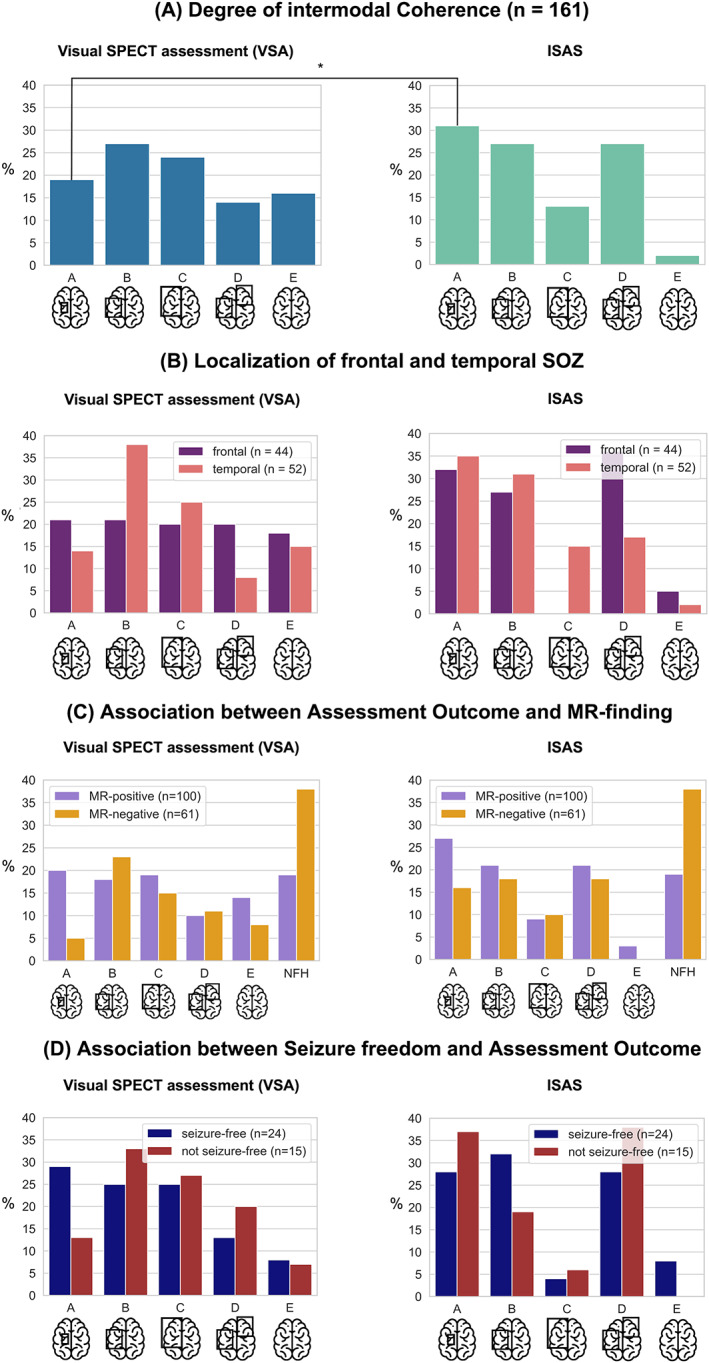
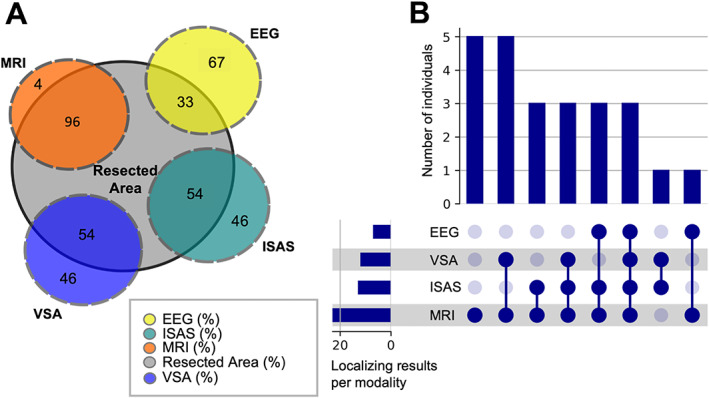
Results: Seizure onset zones could be identified more likely on a sublobar concordance level by ISAS than by VSA (31% vs. 19% of cases; OR = 1.88; 95% Cl [1.04, 3.42]; P = 0.03). Both VSA and ISAS more often localized a temporal seizure onset zone than an extratemporal one. Neither VSA nor ISAS findings were predicted by the latency between seizure onset and tracer injection (P = 0.75). In people who underwent successful epilepsy surgery, VSA and ISAS indicated the correct resection site in 54% of individuals, while MRI and EEG showed the correct resection localization in 96% and 33% of individuals, respectively. It was more likely to become seizure-free after epilepsy surgery if ISAS or VSA had been successful. There was no MR-negative case with successful surgery, indicating that ictal SPECT is more useful for confirmation than for localization.
Significance: The results of the most extensive clinical study of ictal SPECT to date allow an assessment of the diagnostic value of this elaborate examination and emphasize the importance of postprocessing routines.
Keywords: epilepsy; neuroimaging; perfusion; presurgical evaluation; seizure onset zone.
© 2023 The Authors. Epilepsia Open published by Wiley Periodicals LLC on behalf of International League Against Epilepsy.
Conflict of interest statement
FS, FB, FCG, and TBauer have no conflict of interest to disclose. RvW has received travel support, fees as speaker or for serving on the advisory board from Angelini, Apocare, Arvelle, Cerbomed, Desitin, Eisai, GW pharmaceuticals‐JAZZ pharma and UCB Pharma. These activities were not related to the content of this manuscript. TBaumgartner and AR have no conflict of interest to disclose. VB has received fees for serving as clinical consultant from Brainlab AG. These activities were not related to the content of this manuscript. TvO and HV have no conflict of interest to disclose. RS has received fees as speaker or for serving on the advisory board from Angelini, Arvelle, Bial, Desitin, Eisai, Janssen‐Cilag GmbH, LivaNova, Novartis, Precisis GmbH, UCB Pharma, UnEEG and Zogenix. These activities were not related to the content of this manuscript. TR declares that the research was conducted in the absence of any commercial or financial relationships that could be constructed as a potential conflict of interest. The results were presented in a poster at the DGFE 2022 in Leipzig and at the OHBM 2022 in Glasgow.
Figures
Similar articles
-
Localizing value of ictal-interictal SPECT analyzed by SPM (ISAS).Epilepsia. 2005 Sep;46(9):1450-64. doi: 10.1111/j.1528-1167.2005.06705.x. Epilepsia. 2005. PMID: 16146441
-
Utility of gray-matter segmentation of ictal-Interictal perfusion SPECT and interictal 18F-FDG-PET in medically refractory epilepsy.Epilepsy Res. 2017 Feb;130:93-100. doi: 10.1016/j.eplepsyres.2017.01.009. Epub 2017 Jan 30. Epilepsy Res. 2017. PMID: 28171851
-
SPECT postprocessing for epileptogenic focus localization: SISCOM versus ISAS.Epilepsia Open. 2024 Aug;9(4):1300-1310. doi: 10.1002/epi4.12953. Epub 2024 May 3. Epilepsia Open. 2024. PMID: 38700952 Free PMC article.
-
Neuronuclear assessment of patients with epilepsy.Semin Nucl Med. 2008 Jul;38(4):227-39. doi: 10.1053/j.semnuclmed.2008.02.004. Semin Nucl Med. 2008. PMID: 18514079 Review.
-
Ictal SPECT.Epilepsia. 2004;45 Suppl 4:35-40. doi: 10.1111/j.0013-9580.2004.04008.x. Epilepsia. 2004. PMID: 15281956 Review.
Cited by
-
Portable ultra-low-field magnetic resonance imaging enables postictal seizure imaging.Epilepsia. 2025 Apr;66(4):e60-e65. doi: 10.1111/epi.18273. Epub 2025 Feb 17. Epilepsia. 2025. PMID: 39962944 Free PMC article.
References
-
- Rosenow F, Bast T, Czech T, Hans V, Helmstaedter C, Huppertz HJ, et al. Qualitätsleitlinien für prächirurgische Epilepsiediagnostik und operative Epilepsietherapie. Nervenarzt. 2014;85(6):753–6. - PubMed
-
- Schwarz G, Puttinger G, von Oertzen TJ. Prächirurgische Epilepsiediagnostik – öfter ein Thema als viele denken. Psychopraxis Neuropraxis. 2019;22(6):260–7.
