. 2023 Jan 19;9(1):13.
doi: 10.1038/s41420-023-01313-4.

Hepatocyte growth factor-mediated apoptosis mechanisms of cytotoxic CD8+ T cells in normal and cirrhotic livers

Affiliations

Hepatocyte growth factor-mediated apoptosis mechanisms of cytotoxic CD8+ T cells in normal and cirrhotic livers

Quanyu Chen et al. Cell Death Discov. .

Abstract

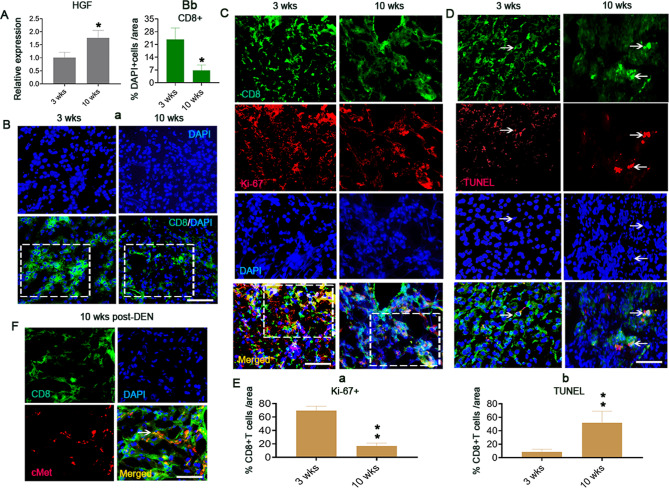
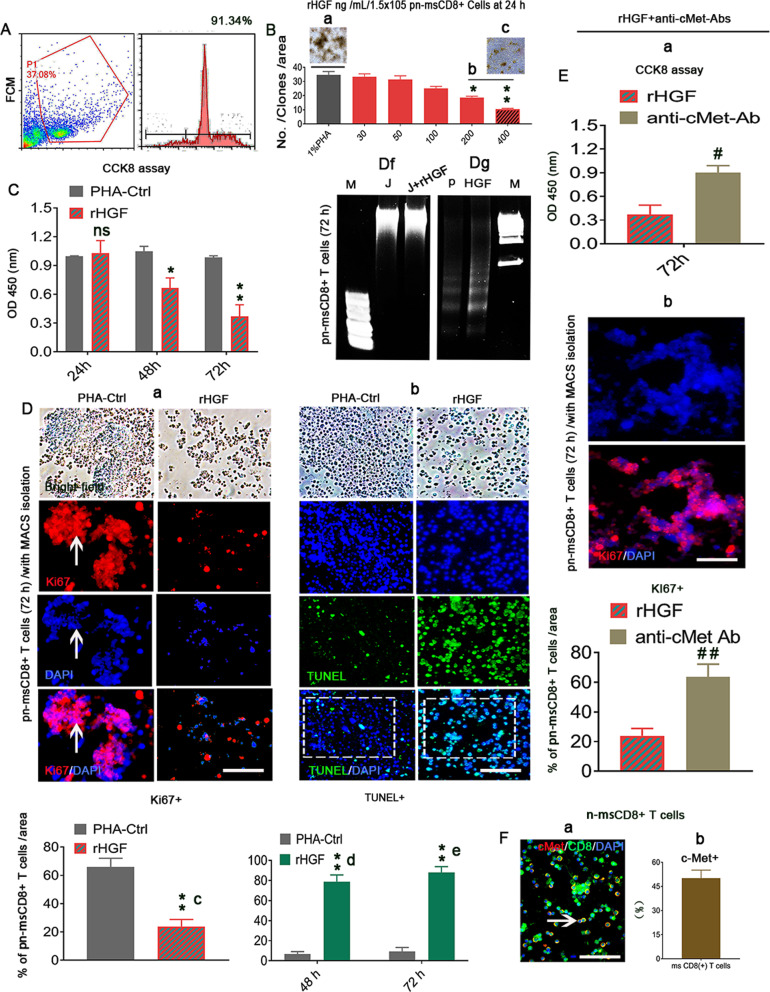
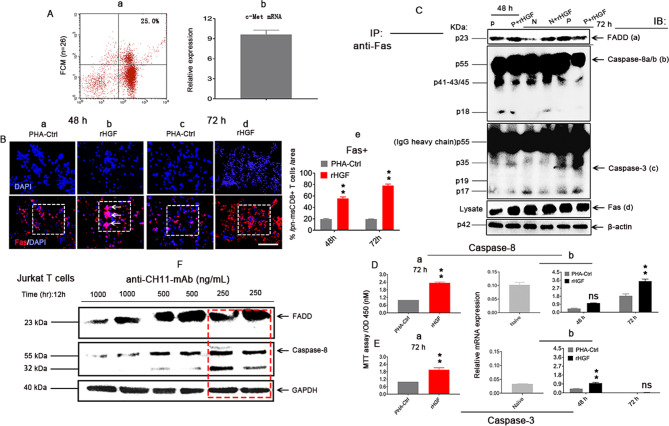
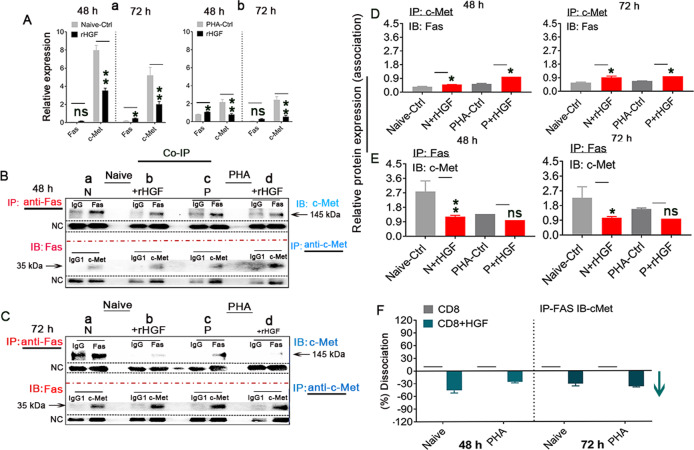
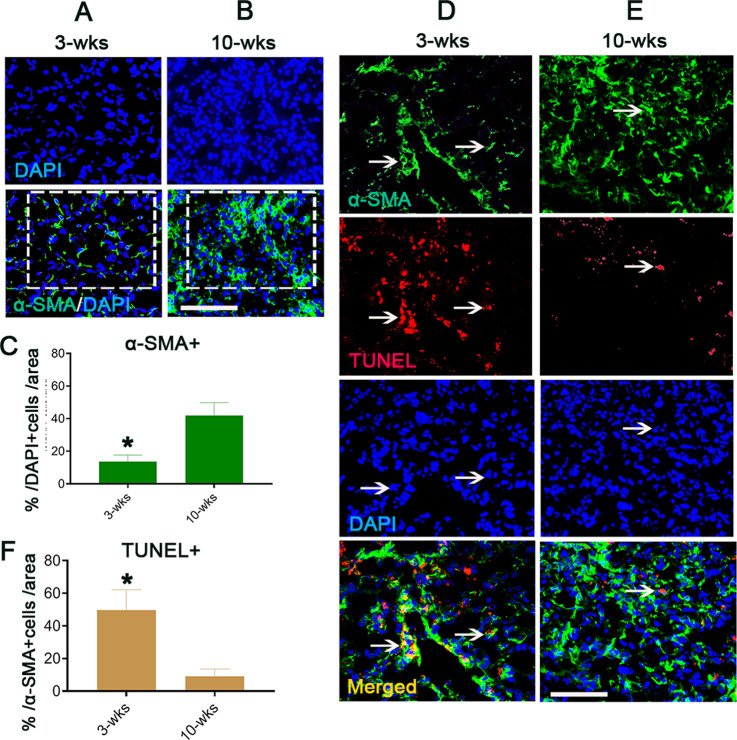
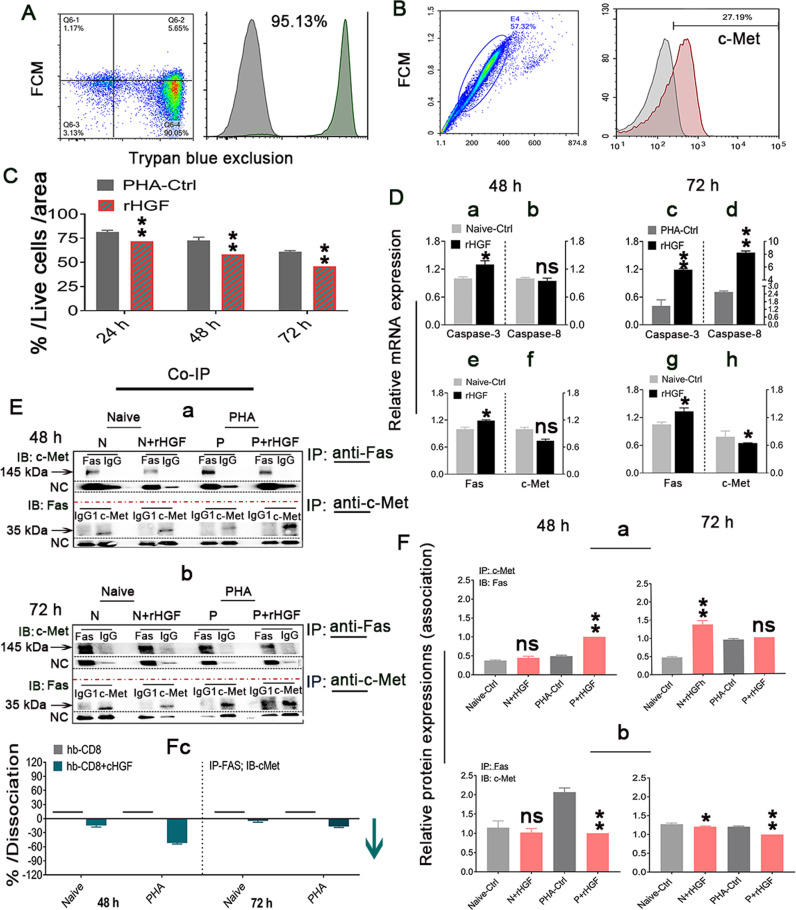
Intrahepatic stem/progenitor cells and cytotoxic CD8+ T cells (CD8+ T cells) in the cirrhotic liver undergo apoptosis, which potentially facilitates progression to cancer. Here, we report that hepatocyte growth factor (HGF) signaling plays an important role in promoting normal and damaged liver CD8+ T cell Fas-mediated apoptosis through its only receptor, c-Met. In addition to binding with HGF, c-Met also binds to Fas to form a complex. Using a diethylnitrosamine (DEN)-induced liver fibrosis/cirrhosis mouse model, immunostaining, and terminal deoxynucleotidyl transferase (TdT) dUTP nick-end labeling (TUNEL) staining, we found that HGF secretion was significantly higher at 10 weeks post-DEN, the liver cirrhotic phase (LCP), than at 3 weeks post-DEN, the liver fibrotic phase (LFP). Correspondingly, differences in CD8+ T cell proliferation and apoptosis were noted between the two phases. Interestingly, staining and TUNEL assays revealed lower smooth muscle actin (α-SMA)+ cell apoptosis, a marker for hepatic stellate cells (HSCs), in the LFP group than in the LCP group, which suggested a beneficial correlation among HGF, CD8+ T cells and HSCs in improving the fibrotic load during damaged liver repair. In cultures, when met different concentrations of recombinant HGF (rHGF), phytohemagglutinin (PHA)-stimulated naive mouse splenic CD8+ T cells (pn-msCD8+ T cells) responded differently; as increases in rHGF increased were associated with decreases in the clonal numbers of pn-msCD8+ T cells, and when the rHGF dose was greater than 200 ng/mL, the clonal numbers significantly decreased. In the presence of 400 ng/mL rHGF, the death-inducing signaling complex (DISC) can be directly activated in both nsCD8+ T cells and healthy human peripheral blood CD8+ T cells (hp-CD8+ T cells), as indicated by recruitment of FADD and caspase-8 because DISC forms via the recruitment of FADD and caspase-8, among others. These findings suggest that Fas-mediated apoptosis, may also indicate a regulatory role of HGF signaling in hepatic homeostasis.


Conflict of interest statement

The authors declare no competing interests.

Figures

Fig. 1
Fig. 1. Higher HGF secretion induces CD8+ T cell apoptosis in the liver cirrhotic period (LCP) of DEN-induced liver fibrosis/cirrhosis mouse model.
A qRT‒PCR assay of HGF expression in the liver tissues at 3 and 10 weeks post-DEN, n = 3. B(a, b) Immunofluorescence staining for the percentage of CD8+ T cells with liver tissue-resident (DAPI+) cells at 3 and 10 weeks post-DEN (a, green, boxes) and quantification (b). Scale bar = 200 µM, n = 6. C, D Double immunofluorescence staining of Ki-67 (red, C) and TUNEL (red, D) within CD8+ T cells (green) in the diseased liver tissues at 3 and 10 weeks post-DEN (brown color after merging in boxes, C, D). Scale bar = 200 µM, n = 6/staining marker. E(a, b) Quantification of the counts in C and D. F Double immunofluorescence staining of c-Met (red) and CD8 (green) in liver tissues at 10 weeks post-DEN. The arrow marks c-Met-expressing CD8+ T cells (brown). Scale bar = 200 µM, n = 6. At least three independent experiments were performed, and the data are presented as the means ± SDs; *p < 0.05 and *p < 0.001 vs. 10 weeks post-DEN (Student’s t test).
Fig. 2
Fig. 2. rHGF (400 ng/mL) inhibits msCD8+ T cell proliferation and promotes apoptosis that mediated by c-Met receptor.
A Analysis of the purity of n-msCD8+ T cells isolated using the MACS method with CD8α antibody as assessed by FCM (n = 3). B pn-msCD8+ T cells (1 × 105) were cultured and treated with different doses of rHGF for 24 h (n = 3). C CCK-8 assays were performed for the analysis of pn-msCD8+ T cell growth between the rHGF-treated and nontreated groups at 24, 48, and 72 h after rHGF administration (n = 3/time point). D(a–g) Immunofluorescence staining for Ki-67+ cells among MACS-purified pn-msCD8+ T cells within DAPI+ cells in the present and absence of rHGF treatment for 72 h (a, c, arrows denote proliferation T cell clones (red), n = 6; TUNEL (green) assay of cell apoptosis after rHGF treatment for 48 (d) and 72 h (b, green, e), scale bar = 200 µM, n = 6; 72-h rHGF (400 ng/mL)-treated pn-msCD8+ T cells (g, n = 3) and Jurkat T cells (J) (f, n = 3) were also subjected to gel electrophoresis to detect DNA fragments. E(a, b) Inhibitory effects of an anti-c-Met-Ab on pn-msCD8+ T cell proliferation as assessed by CCK-8 assay (a, n = 3) and immunostaining (b, red, boxes, n = 3) 24 h before 400 ng/mL rHGF administration, scale bar = 200 µM. F Immunofluorescence staining for c-Met (red) in pn-msCD8+ T cells (green, n = 6, an arrow denotes c-Met-expressing n-msCD8+ T cells, brown color after merging) and quantification of c-Met expression by FCM (brown bars, n = 3). Scale bar = 200 µm. At least three independent experiments were performed, and the data are presented as the means ± SDs. The asterisks indicate a statistically significant difference; *p < 0.05 and **p < 0.001 vs. PHA-Ctrls; #p < 0.05 and ##p < 0.001 vs. rHGF; ns represents no significance (Student’s t test).
Fig. 3
Fig. 3. rHGF (400 ng/mL) enhances DISC formation to promote Fas-mediated apoptosis in both naive and PHA-stimulated msCD8+ T cells.
A(a, b) c-Met expression in n-msCD8+ T cells at the protein (a, n = 3) and mRNA (b, n = 3) levels identified by FCM and qRT‒PCR assays, respectively. B(a–e) Immunofluorescence staining for Fas expression (red) in MACS-purified pn-msCD8+ T cells (denoted in blue) after 48 (a, b, boxes, arrows denote Fas aggregation) and 72 h (c, d, boxes) of 400 ng/mL rHGF treatment and quantification (e) compared with the PHA-control groups. Scale bar = 200 µM, n = 6/time point; C(a–d) IP with a Fas antibody followed by IB for FADD (a, n = 2), caspase-8 (b, n = 2), and caspase-3 (c, n = 2) of cell lysates only for Fas control protein (d, n = 2) after 48 h of 400 ng/mL treatment. D(a, b) MTT assay (a) and RT-qPCR (b) were used for the assessment of caspase-8 expression in the presence or absence of 400 ng/mL rHGF for 48 (b) and 72 h (a, b), n = 10. E(a, b) MTT assay (a) and RTq-PCR (b) were performed for the assessment of caspase-3 expression in the presence or absence of 400 ng/mL rHGF for 48 (b) and 72 h (a, b), n = 10. F Anti-CH11-mAb (250 ng/mL, red box) was selected for the treatment of Jurkat T cells (J) based on the experimental results to determine the ideal concentration, n = 2. At least three independent experiments were performed, and the data are presented as the means ± SDs; *p < 0.05 and **p < 0.001 vs. PHA-Ctrls; ns represents no significance (Student’s t test).
Fig. 4
Fig. 4. rHGF regulates the c-Met/Fas molecular mode in naive and PHA-stimulated msCD8+ T cells.
A qRT‒PCR analysis of Fas and c-Met expression in naive (a) and PHA-stimulated (b) msCD8+ T cells 48 and 72 h after 400 ng/mL rHGF administration, n = 6. B, C A Co-IP assay was performed by IP with Fas or c-Met antibody followed by IB using an affinity-purified anti-c-Met-Ab or anti-Fas-Ab to evaluate the association between c-Met and Fas on naive (a, b, n = 3) and PHA-stimulated (c, d, n = 3) msCD8+ T cells in the presence (b, d) or absence (a, c) of 400 ng/mL rHGF treatment for 48 h (B(a–d)) and 72 h (C(a-d), n = 3/naive and PHA groups). D Quantification of the association between c-Met and Fas by IP with c-Met antibody followed by IB for Fas performed at 48 and 72 h (n = 6). E IP with Fas antibody followed by IB for c-Met performed at 48 and 72 h (n = 6). F Analysis of the dissociation rate of c-Met from Fas after 48 and 72 h of treatment with 400 ng/mL rHGF (the values of the samples marked with short lines were precisely 0). The data are presented as the means ± SDs of at least three independent experiments; original magnification = ×400; scale bar = 200 µm. The asterisks indicate a statistically significant difference; *p < 0.05 and **p < 0.001 vs. Naive-Ctrl and PHA-Ctrls; ns represents no significance (Student’s t test).
Fig. 5
Fig. 5. Liver resident CD8+ T cell apoptosis in the LCP period seems to promote fibrosis via protecting HSCs from apoptosis.
AC Immunofluorescence staining for fibrotic/cirrhotic liver tissue-resident α-SMA+ HSCs (green) at 3 (A, a box) and 10 weeks (B, a box) post-DEN and quantification (C). Scale bar = 200 µM, n = 6. DF TUNEL staining (red) to target α-SMA+ HSCs labeled by red fluorescence (red) at 3 (D, arrows) and 10 (E, arrows) weeks post-DEN and quantification of the numbers of double-stained TUNEL and α-SMA+ cells (F). Scale bar = 200 µM, n = 6/each staining. At least three independent experiments were performed, and the data are presented as the means ± SDs; *p < 0.05 vs. 10 weeks post DEN (Student’s t test).
Fig. 6
Fig. 6. c-Met-Fas dissociation in healthy human peripheral blood CD8+ T cells (hp-CD8+ T cells) can also be induced by treatment with 400 ng/mL rHGF.
A FCM analysis of the hpCD8+ CT cell purity after isolation with MACS beads (n = 3). B FCM analysis of c-Met expression in hp-CD8+ T cells (n = 3). C Assessment of live hp-CD8+ CT cells in cultures using the trypan blue exclusion assay. Cells were treated with 400 ng/mL rHGF for 24, 48, and 72 h (n = 3/time point). D(a–h) qRT‒PCR assay for assessment of the caspase-8 and caspase-3 levels in naive cells at 48 h (a, b) and PHA-stimulated hp-CD8+ T cells at 72 h (c, d), n = 6/time point; and the c-Met and Fas levels in naive hp-CD8+ T cells after 48 (e, f) and 72 h (g, h) of 400 ng/mL rHGF treatment, n = 6/time point. E(a, b) Co-IP assays using either IP Fas or c-Met antibody followed by IB with c-Met or Fas antibody were performed to assess the association between c-Met and Fas in naive (N) and PHA-stimulated (P) hp-CD8+ T cells in the presence or absence of 400 ng/mL rHGF for 48 (a, n = 3) and 72 h (b, n = 3). F(a–c) IP with c-Met antibody followed by IB for Fas was performed to confirm the association between c-Met and Fas in hpCD8+ T cells after treatment with 400 ng/mL rHGF for 48 and 72 h (a, n = 6); the same IP assay with Fas followed by IB with c-Met was performed with cells cocultured with 400 ng/mL rHGF for 48 and 72 h (b, n = 6), and the dissociation rate (a blue arrow) of c-Met from Fas was analyzed after 48–72 h of treatment with 400 ng/mL rHGF (the values of the samples marked with short horizontal lines were precisely 0) (c). The data are presented as the means ± SDs of at least three independent experiments. *p < 0.05 and **p < 0.001 indicate a statistically significant difference vs. either naive-Ctrl or PHA-Ctrl; ns represents no significance (Student’s t test).

Similar articles

Cited by

References

    1. Canbay A, Friedman S, Gores GJ. Apoptosis: the nexus of liver injury and fibrosis. Hepatology. 2004;39:273–78. doi: 10.1002/hep.20051. - DOI - PubMed
    1. Feldstein AE, Canbay A, Angulo P, Taniai M, Burgart LJ, Lindor KD, et al. Hepatocyte apoptosis and Fas expression are prominent features of human nonalcoholic steatohepatitis. Gastroenterology. 2003;125:437–43. doi: 10.1016/S0016-5085(03)00907-7. - DOI - PubMed
    1. Rodina AS, Shubina ME, Kurbatova IV, Topchieva LV, Dudanova OP. Hepatocytic apoptosis and immune dysfunction in decompensation of alcoholic liver cirrhosis with different grades of acute-on-chronic liver failure. Bull Exp Biol Med. 2022;172:410–14. doi: 10.1007/s10517-022-05404-7. - DOI - PubMed
    1. Horn CL, Morales AL, Savard C, Farrell GC, Ioannou GN. Role of cholesterol-associated steatohepatitis in the development of NASH. Hepatol Commun. 2022;6:12–35. doi: 10.1002/hep4.1801. - DOI - PMC - PubMed
    1. Chen Q, You X, Yang W, Jiang S, Lai J, Zhang H, et al. Survival of endogenous hepatic stem/progenitor cells in liver tissues during liver cirrhosis. Life Sci. 2020;241:117121. doi: 10.1016/j.lfs.2019.117121. - DOI - PubMed