. 2023 Jan 19;14(1):41.
doi: 10.1038/s41419-023-05554-0.

Plexin-A2 enables the proliferation and the development of tumors from glioblastoma derived cells

Affiliations

Plexin-A2 enables the proliferation and the development of tumors from glioblastoma derived cells

Shira Toledano et al. Cell Death Dis. .

Abstract

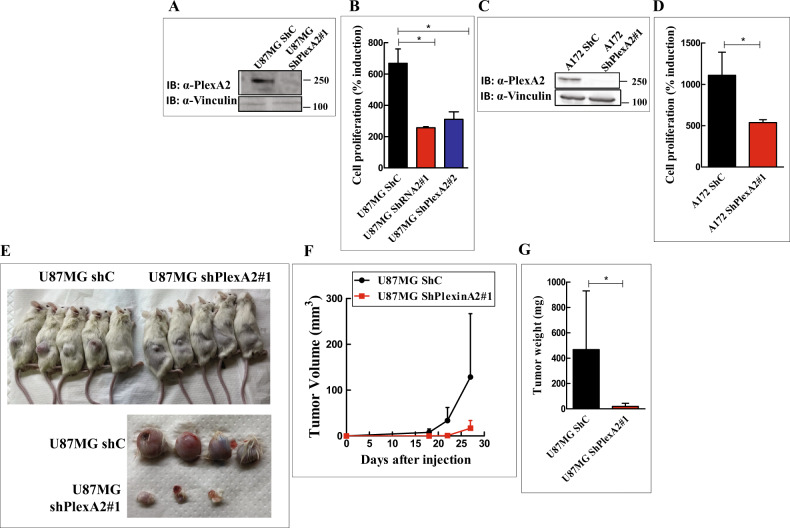
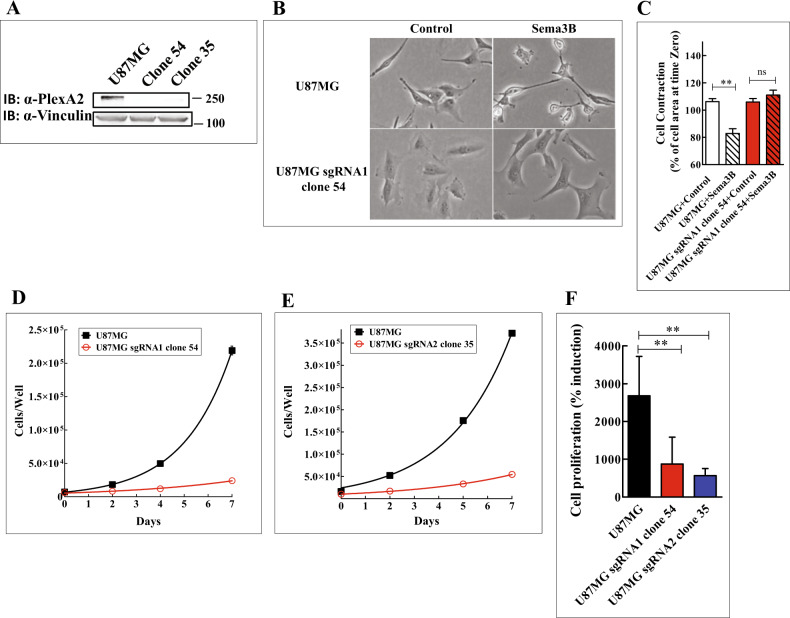
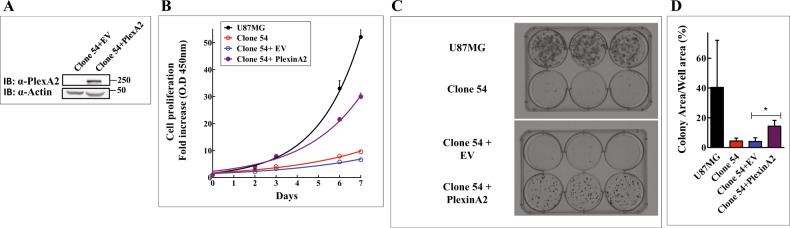
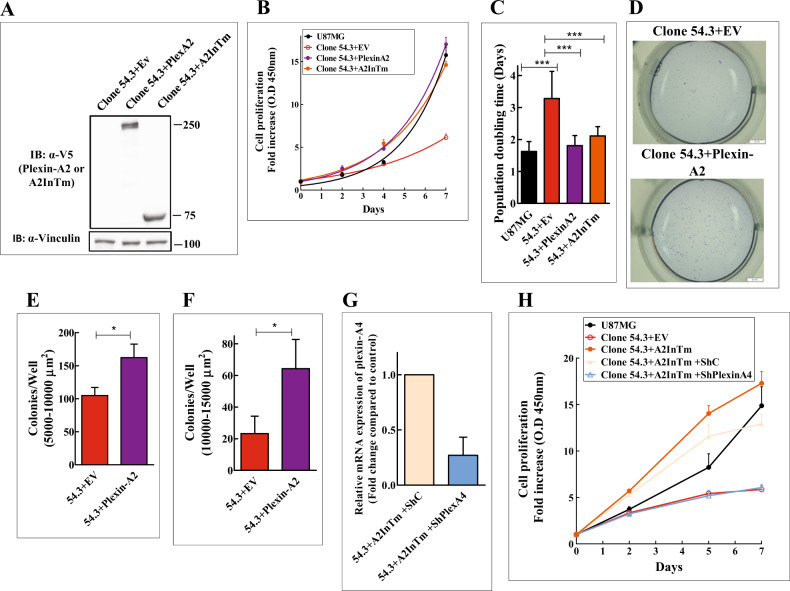
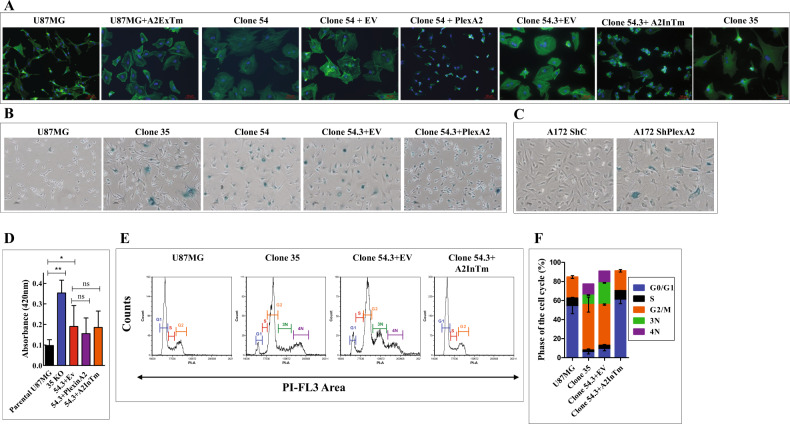
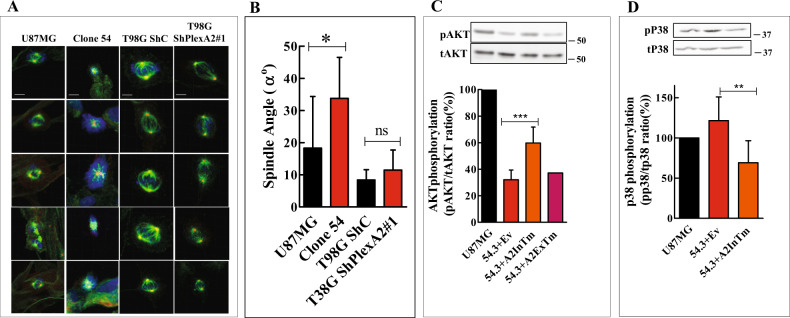
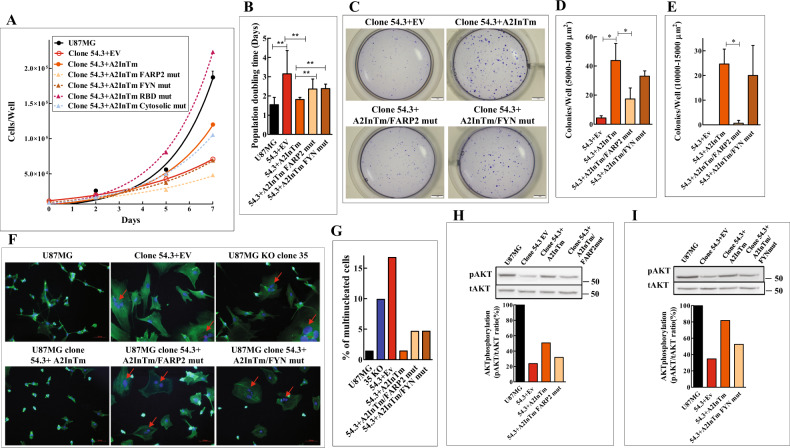
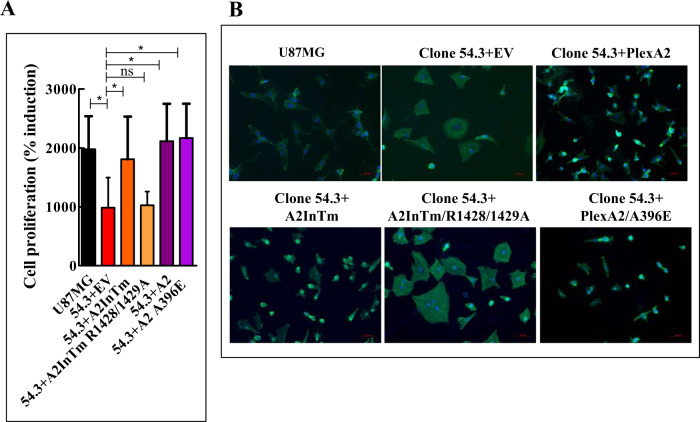
The semaphorin guidance factors receptor plexin-A2 transduces sema6A and sema6B signals and may mediate, along with plexin-A4, the anti-angiogenic effects of sema6A. When associated with neuropilins plexin-A2 also transduces the anti-angiogenic signals of sema3B. Here we show that inhibition of plexin-A2 expression in glioblastoma derived cells that express wild type p53 such as U87MG and A172 cells, or in primary human endothelial cells, strongly inhibits cell proliferation. Inhibition of plexin-A2 expression in U87MG cells also results in strong inhibition of their tumor forming ability. Knock-out of the plexin-A2 gene in U87MG cells using CRISPR/Cas9 inhibits cell proliferation which is rescued following plexin-A2 re-expression, or expression of a truncated plexin-A2 lacking its extracellular domain. Inhibition of plexin-A2 expression results in cell cycle arrest at the G2/M stage, and is accompanied by changes in cytoskeletal organization, cell flattening, and enhanced expression of senescence associated β-galactosidase. It is also associated with reduced AKT phosphorylation and enhanced phosphorylation of p38MAPK. We find that the pro-proliferative effects of plexin-A2 are mediated by FARP2 and FYN and by the GTPase activating (GAP) domain located in the intracellular domain of plexin-A2. Point mutations in these locations inhibit the rescue of cell proliferation upon re-expression of the mutated intracellular domain in the knock-out cells. In contrast re-expression of a plexin-A2 cDNA containing a point mutation in the semaphorin binding domain failed to inhibit the rescue. Our results suggest that plexin-A2 may represent a novel target for the development of anti-tumorigenic therapeutics.


Conflict of interest statement

The authors declare no competing interests.

Figures

Fig. 1
Fig. 1. Silencing plexin-A2 expression in U87MG and A172 cells inhibits their proliferation and the development of subcutaneous tumors.
A Western blot showing plexin-A2 expression levels in U87MG cells expressing a non-specific shRNA (ShC) or a shRNA targeting plexin-A2 (ShPlexA2#1). Cell lysates were probed with antibodies directed against plexin-A2 or vinculin. B U87MG or U87MG cells silenced for plexin-A2 expression using two different shRNAs were seeded in triplicate (2 × 104 cells/well) in 24 well dishes. Cells were counted in a coulter counter after 3 days. Shown is the percentage of attached cells on day 3 compared with the number of cells attached on day 0 which was taken as 100%. Data are represented as mean ± SD. Statistical analysis was done using the one tailed Mann-Whitney test. *P < 0.05, N = 3. C Western blot showing plexin-A2 expression levels in A172 cells expressing a non-specific shRNA (ShC) or a shRNA targeting plexin-A2 (ShPlexA2#1). Cell lysates were probed with antibodies directed against plexin-A2 or vinculin. D A172 cells were infected with lentiviruses encoding a control shRNA (ShC) or a shRNA targeting plexinA2 (ShPlexA2#1). Each group of cells was seeded in quadruplicate in 96 well dishes (3 × 103 cells/well). Cell proliferation was measured using the WST-1 proliferation assay as described in materials and methods, and the values presented were calculated as described under (B). Data are represented as mean ± SD. Statistical analysis was done using the one tailed Mann-Whitney test. *P < 0.05, N = 3. E U87MG expressing a nonspecific shRNA (ShC) or U87MG cells silenced for plexin-A2 expression using ShPlexA2#1 were injected subcutaneously into NOD/SCID mice (3 × 106 cells/mouse). After 30 days the experiment was terminated, tumors were excised, weighed and photographed. Each group contained 5 mice. Shown are pictures of the mice (upper panel) and of the excised tumors (lower panel). F U87MG expressing non-specific shRNA (ShC) or U87MG cells silenced for plexin-A2 expression using ShPlexA2#1 were injected subcutaneously into Athymic/Nude mice (2 × 106 cells/mouse). Each group contained 7 mice. Tumor development was measured twice a week using calipers. Data are represented as mean ± SD. G Shown is the mean weight of 19 tumors excised from three independent experiments done as in (F). Data are represented as mean ± SD. Statistical analysis was done using the one tailed Mann-Whitney test. *P < 0.05.
Fig. 2
Fig. 2. CRISPR/Cas9 mediated knock-out of plexin-A2 expression in U87MG cells inhibits their proliferation.
A Two different guide RNAs were used to knock-out plexin-A2 expression in U87MG cells. Cell lysates of U87MG cells and knock-out cells (U87MG sgRNA1 clone 54 and U87MG sgRNA2 clone 35) were probed with antibodies directed against plexin-A2 or vinculin. B Conditioned medium from HEK293 cells infected with an empty lentiviral expression vector (Control) or from HEK293 cells expressing recombinant sema3B (300 μl) were added to parental U87MG cells or to U87MG sgRNA1 clone 54. Following a 30 min. incubation at 37 oC the cells were photographed. C U87MG cells and clone 54 plexin-A2 knock-out cells were photographed at the beginning of the experiment and again 30 min after stimulation with sema3B as described under (B) using the Incucyte Zoom HD/2CLR System. Changes in the area of the indicated cell types were determined in fields derived from three replicate wells using the Image-Pro Premier software. Data are represented as mean ± SD. Statistical analysis was done using the one-tailed Mann-Whitney test. *P < 0.05, ns: non-specific, N = 4. D, E Representative growth curves of U87MG cells and plexin-A2 knock-out clone 54 cells (D) and clone 35 cells (E). Cells were seeded in quadruplicate (1 × 104 cells/well). Adherent cells were counted every two days using a coulter-counter. Data are represented as mean ± SD. F The number of cells attached on day 0 was taken to be 100%. The average percentage of adherent cells on day 7 is shown. Compared were parental U87MG cells (N = 13), plexin-A2 clone 54 knock-out cells (N = 8) and plexin-A2 clone 35 knock-out cells (N = 5). Data are represented as mean ± SD. Statistical analysis was done using the one-tailed Mann-Whitney test. **P < 0.01.
Fig. 3
Fig. 3. Re-expression of plexin-A2 cDNA in plexin-A2 knock-out cells, restores their proliferation and colony forming ability.
A U87MG KO clone 54 cells were infected with an empty lentiviral expression vector (EV) or with a lentiviral vector directing expression of plexin-A2 (PlexA2). Western blots prepared from cell lysates were probed with antibodies directed against plexin-A2 and actin. B U87MG cells, U87MG clone 54 cell and clone 54 cells infected with empty lentiviruses (EV) or lentiviruses directing expression of plexin-A2 (PlexinA2) were seeded in quadruplicate in 96 well dishes. Cell proliferation was determined using the WST-1 assay as described. Shown is a representative experiment out of N = 4 independent experiments. Data are represented as mean ± SD. C U87MG cells, U87MG clone 54 cells and U87MG KO clone 54 cells infected with an empty lentiviral expression vector (EV) or with a lentiviral vector directing expression of plexin-A2 (PlexinA2). Cells were seeded in 6 well plates (300 cells/well). After 16 days colonies were fixed in 4% para-formaldehyde and stained with crystal violet. The experiment was repeated three times with similar results. D The areas of the colonies formed by the indicated cell types out of the entire well area was determined and is represented as a percentage of the total area. Data are represented as mean ± SD. Statistical analysis was done using the one tailed Mann-Whitney test. *P < 0.05, N = 3.
Fig. 4
Fig. 4. Re-expression of a truncated plexin-A2 containing the intracellular and trans-membrane domains (A2InTm) of plexin-A2 restores cell proliferation of plexin-A2 knock-out cells.
A Plexin-A2 knock-out clone 54.3 cells were infected with an empty lentiviral expression vector (EV) or a lentiviral vector directing expression of a V5 tagged full length plexin-A2 (PlexA2) or a truncated plexin-A2 containing the intracellular and trans-membrane domains of plexin-A2 (A2InTm). Western blots prepared from cell lysates were probed with antibodies directed against V5 and vinculin. B Representative growth curves of U87MG cells and of U87MG KO clone 54.3 cells infected with lentiviruses encoding plexin-A2 (PlexinA2), A2InTm or an empty expression vector (EV). Cells were seeded in quadruplicate in 24 well dishes (1 × 104 cells/well). Cells were counted every two days using a coulter-counter. Data are represented as mean ± SD. C The average population doubling time of U87MG cells (N = 11) was compared with the average population doubling time of clone 54.3 + EV (N = 11), clone 54.3 + PlexinA2 (N = 7) and clone 54.3 + A2InTm (N = 8). Data are represented as mean ± SD. Statistical analysis was done using the one tailed Mann-Whitney test. ***P < 0.001 D Clone 54.3 cells infected with an empty lentiviral expression vector (EV) or with a lentiviral vector directing expression of plexin-A2 were seeded in soft agar in 24 well dishes (1 × 103 cells/well) in triplicates. Colonies were stained with crystal violet after 13 days. Shown are photographs of representative wells. E, F The average number of colonies per well with an area between 5000 and 10,000 µm2 or 10,000 and 15,000 µm2 were determined. Data are represented as mean ± SD. Statistical analysis was done using the one-tailed Mann-Whitney test. *P < 0.05, N = 3. G Lentiviruses were used to express control (ShC) or a plexin-A4 targeting shRNA (ShPlexA4) in KO clone 54.3 cells expressing A2InTm. The expression of plexin-A4 was then examined using qRT-PCR. Data are represented as mean ± SD, N = 2. H Representative growth curve of U87MG cells and of clone 54.3 cells expressing an empty expression vector (EV) or expressing A2InTm and clone 54.3 cells expressing A2InTm as well as a non-specific shRNA (ShC) or Clone 54.3 cells expressing A2InTm and an shRNA targeting plexin-A4 (ShPlexinA4). The various cells were seeded in quadruplicate in 96 well dishes (3 × 103 cells/well). The proliferation of the cells was determined every two days using the WST-1 assay as previously described. Data are represented as mean ± SD. The experiment was repeated three times with similar results.
Fig. 5
Fig. 5. U87MG cells in which the plexin-A2 gene was knocked out acquire some properties of senescent cells.
A The indicated cell types were seeded on fibronectin-coated coverslips and stained with DAPI to visualize cell nuclei (blue) and with fluorescent phalloidin (green) to visualize actin fibers. Shown are merged confocal photographs generated using ZEN 2.3 software. B-C The indicated cell types were assayed at pH-6 for the expression of the senescence marker SA-β galactosidase as described in materials and methods. Shown are representative photographs. D Equal numbers of U87MG cells (N = 9 independent experiments), plexin-A2 knock out U87MG cells (clone 54.3 (N = 7), clone 35 (N = 3)) or clone 54.3 cells in which full-length plexin-A2 (PlexinA2) (N = 5) or A2InTm (N = 5) were re-expressed, were collected and lysed in 100 µL of 0.1 M phosphate buffer (pH 6.0). β-galactosidase activity was then determined at pH 6.0 as described. Data are represented as mean ± SD. Statistical analysis was done using the one-tailed Mann-Whitney test. *P < 0.05, **P < 0.01, ns: non-specific. E Cytofluorimetric analysis of propidium iodide-stained triplicates of U87MG cells, U87MG clone 35 cells and clone 54.3 cells infected with empty lentiviruses (EV) or A2InTm. The peaks represent cells in G0/G1 (G1), Cells in S (S), cells in G2/M (G2), and aneuploid cells (3 N,4 N). F The percentage of cells in the different cell cycle phases is shown for each of the cell types shown in (E). Data are represented as mean ± SD. N = 3.
Fig. 6
Fig. 6. U87MG cells in which the plexin-A2 gene is knocked-out have abnormal mitotic spindles and display changes in the phosphorylation of AKT and P38.
A The indicated cell types were seeded on fibronectin-coated coverslips and stained with DAPI to visualize cell nuclei (blue) and with antibodies to alpha-tubulin (green) and gamma-tubulin (red). Shown are 3D confocal photographs generated using the Imaris software. Scale bars: 10 μm. B The X–Z axis stack projections of the photographs generated from laser-scanning confocal images taken in 0.3 μm steps were quantified using ZEN 2.3 software. The mitotic spindle angles of the indicated cell types were calculated. Data are represented as mean ± SD. Statistical analysis was done using the one-tailed Mann-Whitney test. *P < 0.05, N = 10 (U87MG), N = 8 (clone 54), N = 11 (T98G ShC), N = 6 (T98G ShA2). C The cDNAs encoding A2InTm, A2ExTM or an empty expression vector (EV) were expressed in clone 54.3 knock-out cells (54.3). The phosphorylation levels of AKT were assayed in the indicated cell types by western blot analysis of cell lysates as described in methods, using an antibody directed against phosphorylated AKT (ser473). Loading was assessed using an antibody directed against total AKT. Shown is a representative western blot. The effect of A2InTm expression on the average phosphorylation levels of AKT was determined (N = 8) (except for A2ExTm expressing cells, N = 1). Below is shown a histogram depicting the ratio between the intensity of phospho-AKT staining and total AKT. Data are represented as mean ± SD. Statistical analysis was done using the one-tailed Mann-Whitney test. ***P < 0.001, D The phosphorylation levels of p38 were assayed in the indicated cell types by western blot analysis of cell lysates as described in methods, using an antibody directed against phosphorylated p38 (Thr180/Tyr182). Loading was assessed using an antibody directed against total p38. Shown is a representative western blot. Below is shown a histogram depicting the average ratio between the intensity of the respective phospho-p38 bands and the total p38 bands. Data are represented as mean ± SD. Statistical analysis was done using the one-tailed Mann-Whitney test. **P < 0.01, N = 6.
Fig. 7
Fig. 7. Point mutations in the FARP2 binding site and in the Fyn phosphorylation sites of the plexin-A2 intracellular domain inhibit restoration of cell proliferation induced by A2InTm and inhibit the A2InTm mediated rescue of AKT phosphorylation.
A U87MG cells, U87MG clone 54.3 cells infected with either control lentiviruses (EV) or with lentiviruses encoding A2InTm or A2InTm variants containing point mutations in the FARP2 binding site (54.3 + A2InTm FARP2 mut), in the Fyn phosphorylation sites (54.3 + A2InTm FYN mut), in the Rho binding domain (RBD) (54.3 + A2InTm RBD mut) or in the juxtamembrane cytosolic dimerization interface (54.3 + A2InTm Cytosolic mut) of plexin-A2 were seeded in 24 well dishes (1 × 104 cells/well). Triplicate wells were counted every two days using a coulter-counter. Data are represented as mean ± SD. Shown is a representative experiment out of five similar experiments. B Shown are the average population doubling times of the clone 54.3 derived indicated cell types. Results were derived from N = 5 independent experiments. Data are represented as mean ± SD. Statistical analysis was done using the one-tailed Mann-Whitney test. *P < 0.05. C Single-cell suspensions of clone 54.3+EV, clone 54.3 + A2InTm, clone 54.3 + A2InTm FARP2 mut or clone 54.3 + A2InTm FYN mut cells, were seeded in soft agar (1 × 103 cells/well) in triplicates. After 17 days colonies of cells were stained with crystal violet. Shown are photographs of representative wells. D, E The average number of colonies per well with an area between 5000 and 10,000 µm2 or 10,000 and 15,000 µm2 was determined. Data are represented as mean ± SD. Statistical analysis was done using the one-tailed Mann-Whitney test. *P < 0.05, N = 3. F U87MG cells, clone 54.3+EV cells, clone 35 cells, clone 54.3 + A2InTm cells, clone 54.3 + A2InTm FARP2 mut cells and clone 54.3 + A2InTm FYN mut cells were seeded on fibronectin-coated coverslips and stained with DAPI to visualize cell nuclei (blue) and with fluorescent phalloidin (green) to visualize actin fibers. Shown are merged confocal photographs generated using ZEN 2.3 software. Red arrows point at multinucleated cells. G The percentage of multinucleated cells of the various cell types described in (F) was determined by counting 23 microscopic fields per each cell type. H An empty lentiviral expression vector (EV) or lentiviruses expressing cDNAs encoding A2InTm or A2InTm variant containing point mutations in the FARP2 binding site (A2InTm FARP2 mut) were expressed in clone 54.3 knock-out cells (54.3). The phosphorylation levels of AKT were assayed in the indicated cell types by western blot analysis of cell lysates as described in methods. Below is shown a histogram depicting the ratio between the intensity of the respective phospho-AKT bands and the total AKT bands. I An empty lentiviral expression vector (EV) or lentiviruses expressing cDNAs encoding A2InTm or A2InTm variant containing point mutations in the Fyn phosphorylation sites (A2InTm FYN mut) were expressed in clone 54.3 knock-out cells (54.3). The levels of AKT phosphorylation were determined as described under (H). Below is shown a histogram depicting the ratio between the intensity of the respective phospho-AKT bands and the total AKT bands.
Fig. 8
Fig. 8. Point mutations in the GAP domain of plexin-A2 inhibit rescue of cell proliferation by the plexin-A2 intracellular domain while a point mutation at the semaphorin binding site of plexin-A2 has no effect.
A U87MG cells, or U87MG clone 54.3 cells infected with either control lentiviruses (EV) or with lentiviruses encoding A2InTm or A2InTm variants containing point mutations in the conserved catalytic arginine residues of the GAP domain (54.3 + A2InTm R1428/1429 A) or the semaphorin binding site located in the extracellular domain of plexin-A2 (54.3 + A2 A396E), were seeded in quadruplicates in 96 well dishes (3 × 103 cells/well). Cell proliferation was measured using the WST-1 proliferation assay as described in materials and methods. Induction of cell proliferation was calculated as described under (1B). Data are represented as mean ± SD. Statistical analysis was done using the one-tailed Mann-Whitney test. *P < 0.05, ns: non-specific N = 5. B The indicated cell types were seeded on fibronectin-coated coverslips and stained with DAPI to visualize cell nuclei (blue) and with fluorescent phalloidin (green) to visualize actin fibers. Shown are merged confocal photographs generated using ZEN 2.3 software.

Similar articles

Cited by

References

    1. Neufeld G, Mumblat Y, Smolkin T, Toledano S, Nir-Zvi I, Ziv K, et al. The role of the semaphorins in cancer. Cell Adh Migr. 2016;10:652–74. doi: 10.1080/19336918.2016.1197478. - DOI - PMC - PubMed
    1. Eissler N, Rolny C. The Role of Immune Semaphorins in Cancer Progression. Exp Cell Res. 2013;319:1635–43. doi: 10.1016/j.yexcr.2013.04.016. - DOI - PubMed
    1. Tamagnone L, Artigiani S, Chen H, He Z, Ming GI, Song H, et al. Plexins are a large family of receptors for transmembrane, secreted, and GPI-anchored semaphorins in vertebrates. Cell. 1999;99:71–80. doi: 10.1016/S0092-8674(00)80063-X. - DOI - PubMed
    1. Kong Y, Janssen BJ, Malinauskas T, Vangoor VR, Coles CH, Kaufmann R, et al. Structural Basis for Plexin Activation and Regulation. Neuron. 2016;91:548–60. doi: 10.1016/j.neuron.2016.06.018. - DOI - PMC - PubMed
    1. Janssen BJ, Malinauskas T, Weir GA, Cader MZ, Siebold C, Jones EY. Neuropilins lock secreted semaphorins onto plexins in a ternary signaling complex. Nat Struct Mol Biol. 2012;19:1293–9. doi: 10.1038/nsmb.2416. - DOI - PMC - PubMed

Publication types

MeSH terms