. 2023 Jan 19;14(1):309.
doi: 10.1038/s41467-022-34642-6.

Molecular characterization of Richter syndrome identifies de novo diffuse large B-cell lymphomas with poor prognosis

Collaborators, Affiliations

Molecular characterization of Richter syndrome identifies de novo diffuse large B-cell lymphomas with poor prognosis

Julien Broséus et al. Nat Commun. .

Abstract

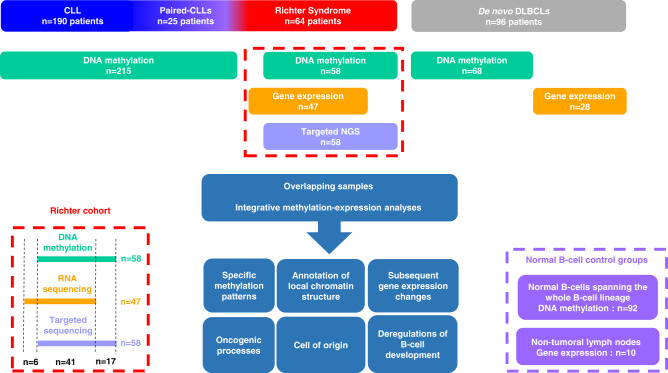
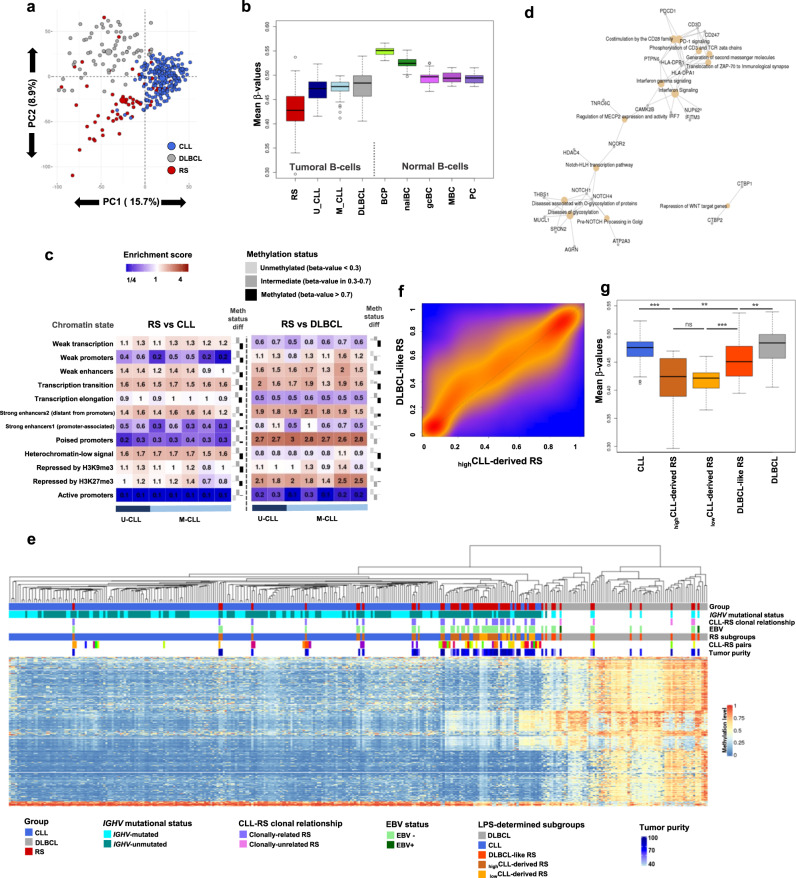
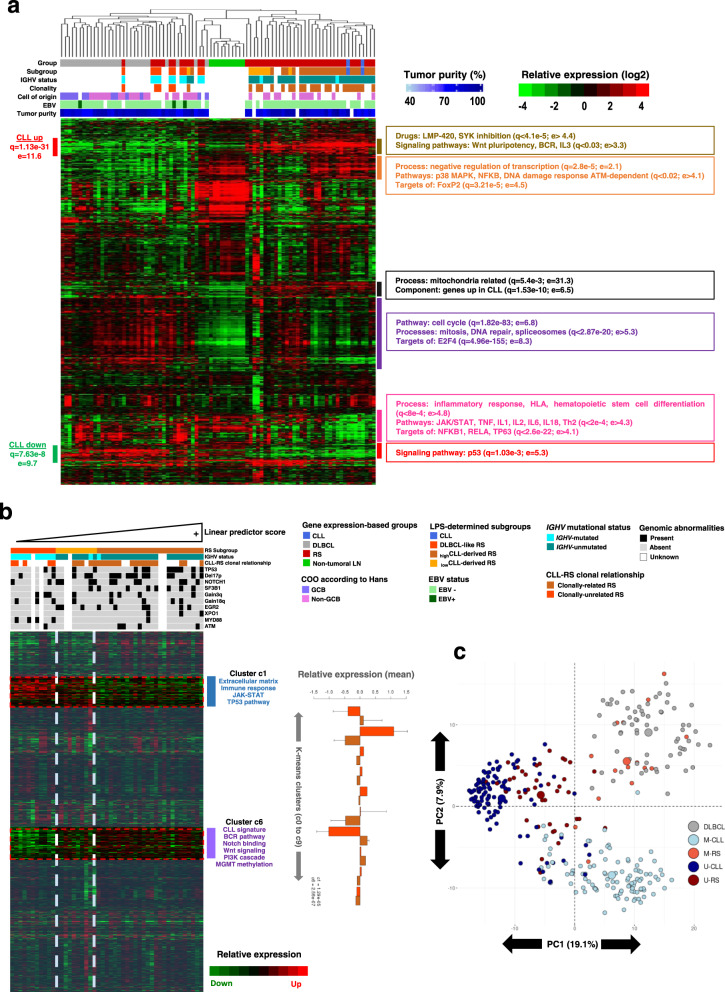
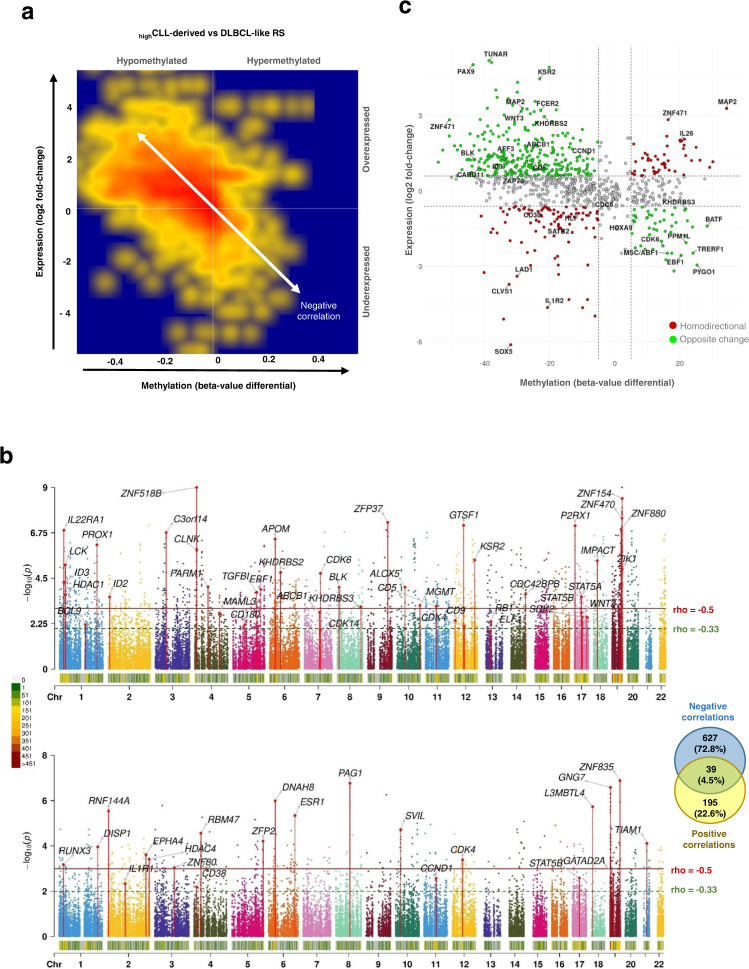
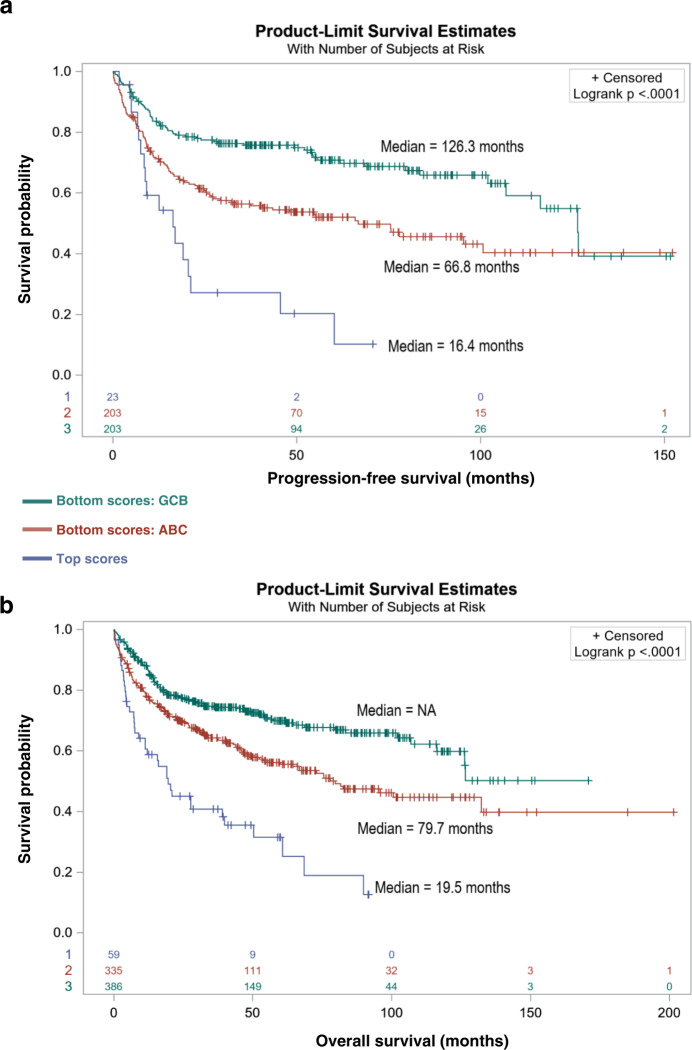
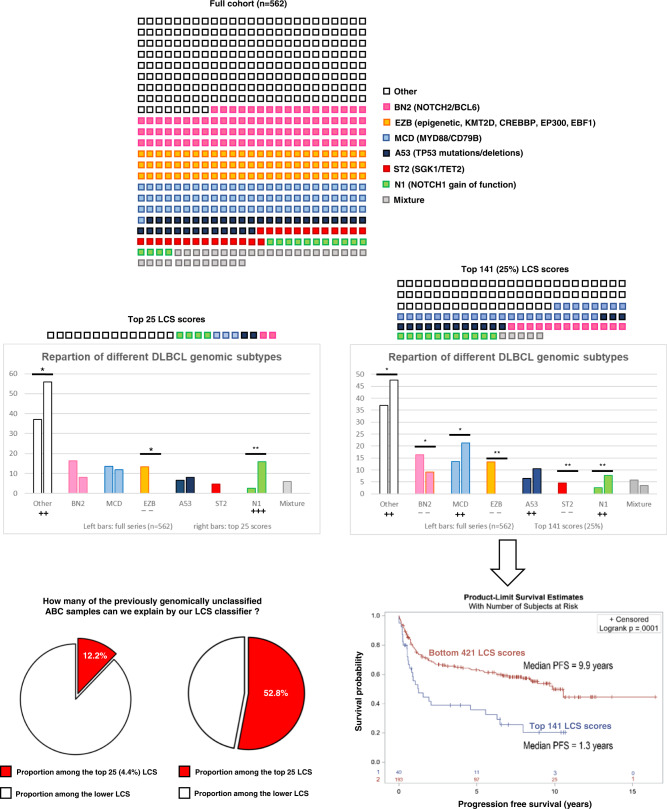
Richter syndrome (RS) is the transformation of chronic lymphocytic leukemia (CLL) into aggressive lymphoma, most commonly diffuse large B-cell lymphoma (DLBCL). We characterize 58 primary human RS samples by genome-wide DNA methylation and whole-transcriptome profiling. Our comprehensive approach determines RS DNA methylation profile and unravels a CLL epigenetic imprint, allowing CLL-RS clonal relationship assessment without the need of the initial CLL tumor DNA. DNA methylation- and transcriptomic-based classifiers were developed, and testing on landmark DLBCL datasets identifies a poor-prognosis, activated B-cell-like DLBCL subset in 111/1772 samples. The classification robustly identifies phenotypes very similar to RS with a specific genomic profile, accounting for 4.3-8.3% of de novo DLBCLs. In this work, RS multi-omics characterization determines oncogenic mechanisms, establishes a surrogate marker for CLL-RS clonal relationship, and provides a clinically relevant classifier for a subset of primary "RS-type DLBCL" with unfavorable prognosis.


Conflict of interest statement

The authors declare no competing interests.

Figures

Fig. 1
Fig. 1. Study workflow.
Genome-wide DNA methylation data were available for 58 RS, 25 CLLs paired with RS (tumor DNA samples were available at both CLL and RS stages), 190 other CLLs, 68 de novo DLBCLs, and 92 samples from normal B cells spanning the entire B lineage. All 58 RS samples were also documented for mutations in a custom panel of 13 CLL driver genes, and RNA-sequencing data were concomitantly available for 41 RS samples, allowing integrative analyses and detailed exploration of oncogenic processes and epigenetic network deregulations. RNA sequencing data were obtained for another 6 RS, 28 de novo DLBCLs, and 10 non-tumoral lymph nodes. Data acquired from normal B cell control groups were used for methodologic purposes only (see “Methods”). CLL chronic lymphocytic leukemia, DLBCL de novo diffuse large B cell lymphoma, NGS next-generation sequencing, RS Richter syndrome.
Fig. 2
Fig. 2. DNA methylation comparative analysis with CLL and de novo DLBCL shows that RS is a heterogeneous and hypomethylated entity.
a Unsupervised principal component analysis of the adjusted DNAm values of RS, CLL, and DLBCL. Geometrical centers are represented by bigger circles of the same color. b Boxplots of sample-averaged methylation levels with all 397,769 CpGs. RS (n = 58) versus U-CLL (n = 112): p = 7.74e−11; RS versus M-CLL (n = 103): p = 4.46e−12); RS versus DLBCL (n = 68): p = 6.07e−12. c Distribution of differential CpGs (FDR < 0.01; methylation differential >10%) according to the reported chromatin states in 7 CLL reference epigenomes. Enrichments are shown as a heatmap and were calculated from the position of the selected CpGs. Their distribution was reported among 12 different chromatin state categories. Barplots in the right part of each panel show the methylation status difference in RS versus CLL or DLBCL. Differentially methylated CpGs are distributed among 3 methylation level categories. Upward bars indicate a comparative gain of CpGs in RS for the corresponding category, while downward bars indicate a comparative loss in RS. d RS versus CLL top annotations network (ReactomePA) from 238 differential DMRs computed with DMRcate (Fisher’s multiple comparison statistics: min_smoothed_FDR and HMFDR both <0.01; max beta-value differential >30%; at least 3 CpGs in the DMR with no gap >1 kb between CpGs). e DNAm-based linear predictor score (LPS) CpG architecture. Hierarchical clustering of 4863 CpGs differential between CLL and DLBCL (FDR < 0.01; beta-value differential >30%; moderated t test). f Density map of DNAm between highCLL-derived and DLBCL-like RS. Smoothed beta-value densities from the EPIC dataset. Scale from blue (no density) to yellow (medium density) and red (high density). g Boxplots showing general methylation levels for highCLL-derived (n = 33), lowCLL-derived (n = 12), and DLBCL-like RS (n = 13), de novo DLBCLs (n = 68), and CLLs (n = 215). CLL versus highCLL-derived RS: p = 2.2e−16; highCLL-derived RS versus DLBCL-like RS: p = 5e−3; lowCLL-derived RS versus DLBCL-like RS: p = 9.9e−3; DLBCL-like RS versus DLBCL: p = 3.5e−2. BCP B cell precursors, CLL chronic lymphocytic leukemia, DLBCL de novo diffuse large B cell lymphoma, DNAm DNA methylation, EBV Epstein–Barr virus, FDR false discovery rate, gcBC germinal center B cells, highCLL-derived RS CLL-derived RS with a high LPS, HMFDR harmonic mean of the individual components FDR, MBC memory B cells, M-CLL IGHV-mutated CLL, lowCLL-derived RS CLL-derived RS with a LPS score below threshold, LPS linear predictor score, naiBC naive B cells, PC plasma cells, PC1/2 principal component 1/2, RS Richter syndrome, U-CLL IGHV-unmutated CLL. p values were derived from two-sided t tests. **p < 0.01; ***p < 0.001; ns not significant. For all box plots, center line indicates median; box limits indicate upper and lower quartiles; whiskers indicate 1.5× interquartile range; points indicate outliers. Source data are provided as a Source data file.
Fig. 3
Fig. 3. RS gene expression profiles corroborate DNA methylation subgrouping.
a Unsupervised hierarchical clustering of RS and de novo DLBCL transcriptomes (RNA-Seq; 23,508 genes). b K-means consensus clustering of RS transcriptomes according to DNA methylation-based LPS gradient. Expression level statistics for each cluster are displayed as barplots. Barplot: data are presented as mean values +/− standard deviation from the mean. Cluster 1: n = 1657 genes; p = 1.29e−5. Cluster 6: n = 2203 genes; p = 2.56e−7. p values were derived from two-sided t tests. Source data are provided as a Source data file. Differential clusters are functionally annotated to the right. Mutational statuses as reported with NGS, or abnormalities determined with CNV analysis on DNAm data, are added below sample annotation for a selected panel frequently described in CLL and RS. c Sample partitioning according to IGHV mutational status. Unsupervised PCA clustering of U-RS, M-RS, U-CLL, M-CLL, and DLBCL according to the 10,000 most variable CpGs in the dataset. The focus is made on the most variable CpGs because these are highly representative of the IGHV signature in CLL (59% of these CpGs are strongly differential between U-CLL and M-CLL). Indeed, PC1 separates IGHV-unmutated from IGHV-mutated B cell malignancies, with U-CLLs and U-RS segregating in the same area. Conversely, M-RS partition with DLBCLs, clearly separated from M-CLLs on PC2. CLL chronic lymphocytic leukemia, COO cell of origin, DLBCL de novo diffuse large B cell lymphoma, DLBCL-like RS DLBCL-like Richter syndrome, e enrichment, EBV Epstein–Barr virus, GCB germinal center B cell, highCLL-derived RS CLL-derived RS with a high LPS, LN lymph node, lowCLL-derived RS CLL-derived RS with an LPS score below threshold, LPS linear predictor score, M-CLL IGHV-mutated CLL, M-RS IGHV-mutated Richter syndrome, PC1/2 principal component 1/2, q q-value (corrected p value), RS Richter syndrome, U-CLL IGHV-unmutated CLL, U-RS IGHV-unmutated Richter syndrome.
Fig. 4
Fig. 4. Integrative analysis of DNA methylation and transcriptome data highlights different epigenetic programs in highCLL-derived and DLBCL-like RS.
a Density map (smoothed density scatterplot) representing overall DNA methylation versus gene expression changes between highCLL-derived RS and DLBCL-like RS. Scale ranges from blue (no density), to yellow (medium density) and red (high density). Only genes with at least one significant correlation (Spearman’s test; p value <0.01) were retained. Locations of the corresponding CpGs were mainly distributed in proximal and distal regulatory regions, with specific enrichments in TSS features for negative (TSS200: 2.6-fold, TSS1500: 2.2-fold) and positive (TSS200: 1.2-fold, TSS1500: 1.6-fold) correlations. Hypo/hyper-methylations and under/over-expressions are indicated relatively to the highCLL-derived RS subgroup. b Manhattan plots of negatively and positively correlated regulatory regions and associated transcript expressions. Chromosomes are displayed at the bottom of each plot, with a color code (from green to red) indicating the density of correlations over sliding windows of 1 Mb. Series of vertically aligned dots indicate DMRs (of at least 3 CpGs with a hit in TSS-associated location) significantly correlated with gene expression. Upper part: negative correlations, amounting to 666 unique genes; bottom part: positive correlations, amounting to 234 unique genes; a VENN diagram indicates the overlap between negative and positive correlations. c Quadrant scatterplot displaying methylation levels of regulatory sequences and corresponding expression levels for the 861 selected genes (overall absolute correlations: rho = 0.72; p < 2.2e−16; Spearman’s tests). The upper left and lower right quadrants show genes with a negative correlation between methylation and expression. Lower left and upper right areas: genes with positive correlations. CLL chronic lymphocytic leukemia, DLBCL de novo diffuse large B cell lymphoma, DLBCL-like RS DLBCL-like Richter syndrome, DMR differentially methylated region, highCLL-derived RS CLL-derived RS with a high linear predictor score, RS Richter syndrome, TSS transcription start site.
Fig. 5
Fig. 5. DLBCLs harboring the CLL-derived RS epigenetic signature are associated with ABC phenotype and worse outcome.
a Kaplan–Meier estimates of progression-free survival for n = 429 patients from three combined and clinically annotated public DLBCL datasets. Comparative PFS between patients with top LCS and the rest of the cohorts, according to COO (p = 8.4e−8). b Kaplan–Meier estimates of overall survival for n = 780 patients from four combined and clinically annotated DLBCL public datasets–,. Comparative OS between patients with top LCS and the rest of the cohorts, according to COO (p = 1.1e−11). Statistical comparisons were performed with the log-rank test. Bonferroni method was used for multitesting adjustments. Datasets: from Lenz et al. (n = 420; microarray, accession under GSE10846; PMID: 21546504); from Chapuy et al. (n = 137; microarray, accession under GSE98588; PMID: 29713087); from Dubois et al. (n = 223; microarray, accession under GSE87371; PMID: 31648986); from Wright et al. (n = 562; RNA-Seq; PMID: 32289277). ABC activated B cell, CLL chronic lymphocytic leukemia, COO cell of origin, DLBCL de novo diffuse large B cell lymphoma, GCB germinal center B cell, LCS linear classifier score, OS overall survival, PFS progression-free survival, RS Richter syndrome.
Fig. 6
Fig. 6. The gene expression-based LCS linearly classifies de novo DLBCL samples, with high scores enriched in N1, unclassified genomic profiles, and shorter progression-free survival.
Dataset from Wright et al. (n = 562; RNA-Seq; PMID: 32289277). Two-sided t tests were used to assess statistical significance. Top 25 LCS scores: enrichment in “other” subtype (e = 1.51; p = 4.6e−2); depletion in EZB subtype (e = 0; p = 3.0e−2); enrichment in N1 subtype (e = 5.99; p = 6.4e−3). Top 141 (25%) LCS scores: enrichment in “other” subtype (e = 1.28; p = 1.4e−2); depletion in BN2 subtype (e = 0.56; p = 1.9e−2); enrichment in MCD subtype (e = 1.57; p = 1.7e−2); depletion in EZB subtype (e = 0; p = 1.7e−8); enrichment in A53 subtype (e = 1.62; p = 7.5e−2); depletion in ST2 subtype (e = 0; p = 2.6e−3); enrichment in N1 subtype (e = 2.92; p = 7.0e−3). Survival curves: Kaplan-Meier estimates of progression-free survival for n = 233 patients from a clinically and genomically annotated dataset from Wright and colleagues. Comparative PFS between patients with top 25% LCS and the rest of the cohort. Statistical comparisons were performed with the log-rank test (p = 1e−4). Source data are provided as a Source Data file. ABC activated B cell like, A53 TP53 mutations/deletions-associated DLBCL subgroup, BN2 DLBCL subgroup associated with lesions of BCL6 and/or NOTCH2, COO cell of origin, DLBCL de novo diffuse large B cell lymphoma, EZB DLBCL subgroup associated with abnormalities of epigenetic regulators KMT2D, CREBBP, EP300, and/or EBF1, GCB germinal center B cell, LCS linear classifier score, MCD DLBCL subgroup associated with lesions of MYD88 and/or CD79B, N1 DLBCL subgroup associated with NOTCH1 gain of function, PFS progression-free survival, RS Richter syndrome, ST2 DLBCL subgroup associated with lesions of SGK1 and/or TET2. *p value <0.05; **p value <0.01; ++: enrichment >1.2; +++: enrichment >5; –: depletion <0.6.

References

    1. Siegel RL, Miller KD, Fuchs HE, Jemal A. Cancer statistics, 2021. CA Cancer J. Clin. 2021;71:7–33. doi: 10.3322/caac.21654. - DOI - PubMed
    1. Kipps TJ, et al. Chronic lymphocytic leukaemia. Nat. Rev. Dis. Prim. 2017;3:17008. doi: 10.1038/nrdp.2017.8. - DOI - PubMed
    1. Hallek M, et al. iwCLL guidelines for diagnosis, indications for treatment, response assessment, and supportive management of CLL. Blood. 2018;131:2745–2760. doi: 10.1182/blood-2017-09-806398. - DOI - PubMed
    1. Mao Z, et al. IgVH mutational status and clonality analysis of Richter’s transformation: diffuse large B-cell lymphoma and Hodgkin lymphoma in association with B-cell chronic lymphocytic leukemia (B-CLL) represent 2 different pathways of disease evolution. Am. J. Surg. Pathol. 2007;31:1605–1614. doi: 10.1097/PAS.0b013e31804bdaf8. - DOI - PubMed
    1. Alizadeh AA, et al. Distinct types of diffuse large B-cell lymphoma identified by gene expression profiling. Nature. 2000;403:503–511. doi: 10.1038/35000501. - DOI - PubMed

Publication types

MeSH terms