. 2023 Jan 19;14(1):334.
doi: 10.1038/s41467-023-35858-w.

Semi-quantitative detection of pseudouridine modifications and type I/II hypermodifications in human mRNAs using direct long-read sequencing

Affiliations

Semi-quantitative detection of pseudouridine modifications and type I/II hypermodifications in human mRNAs using direct long-read sequencing

Sepideh Tavakoli et al. Nat Commun. .

Abstract

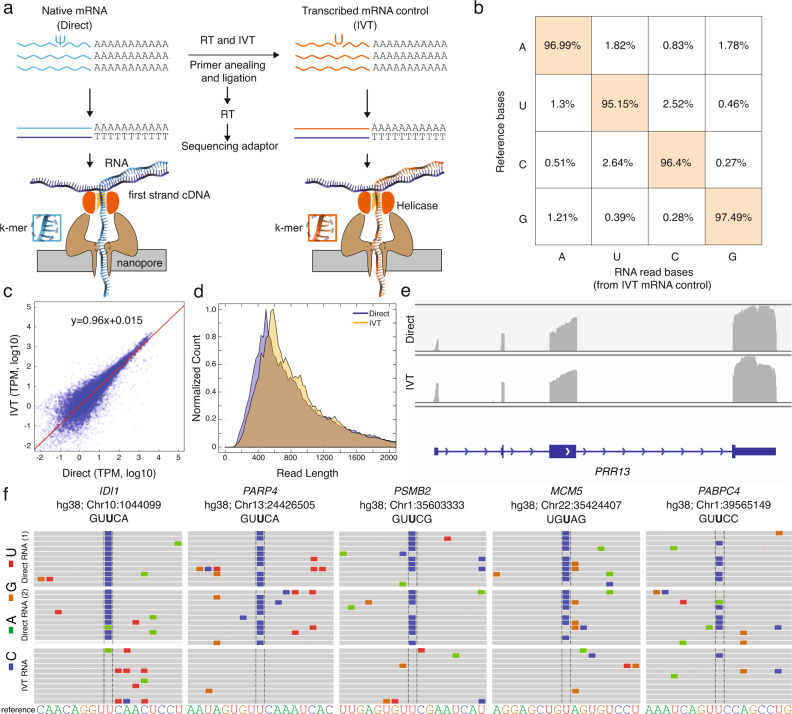
Here, we develop and apply a semi-quantitative method for the high-confidence identification of pseudouridylated sites on mammalian mRNAs via direct long-read nanopore sequencing. A comparative analysis of a modification-free transcriptome reveals that the depth of coverage and specific k-mer sequences are critical parameters for accurate basecalling. By adjusting these parameters for high-confidence U-to-C basecalling errors, we identify many known sites of pseudouridylation and uncover previously unreported uridine-modified sites, many of which fall in k-mers that are known targets of pseudouridine synthases. Identified sites are validated using 1000-mer synthetic RNA controls bearing a single pseudouridine in the center position, demonstrating systematic under-calling using our approach. We identify mRNAs with up to 7 unique modification sites. Our workflow allows direct detection of low-, medium-, and high-occupancy pseudouridine modifications on native RNA molecules from nanopore sequencing data and multiple modifications on the same strand.


Conflict of interest statement

The authors declare no competing interests.

Figures

Fig. 1
Fig. 1. Nanopore native poly(A) RNA sequencing pipeline to identify ψ-modified sites.
a Library preparation for Nanopore sequencing of native poly(A)-containing mRNAs (direct) and sequencing of in vitro transcribed (IVT) control. b The accuracy of called bases of in vitro transcribed (IVT) control samples. The x-axis shows called bases from nanopore reads and the y-axis is the base identity from the reference sequence at the same position that the nanopore reads are aligned to. c log10(TPM) of direct versus the log10(TPM) of IVT. d Normalized count of different read lengths for direct reads (blue) versus IVT reads (orange). e IGV snapshot of PRR13 in direct (top) and IVT (bottom). f Representative snapshot from the integrated genome viewer (IGV) of aligned nanopore reads to the hg38 genome (GRCh38.p10) at previously annotated ψ sites. Correctly aligned bases are shown in gray, miscalled bases are shown in colors (cytidine, blue; adenine, green; guanine, orange; uridine, red). Genomic reference sequence is converted to sense strand and shown as RNA for clarity.
Fig. 2
Fig. 2. Basecalling errors can be used to detect RNA modifications if specific k-mer and coverage are considered, and the density of satellite modifications on rRNAs is different from mRNAs.
a Average base quality for different numbers of reads using IVT reads. Data are represented as mean ± standard deviation. b Distribution of U-to-C mismatch percentage for three populations based on read coverage (low coverage, teal; medium coverage, yellow; high coverage, red). c Distribution of U-to-C mismatch percentage for three populations based on 5-mer sequences (AATCT, blue; CATAG, green; CTTTG, yellow). d IGV snapshot of 18 S rRNA for Direct (Upper) and IVT (lower). Correctly aligned bases are shown in gray, miscalled bases are shown in colors (cytidine, blue; adenine, green; guanine, orange; uridine, red). e Schematic figure in which delta nucleotide is the distance to the putative modification position. f (Top) the IGV callout of a representative 200mer section of 18 S rRNA and IGV snapshots of 200mer regions within 3 mRNAs with putative modifications. Presence of a basecalling error in the Direct and not in IVT denotes a putative site of modification indicated by a black triangle. Correctly aligned bases are shown in gray, miscalled bases are shown in colors (cytidine, blue; adenine, green; guanine, orange; uridine, red).
Fig. 3
Fig. 3. Previously annotated ψ modifications in the human transcriptome are validated by nanopore sequencing.
a The schematic workflow of the CMC-based methods that have detected ψ modification in the human transcriptome. a Pseudo-Seq, (b) Ψ-Seq, (c) CeU-Seq, and (d) modified bisulfite sequencing (RBS-Seq). e U-to-C mismatch error (%) of the merged replicates of direct RNA of known ψ sites versus the log10(TPM) of merged direct RNA sequencing replicates. All targets shown are identified from the direct RNA sequencing data as likely to be pseudouridylated based on a P value calculation and are previously annotated by at least one previous method. teal: annotated by one previous method, blue: annotated by two previous methods, magenta: annotated by three previous methods. P value was calculated by a one-sided F test (specific formula listed in Methods). 0.001 < p < 0.01 is defined as significant and shown with a small dot; p < 0.001 is defined as highly significant and shown with a large dot. f The annotation of the genes containing a reported ψ modification by two or more previous methods (blue: annotated by two previous methods, magenta: annotated by three previous methods). The sites that are not validated by our nanopore method are shown in gray.
Fig. 4
Fig. 4. Nanopore sequencing detects uridine modifications transcriptome-wide.
a The U-to-C mismatches detected by nanopore sequencing versus the −log10(TPM) of the merged direct RNA datasets. large dot: the detected targets identified by the significance factor of two out of three biological replicates. P value was calculated by a one-sided F test (specific formula listed in Methods). 0.001 < p < 0.01 is defined as significant and shown with a small dot; p < 0.001 is defined as highly significant and shown with a large dot. blue: Targets with PUS7 motif, red: Targets with TRUB1 motif, and gray: Targets with the motifs other than PUS7 or TRUB1. b The k-mer frequency of the most frequently detected targets with higher confidence. c The sequence motif across the detected ψ modification for all detected k-mers generated with kplogo. d The distribution of detected ψ sites in the 5′ untranslated region (5′ UTR; yellow), 3′ untranslated region (3′ UTR; blue), and coding sequence (CDS; brown). Sites were chosen based on a p value < 0.001 from (a). e The read depth of the reads aligned to PRR13 versus the relative distance to the transcription start site (TSS) and transcription termination site (TTS). f The boxplots represent the distance of each detected site from the nearest splice junction for sites in the 5′UTR, 3′UTR, or CDS after reads were assigned to a dominant isoform using FLAIR. Median is shown with an orange line and mean is shown with a green triangle. Whiskers terminate at maxima/minima or a distance of 1.5 times the IQR away from the upper/lower quartile.
Fig. 5
Fig. 5. Solid-phase synthesis of 1000 mer RNA standards that maintain the sequence context of putative ψ sites demonstrates a systematic undercalling of the modification.
a A pair of 1000-mer synthetic RNA oligos were designed, one containing 100% uridine and the other containing 100% ψ in the sequence context of a natural transcript. b The frequency histograms of 13 nucleotides surrounding the detected ψ position in the middle of a k-mer in four different mRNAs: PSMB2, MCM5, PRPSAP1, and MRPS14, and PTTG1IP. c The U-to-C mismatches of the detected ψ position for merged replicates of direct RNA seq versus −log10(significance). The targets with U-to-C mismatch of higher than 40% are defined as hypermodified type 1. The sequence motifs for different mismatch ranges are shown. d K-mer frequency is shown for hypermodified type I and not- hypermodified ψ sites with the highest occurrence. e Distribution of U-to-C mismatches higher than 40% in mRNA regions. Insets for d and e show relative fractions of k-mers that are substrates of PUS7, TRUB1 and other motifs.
Fig. 6
Fig. 6. Type II hypermodification is defined as the mRNA targets that contain two or more uridine-modified positions.
a Unique mRNAs that are classified as hypermodification type II positions and the number of modified positions possible on each. b Two examples of hypermodified type II transcripts (CHTOP – chr1:153,645,392-153,654,395 & PABPC4 – chr1:39,562,394-39,565,149) with two modified positions indicating U-to-C mismatch on a single read for long reads that cover both positions. c Examples of type II hypermodification with three or more modified positions distributed across each gene.

References

    1. Roundtree IA, Evans ME, Pan T, He C. Dynamic RNA Modifications in Gene Expression Regulation. Cell. 2017;169:1187–1200. doi: 10.1016/j.cell.2017.05.045. - DOI - PMC - PubMed
    1. Taoka M, et al. Landscape of the complete RNA chemical modifications in the human 80S ribosome. Nucleic Acids Res. 2018;46:9289–9298. doi: 10.1093/nar/gky811. - DOI - PMC - PubMed
    1. Li X, et al. Chemical pulldown reveals dynamic pseudouridylation of the mammalian transcriptome. Nat. Chem. Biol. 2015;11:592–597. doi: 10.1038/nchembio.1836. - DOI - PubMed
    1. Mellis IA, Gupte R, Raj A, Rouhanifard SH. Visualizing adenosine-to-inosine RNA editing in single mammalian cells. Nat. Methods. 2017;14:801–804. doi: 10.1038/nmeth.4332. - DOI - PMC - PubMed
    1. Spitale RC, et al. Structural imprints in vivo decode RNA regulatory mechanisms. Nature. 2015;519:486–490. doi: 10.1038/nature14263. - DOI - PMC - PubMed

Publication types