. 2023 Jan 19;14(1):315.
doi: 10.1038/s41467-023-35958-7.

scm6A-seq reveals single-cell landscapes of the dynamic m6A during oocyte maturation and early embryonic development

Affiliations

scm6A-seq reveals single-cell landscapes of the dynamic m6A during oocyte maturation and early embryonic development

Huan Yao et al. Nat Commun. .

Abstract

N6-methyladenosine (m6A) has been demonstrated to regulate RNA metabolism and various biological processes, including gametogenesis and embryogenesis. However, the landscape and function of m6A at single cell resolution have not been extensively studied in mammalian oocytes or during pre-implantation. In this study, we developed a single-cell m6A sequencing (scm6A-seq) method to simultaneously profile the m6A methylome and transcriptome in single oocytes/blastomeres of cleavage-stage embryos. We found that m6A deficiency leads to aberrant RNA clearance and consequent low quality of Mettl3Gdf9 conditional knockout (cKO) oocytes. We further revealed that m6A regulates the translation and stability of modified RNAs in metaphase II (MII) oocytes and during oocyte-to-embryo transition, respectively. Moreover, we observed m6A-dependent asymmetries in the epi-transcriptome between the blastomeres of two-cell embryo. scm6A-seq thus allows in-depth investigation into m6A characteristics and functions, and the findings provide invaluable single-cell resolution resources for delineating the underlying mechanism for gametogenesis and early embryonic development.


Conflict of interest statement

The authors declare no competing interests.

Figures

Fig. 1
Fig. 1. scm6A-seq detects m6A signatures in individual germinal vesicle (GV) oocytes.
a Schematic diagram showing the scm6A-seq method and an overview of the samples analyzed. The carton image of oocytes and early embryos is created with BioRender. b Saturation curves for each GV oocyte data obtained by scm6A-seq. Each point on the curve was generated by randomly selecting a number of raw reads from each GV cell library and then using the same alignment pipeline to call covered genes. c Bar plot showing the number of detected m6A peaks and modified transcripts in each GV oocyte using scm6A-seq. d The distribution of mRNA m6A peaks in individual GV oocytes. e Metagene profiles depicting the normalized sequence coverage ratio of m6A-IP to RNA-seq data in positions surrounding the transcription start site (TSS) (left) and translation stop codon (right). The red line and light red shadow represent the mean and quantiles of 10 GV oocytes determined by scm6A-seq, respectively. The other three colored lines represent bulk MeRIP-seq and RNA-seq, as labeled in the panel. f Bar plot displaying the accumulative fraction of the number of the commonly m6A modified transcripts in 10 GV oocytes. Source data are provided as a Source data file. g The box and point plot showing the expression of common m6A modified transcripts. The x-axis shows the number of common m6A peaks in 10 GV oocytes. Source data are provided as a Source data file. h Venn diagram displaying the common m6A modified transcripts between single cells and bulk cells detected from MeRIP-seq data. Light green pie represents identified modified RNAs identified in 70 GV oocytes by MeRIP-seq, and the purple pies represent the common m6A modified RNAs form 10 individual GV oocytes as determined by scm6A-seq. n represents the frequency with which common m6A modified RNAs appeared in the analysis of the 10 individual GV oocytes.
Fig. 2
Fig. 2. METTL3-catalyzed m6A deposition mediates the degradation of m6A modified RNAs in GV oocytes.
a Metagene profiles depicting m6A signals surrounding the stop codon in control and Mettl3 conditional knockout (cKO) GV oocytes. b Heatmap showing the METTL3-dependent m6A modified transcripts in GV oocytes. c Functional annotation analysis of METTL3-dependent m6A modified transcripts using Metascape. The enrichment and P value was calculated with default parameters using hypergeometric test of functional annotation in DAVID database. d Cumulative frequency of expression change (log2(fold change)) of METTL3-dependent, METTL3-independent m6A modified and unmodified RNAs upon Mettl3 silencing. P values were determined by one-sided Wilcoxon test. P = 1.2e−10, between METTL3-independent and W/O m6A RNA sets. P < 2.2e−16, between METTL3-dependent and W/O m6A RNA sets. ***P < 0.001. e Integrated Genomics Viewer (IGV) diagram displaying the translation signals of Ythdf2 in oocytes and zygotes. f Density plot displaying the distance between YTHDF2 target peaks detected by enhanced crosslinking and immunoprecipitation sequencing (eCLIP-seq) in mESCs (GSE151788) and METTL3-dependent m6A peaks in GV oocytes by scm6A-seq. g Integrated Genomics Viewer (IGV) diagram showing the METTL3-dependent m6A peaks across Cdc25b, Bag6, and B4galt5. The light blue boxes represent the identified m6A peaks identified by scm6A-seq.
Fig. 3
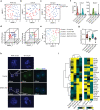
Fig. 3. scm6A-seq distinguishes surrounded nucleolus (SN) and non-surrounded nucleolus (NSN) oocytes.
ac Uniform manifold approximation and projection (UMAP) plot based on the reads count matrix of RNA-seq (a) and m6A-IP (b), and merged total reads count of single GV oocytes (c). The UMAP plot is colored on the basis of the cells type. Source data are provided as a Source data file. d The 3D plot showing the relative m6A level of each GV oocyte based on the UMAP results, colored by cells type (left) and cells reclassified by the comprehensive analysis of the gene expression matrix reduced dimensions by UMAP and m6A level (right). Source data are provided as a Source data file. e The two-dimensional UMAP diagram showing the cell populations on the basis of the classification results in (d). The Clusters 1–4 of cells were redefined as Control SN, Control NSN, Mettl3 cKO SN, and Mettl3 cKO NSN clusters according to the expression of marker RNAs and genome type of oocytes. Source data are provided as a Source data file. f Violin plot showing the quality of markers Gata3 and Mpak7 expression in oocytes in different clustering populations. g Combined box and scatter plot showing the difference in RNA amount between SN and NSN oocytes. n (Control SN) = 19, n (Control NSN) = 12, n (Mettl3 cKO SN) = 14, and n (Mettl3 cKO) = 12. The middle lines of the boxes represent the medians of datasets. The upper and bottom lines of the boxes are respectively the upper quantile and the lower quantile of the data. The whiskers mark the upper and lower limits of these datasets, respectively. The two-sided P value was calculated by unpaired student t test. Source data are provided as a Source data file. h Morphology of the pronuclear in both the SN and NSN oocytes isolated from the cumulus cell-oocyte complex (COC). Both control and METTL3-null oocytes were stained with DAPI and an anti-METTL3 antibody. n (Control) = 28, n (Mettl3Gdf9 cKO) = 14. The white rectangle represents the area of the nucleus to be enlarged. Source data are provided as a Source data file. i Heatmap showing the expression levels of presentative genes in both control and METTL3-null oocytes (left) and oocytes at different growth stages (right). The representative genes were identified by the most differentially expressed genes in the SN and NSN oocytes compared to control oocytes. Source data are provided as a Source data file.
Fig. 4
Fig. 4. The dynamic m6A landscape during oocyte maturation.
a Line plot showing the decrease in expression of the gene set during oocyte maturation as indicated by K-means clustering. b Bar plot displaying the enriched Gene Ontology (GO) terms in the gene set showing in (a). The enrichment and P value were calculated with default parameters using hypergeometric test of functional annotation in DAVID database. c Metagene profiles depicting m6A signals in areas surrounding the transcription start site (TSS) (left) and stop codon (right). Colored lines represent different stages of oocyte maturation. d Uniform manifold approximation and projection (UMAP) clustering for oocytes at different stages using the merged omics data obtained by scm6A-seq. e Cumulative frequency of translation signals (GSE169632) for RNAs with or without m6A modification in MII oocytes. P values were determined by one-sided Wilcoxon test, P < 2.2e−16. ***P < 0.001. f Heatmap displaying the protein abundance of YTHDF1/2/3 in GV and MII oocytes. g Density plot displaying the distance between YTHDF3 target peaks detected by enhanced crosslinking and immunoprecipitation sequencing (eCLIP-seq) in mouse embryonic stem cells (mESCs) (GSE151788) and m6A modified RNAs in MII oocytes by scm6A-seq.
Fig. 5
Fig. 5. m6A regulates RNA stability during the oocyte-to-embryo transition.
a Heatmap showing the normalized expression of significantly dysregulated RNAs between two adjacent time points during early embryo development. The expression of maternal decay genes is the upregulated in MII oocytes, that of minor zygotic genome activation (ZGA) genes is upregulated in the early and mid-2-cell stages, and that of major ZGA genes is upregulated in the late 2-cell and 4-cell stages. b Box and scatter plot showing the expression of m6A-modified RNAs in oocytes from the MII to the 4-cell stage. The middle lines of the boxes represent the medians of datasets. The upper and bottom lines of the boxes are respectively the upper quantile and the lower quantile of the data. The whiskers mark the upper and lower limits of these datasets respectively. P values were determined by one-sided Wilcoxon test, P = 2.611e−9. ***P < 0.001. c Cumulative fraction of RNA expression change (log2(fold change)) between zygote and MII oocytes of WT oocytes. P values were determined by one-sided Wilcoxon test, P < 2.2e−16. ***P < 0.001. d Cumulative fraction of RNA expression change (log2(fold change)) between zygotes and MII oocytes of Mettl3Gdf9 cKO oocytes. P values were determined by one-sided Wilcoxon test, P = 5.413e−11. ***P < 0.001. e Genome browser showing the representative RNA abundance of m6A modified maternal RNAs in control and Mettl3Gdf9 cKO MII oocytes and zygotes. f Heatmap showing the expression level of m6A-related RNAs in scm6A-seq data during early embryonic development. g Protein abundance of expressed m6A-related proteins during early embryonic development. h Density plot displaying the distance between IGF2BP2 target peaks detected by enhanced crosslinking and immunoprecipitation sequencing (eCLIP-seq) in human embryo steam cells (hESCs) (GSE78509) and m6A peaks identified in MII oocytes by scm6A-seq.
Fig. 6
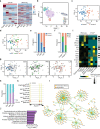
Fig. 6. Transcription factors (TFs) with m6A modification involved in early embryonic development.
a Heatmap displaying the expression of m6A-modified RNAs during early embryonic development. b Uniform manifold approximation and projection (UMAP) clustering of cells during early embryonic development. c Principal component analysis (PCA) with cells in the early, mid-, and late 2-cell stages using merged omics data of scm6A-seq. Cells are colored by cluster population. Source data are provided as a Source Data file. d Annotated stage information for the analysis presented in (c). Cells are colored by stage information as indicated. e The proportion of cells in each cluster of different 2-cell stage oocytes. f The proportion of cells in each stage for different clustering populations. g PCA plot displaying the cell pairing information of early, mid-, and late 2-cell embryos. h Bar plot showing the proportion of pairing information for different stages of the 2-cell embryos in two cluster populations. i TF mRNAs with the most enrichment motifs identified from promoter and gene body peaks of the differentially expressed genes among Cluster1 blastomeres and Cluster2 blastomeres. Source data are provided as a Source Data file. j Bar plot of Gene Ontology (GO) term enrichment for the TFs with m6A modification in the 4-cell stage embryos. The enrichment and P value were calculated with default parameters using hypergeometric test of functional annotation in DAVID database. k Genome browser showing the read abundance for Pou5f1 in early embryo cells as indicated by the scm6A-seq data. The yellow rectangle boxes represent identified m6A peaks in 4-cell embryos. l TF-target network displaying the modified TF mRNAs with their targets in 4-cell stage embryos. Diamonds are the modified TF mRNAs, and the circular dots represent their targets. The size of the TF mRNAs represents the number of interacting pairs.

References

    1. Boccaletto P, et al. MODOMICS: a database of RNA modification pathways. 2021 update. Nucleic Acids Res. 2022;50:D231–D235. doi: 10.1093/nar/gkab1083. - DOI - PMC - PubMed
    1. Xiao W, et al. Nuclear m6A reader YTHDC1 regulates mRNA splicing. Mol. Cell. 2016;61:507–519. doi: 10.1016/j.molcel.2016.01.012. - DOI - PubMed
    1. Roundtree IA, et al. YTHDC1 mediates nuclear export of N6-methyladenosine methylated mRNAs. Elife. 2017;6:28. doi: 10.7554/eLife.31311. - DOI - PMC - PubMed
    1. Liu J, et al. N6-methyladenosine of chromosome-associated regulatory RNA regulates chromatin state and transcription. Science. 2020;367:580–586. doi: 10.1126/science.aay6018. - DOI - PMC - PubMed
    1. Liu JD, et al. The RNA m6A reader YTHDC1 silences retrotransposons and guards ES cell identity. Nature. 2021;591:322–326. doi: 10.1038/s41586-021-03313-9. - DOI - PubMed

Publication types