. 2023 Jan 19;13(1):1098.
doi: 10.1038/s41598-022-25989-3.

Human-mediated dispersal drives the spread of the spotted lanternfly (Lycorma delicatula)

Affiliations

Human-mediated dispersal drives the spread of the spotted lanternfly (Lycorma delicatula)

Zachary S Ladin et al. Sci Rep. .

Abstract

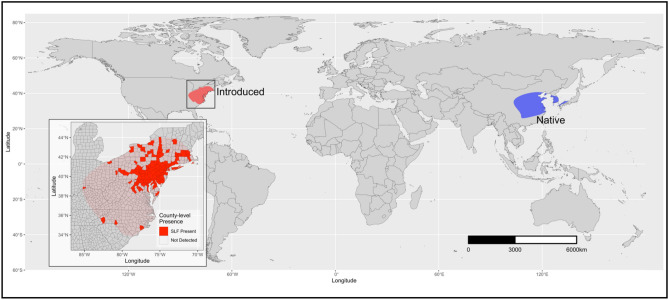
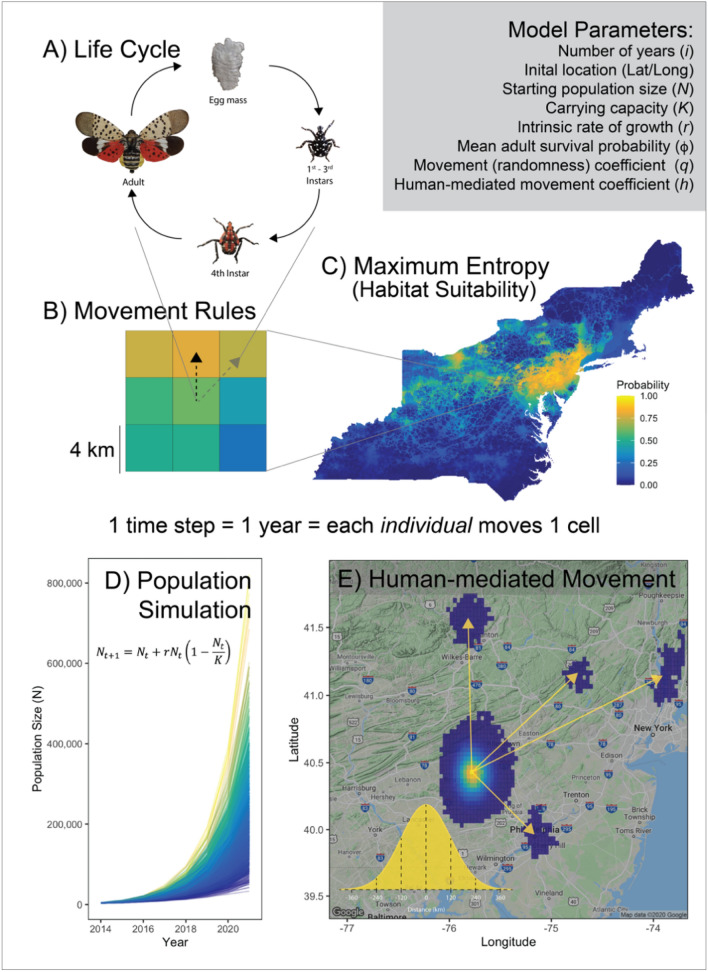
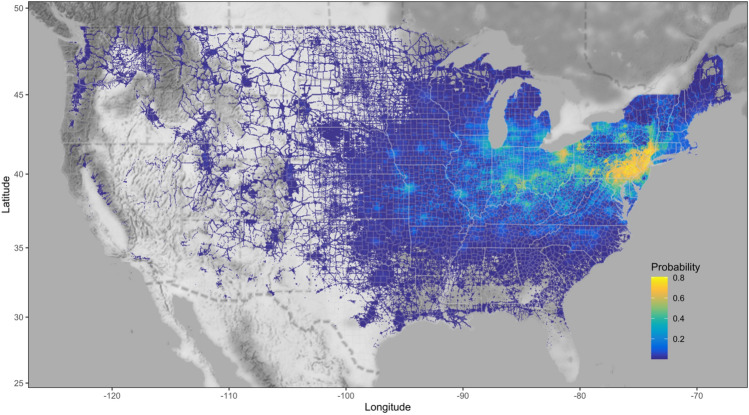
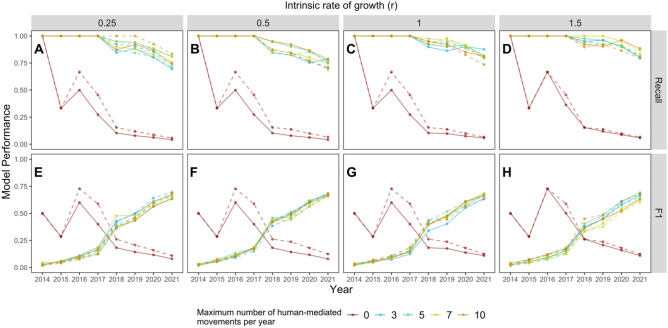
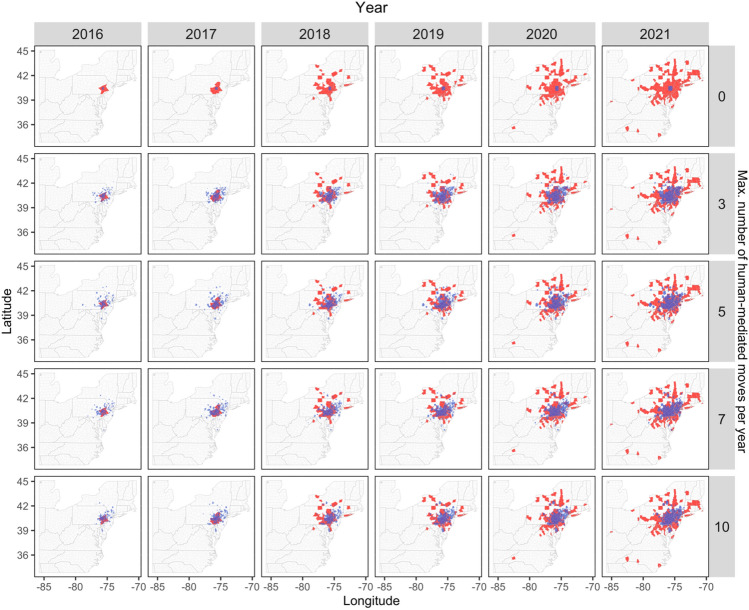
The spotted lanternfly (Lycorma delicatula) is a novel invasive insect from Asia now established and spreading throughout the United States. This species is of particular concern given its ability to decimate important crops such as grapes, fruit trees, as well as native hardwood trees. Since its initial detection in Berks County, Pennsylvania in 2014, spotted lanternfly infestations have been detected in 130 counties (87 under quarantine) within Connecticut, Delaware, Indiana, Maryland, New Jersey, New York, Ohio, Virginia, and West Virginia. Compounding this invasion is the associated proliferation and widespread distribution of the spotted lanternfly's preferred host plant, the tree-of-heaven (Ailanthus altissima). While alternate host plant species have been observed, the tree-of-heaven which thrives in disturbed and human-dominated areas (e.g., along roads and railways) is likely facilitating the population growth rates of spotted lanternfly. We simulated the population and spread dynamics of the spotted lanternfly throughout the mid-Atlantic USA to help determine areas of risk and inform continued monitoring and control efforts. We tested the prediction that spotted lanternfly spread is driven by human-mediated dispersal using agent-based models that incorporated information on its life-history traits, habitat suitability, and movement and natural dispersal behavior. Overwhelmingly, our results suggest that human-mediated dispersal (e.g., cars, trucks, and trains) is driving the observed spread dynamics and distribution of the spotted lanternfly throughout the eastern USA. Our findings should encourage future surveys to focus on human-mediated dispersal of egg masses and adult spotted lanternflies (e.g., attachment to car or transported substrates) to better monitor and control this economically and ecologically important invasive species.


Conflict of interest statement

The authors declare no competing interests.

Figures

Figure 1
Figure 1
Map of global distribution of the spotted lanternfly in both its native range (blue) and introduced range (red) within eastern United States. Map inset shows zoomed in county-level spotted lanternfly presence. This map was made using the ‘ggplot2’ (ver. 3.3.6; https://cran.r-project.org/web/packages/ggplot2/index.html) and ‘cowplot’ (ver. 1.0.0; https://www.rdocumentation.org/packages/cowplot/versions/1.1.1) packages in R.
Figure 2
Figure 2
Graphical description of agent-based model showing list of model parameters and model components: (A) spotted lanternfly annual life cycle, (B) simple movement rules corresponding to annual movement (i.e., 1 year or time step) of a single individual (agent), (C) map of Maxent model-based estimate of spotted lanternfly potential probability of occurrence based on several environmental and landscape variables, (D) examples of simulated exponential pextremely modest amountsopulation growth dynamics, and (E) depiction of human-mediated movement events leading to newly established infestations. The inset maps and figures were produced using the ‘ggplot2’ (ver. 3.3.6; https://cran.r-project.org/web/packages/ggplot2/index.html), ‘ggmap’ (ver. 3.0.0.903; ver. 3.0.0.903; https://cran.r-project.org/web/packages/ggmap/index.html), and ‘cowplot’ (ver. 1.0.0; https://www.rdocumentation.org/packages/cowplot/versions/1.1.1) packages in R.
Figure 3
Figure 3
Generalized description of the algorithm used to simulate the human-mediated movement process component of our model.
Figure 4
Figure 4
Estimates of spotted lanternfly (Lycorma delicatula) probability of occurrence based on maximum entropy (Maxent) species distribution models throughout the contiguous United States. This map was produced using the ‘ggplot2’ (ver. 3.3.6; https://cran.r-project.org/web/packages/ggplot2/index.html) and ‘ggmap’ (ver. 3.0.0.903; ver. 3.0.0.903; https://cran.r-project.org/web/packages/ggmap/index.html) packages in R.
Figure 5
Figure 5
Maps showing observed county-level occurrence of spotted lanternfly (Lycorma delicatula) by year between 2014 and 2021 (red polygons) overlaid on Maxent model estimates of spotted lanternfly probability of occurrence. Probability of SLF occurrence ranges between low (< 0.01, dark gray) and high (> 0.8, light gray) values. The small multiple maps were produced using the ‘ggplot2’ (ver. 3.3.6; https://cran.r-project.org/web/packages/ggplot2/index.html) and ‘ggmap’ (ver. 3.0.0.903; https://cran.r-project.org/web/packages/ggmap/index.html) packages in R.
Figure 6
Figure 6
Comparison of Recall (AD) and F1 (EH) model performance metrics (range between 0 and 1, where 1 is highest model performance) among model simulation scenarios between 2014 and 2021. Scenarios included varying intrinsic growth rates (r) from 0.25 to 1.5, and both non-random (solid lines) and random (dashed lines) individual movement types. Colored points and lines indicate the modeled influence of the maximum number of human-mediated movements per year.
Figure 7
Figure 7
Maps showing observed spotted lanternfly occurrence by year (red polygons) between 2016 and 2021 and model-predicted cells (blue) where spotted lanternflies were predicted to occur with ≥ 0.95 probability. Model-predicted estimates were obtained from the scenario with an intrinsic growth rate of 1.5 and where the movement type of individuals was non-random. Compared are the model scenarios with varying maximum number of human-mediated movements per year including 0, 3, 5, 7, and 10. The small multiple maps were produced using the ‘ggplot2’ (ver. 3.3.6; https://cran.r-project.org/web/packages/ggplot2/index.html) and ‘ggmap’ (ver. 3.0.0.903; ver. 3.0.0.903; https://cran.r-project.org/web/packages/ggmap/index.html) packages in R.

References

    1. Simberloff D, Keller RP, Cadotte MW, Sandiford G, editors. Invasive Species in a Globalized World. University of Chicago Press; 2015.
    1. Gippet JM, Liebhold AM, Fenn-Moltu G, Bertelsmeier C. Human-mediated dispersal in insects. Curr. Opin. Insect Sci. 2019;35:96–102. doi: 10.1016/j.cois.2019.07.005. - DOI - PubMed
    1. Hall CM. Handbook of Globalisation and Tourism. Edward Elgar Publishing; 2019. Biological invasion, biosecurity, tourism, and globalisation.
    1. Bertelsmeier C. Globalization and the anthropogenic spread of invasive social insects. Curr. Opin. Insect Sci. 2021 doi: 10.1016/j.cois.2021.01.006. - DOI - PubMed
    1. Simberloff D. How common are invasion-induced ecosystem impacts? Biol. Invasions. 2011;13:1255–1268. doi: 10.1007/s10530-011-9956-3. - DOI

Supplementary concepts