. 2023 Jan 19;14(1):320.
doi: 10.1038/s41467-023-36040-y.

Sex-specificity of the C. elegans metabolome

Affiliations

Sex-specificity of the C. elegans metabolome

Russell N Burkhardt et al. Nat Commun. .

Abstract

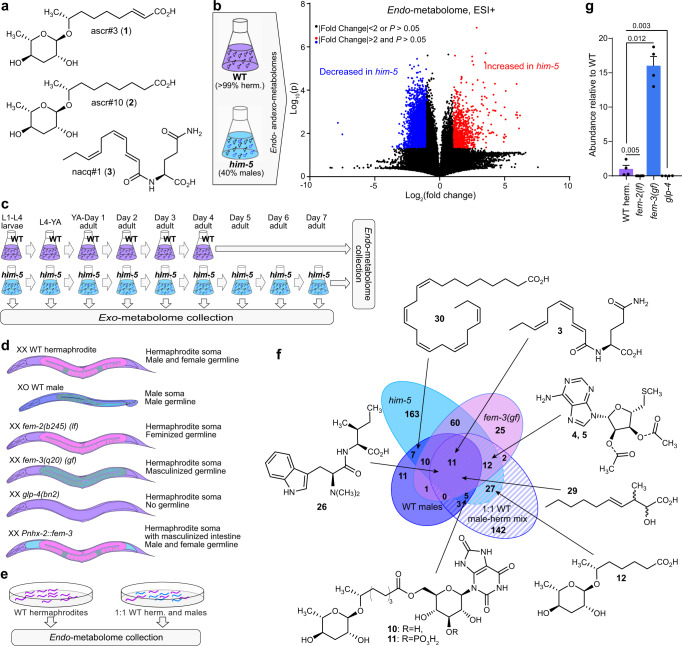
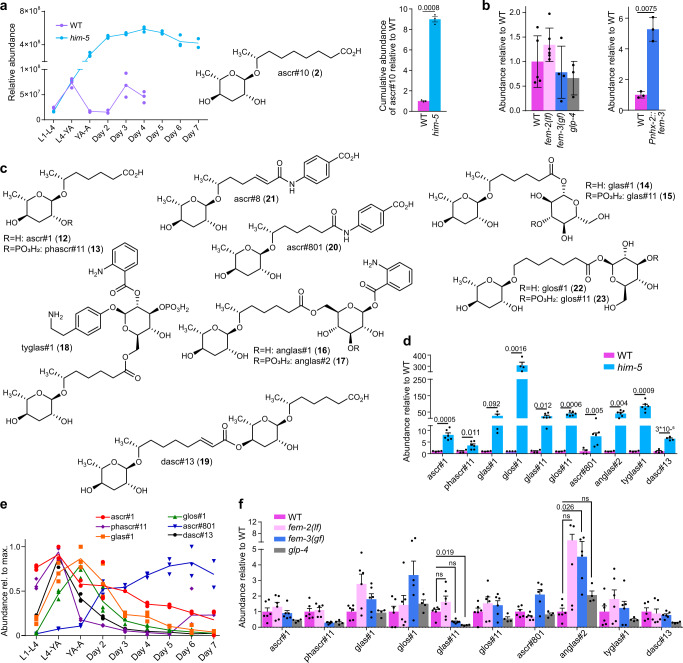
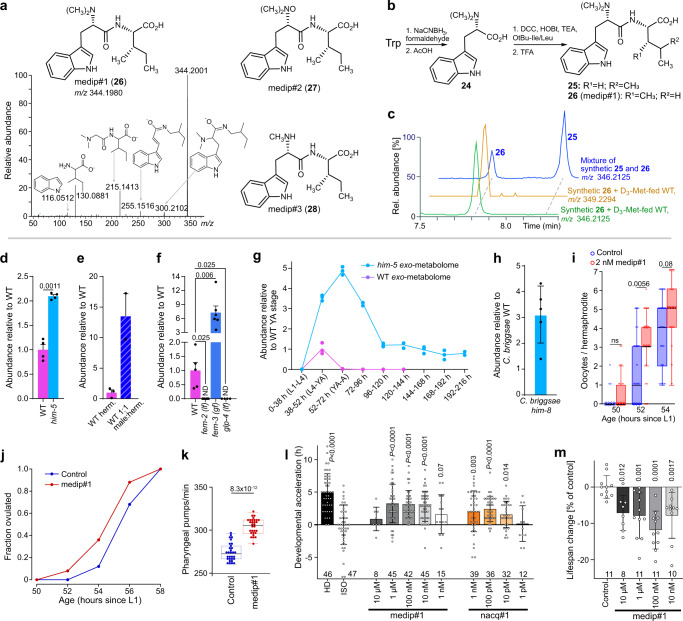
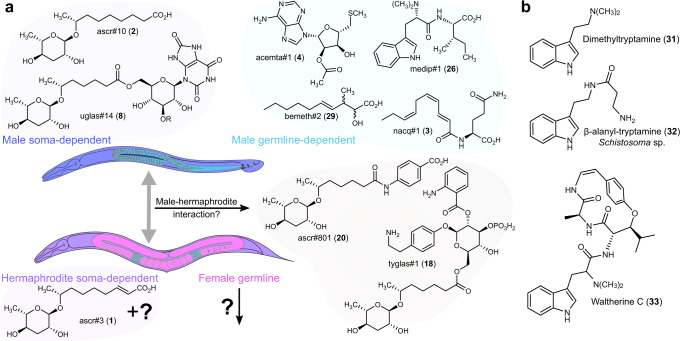
Recent studies of animal metabolism have revealed large numbers of novel metabolites that are involved in all aspects of organismal biology, but it is unclear to what extent metabolomes differ between sexes. Here, using untargeted comparative metabolomics for the analysis of wildtype animals and sex determination mutants, we show that C. elegans hermaphrodites and males exhibit pervasive metabolomic differences. Several hundred small molecules are produced exclusively or in much larger amounts in one sex, including a host of previously unreported metabolites that incorporate building blocks from nucleoside, carbohydrate, lipid, and amino acid metabolism. A subset of male-enriched metabolites is specifically associated with the presence of a male germline, whereas enrichment of other compounds requires a male soma. Further, we show that one of the male germline-dependent metabolites, an unusual dipeptide incorporating N,N-dimethyltryptophan, increases food consumption, reduces lifespan, and accelerates the last stage of larval development in hermaphrodites. Our results serve as a foundation for mechanistic studies of how the genetic sex of soma and germline shape the C. elegans metabolome and provide a blueprint for the discovery of sex-dependent metabolites in other animals.


Conflict of interest statement

F.C.S. is a cofounder of Ascribe Bioscience Inc. and of Holoclara Inc. The remaining authors declare no competing interests.

Figures

Fig. 1
Fig. 1. Metabolomic profiling of male C. elegans.
a Previously characterized sex-biased metabolites in C. elegans. Whereas ascr#3 (1) is more abundant in hermaphrodites, ascr#10 (2) and nacq#1 (3) are more abundant in males. b Comparison of the metabolomes of WT and male-enriched him-5(e1490) mutants. The volcano plot shows the subset of features detected by HPLC-HRMS in positive ionization mode (ESI +), highlighting features increased (red) or decreased (blue) in him-5 relative to WT endo-metabolome extracts. P values were calculated via unpaired two-sided t tests; see “Metaboseek analysis”, for details. c Experimental setup for monitoring metabolism of WT and him-5 animals with periodic harvesting of the exo-metabolome; YA young adults. d Simplified body plans of WT hermaphrodites and WT males as well as germline-feminized fem-2(b245) (lf), germline-masculinized fem-3(q20) (gf), germline-deficient glp-4(bn2), and intestinally masculinized Pnhx-2::fem-3 mutants. Tissues are color-coded according to sex; hermaphrodite soma (dark purple), male soma (dark blue); female germline pink), male germline (blue) with sperm (olive dots), and male intestine (light blue). Reprinted from ref. with permission from Elsevier. e Schematic of hermaphrodite and male-enriched WT animals grown on plates for metabolomics. f Venn Diagram of male-enriched metabolites detected from him-5 mutants, fem-3(gf) mutants, 1:1 mixtures of WT males and hermaphrodites, and hand-picked WT males. g Abundance of nacq#1 (3) in exo-metabolome extracts of germline mutants relative to WT hermaphrodites. Data represent four or six biologically independent experiments, and error bars represent mean ± s.e.m. P values were calculated using the log10-transformed raw data and two-sided Welch t tests. Source data are provided as a Source Data file.
Fig. 2
Fig. 2. Nucleoside-derived metabolites are enriched in males.
a MS2 fragmentation of acemta#2 (5) in positive (ESI +) ionization mode. b Abundance of acemta#2 in endo-metabolome extracts of fem-2(lf), fem-3(gf), and glp-4 mutants relative to WT. Data represent four or six biologically independent experiments, and error bars represent mean ± s.e.m. P values were calculated using the log10-transformed raw data and two-sided Welch t tests. c Comparison of acemta#2 levels in hand-picked WT males and hand-picked WT hermaphrodites. Data represent two biologically independent experiments, and error bars represent mean ± s.e.m. d Comparison of acemta#2 levels in young adults and old (day 7) him-5 adults. Data represent two (day-7 adults) and four (young adults) biologically independent experiments, and error bars represent mean ± s.e.m. e Structures and sex-specificity of uric acid glucoside derivatives incorporating the 7-carbon sidechain ascaroside, ascr#1 (12). Shown are ion chromatograms obtained in ESI- ionization mode of WT and him-5 endo-metabolome samples. f Additional male-enriched uric acid glucoside derivatives, uglas#104 (10) and uglas#105 (11), incorporating a 9-carbon sidechain ascaroside, ascr#10 (2). g Abundances of uric acid glucoside-containing ascarosides (uglas#) in endo-metabolome extracts of (g) him-5 (light blue) relative to WT (purple), h WT males (dark blue) and him-5 males (blue cross-hatched) relative to WT hermaphrodites (purple), i germline mutants fem-2(lf) (light pink), fem-3 (gf) (blue), and glp-4 (gray) relative to WT (purple), and j intestinally masculinized animals (blue) relative to WT hermaphrodites (purple). Bars in g–j represent mean ± s.e.m. with four to six (g, i) and two (h, j) independent biological replicates. P values were calculated via two-sided Welch t tests with Holm–Šídák correction; ns, not significant. Source data are provided as a Source Data file.
Fig. 3
Fig. 3. Enrichment of ascr#10 and ascr#1 derivatives in males.
a Developmental stage-dependent production of ascr#10 (2) in WT (purple) and him-5 (light blue) exo-metabolome extracts (left) and cumulative production of ascr#10 by WT and him-5 from the L1 larval stage through day 4 of adulthood (right). Data represent two or three biologically independent experiments, and error bars represent mean ± s.e.m. P values were calculated via two-sided Welch t tests. b Abundance of ascr#10 in germline mutants (left) and intestinally masculinized Pnhx-2::fem-3 animals (right) relative to WT. Data represent three to six biologically independent experiments, and error bars represent mean ± s.e.m. P values were calculated via two-sided Welch t tests. c, d Chemical structures (c) and relative abundances (d) of male-enriched C7-sidechain ascaroside derivatives in extracts of the exo- (ascr#1, phascr#11, glas#1, glos#1, ascr#801, and dasc#13) and endo-metabolomes (glas#11, glos#11, anglas#2, and tyglas#1) of WT (purple) and him-5 (light blue) animals. e Developmental stage-dependent production of ascaroside-derived metabolites shown in (c) in him-5 animals. Data represent three independent biological replicates, except for two independent biological replicates for day 7. f Abundances of C7-sidechain ascaroside derivatives in extracts of germline mutants fem-2(lf) (light pink), fem-3 (gf) (blue), and glp-4 (gray) relative to WT (purple). d, f Data represent four or six biologically independent experiments, and error bars represent mean ±  s.e.m. P values were calculated by unpaired, two-sided Welch t test with Holm–Šídák correction; ns not significant. Source data are provided as a Source Data file.
Fig. 4
Fig. 4. Identification, germline dependence, and biological activity of dipeptide medip#1.
a Chemical structures of medip#1–3 (2628) and MS2 fragmentation of medip#1 (26) in ESI- mode. b Synthesis of medip#1 and related molecules. c Ion chromatograms for m/z 346.2125 and 349.2294, corresponding to medip#1 and D3-medip#1, from exo-metabolome extracts of him-5 animals supplemented with D3-Met and a synthetic sample containing medip#1 (26) and its Leu-derived isomer (25). d, f Abundance of medip#1 in exo-metabolome extracts of (d) him-5 relative to WT, e 1:1 male:hermaphrodite mixtures relative to WT hermaphrodites, and f indicated germline mutants relative to WT. Data represent four (d), two (e), and four or six (f) biologically independent experiments, and error bars represent mean ± s.e.m. P values were calculated by two-sided Welch t tests; ND, not detected. g Developmental stage-dependent production of medip#1 in WT (purple) and him-5 (light blue) animals. Data are from three independent biological replicates, except for two independent biological replicates for day 7. h Abundance of medip#1 in the exo-metabolome of male-enriched C. briggsae him-8 mutants relative to WT C. briggsae. Data represent five biologically independent experiments. i Faster acquisition of oocytes in hermaphrodites exposed to 2 nM of medip#1 (red) compared to paired controls (blue). Boxes represent the two inner quartiles, horizontal lines represent medians, and whiskers extend to 1.5× of the box data. Data represent one experiment with n = 25 animals for each condition; P values were calculated by Kolmogorov–Smirnov test. j Hermaphrodites exposed to 2 nM of medip#1 (red) ovulate earlier than controls (blue). Data represent one experiment with n = 25 animals for each condition. The differences at 54 h and 56 h are significant (P = 1.7 × 10−3 and P = 7 × 10−3, respectively, as calculated using binomial test). k Faster pharyngeal pumping in hermaphrodites treated with 2 nM of medip#1 (red) than in untreated controls (blue). Boxes represent the two inner quartiles, horizontal lines represent medians, and whiskers extend to 1.5× of the box data. Data represent one experiment with n = 30 animals for each condition; P value was calculated by Kolmogorov–Smirnov test. l Timepoint of first egg-laying of isolated worms on different concentrations of medip#1 and nacq#1 compared to untreated isolated worms (ISO, control) and grouped worms (high density, HD). Data represent four biologically independent experiments, except for 10 µM medip#1 and 1 pM nacq#1 (one experiment), and 10 pM nacq#1 (three experiments), with the total number of animals used for each condition indicated above the x axis. P values were calculated by two-sided Welch t test, comparing indicated conditions with ISO control. m Mean lifespan of medip#1-treated WT animals compared to untreated control. Data represent three to four biologically independent experiments, each using 15–20 animals per plate; the total number of plates used for each condition is indicated above the x axis. P values were calculated by two-sided t test, comparing indicated conditions with untreated control. Source data are provided as a Source Data file.
Fig. 5
Fig. 5. Tissue-specific origin of sex-specific metabolites and related compounds from other natural sources.
a Soma- and germline dependence of selected male- and hermaphrodite-enriched metabolites. Reprinted from ref. with permission from Elsevier. b Chemical structures of N,N-dimethyltryptamine, and N,N-dimethyltryptophan derivatives from other animals and plants.

References

    1. Verri Hernandes V, et al. Age, sex, body mass index, diet and menopause related metabolites in a large homogeneous alpine cohort. Metabolites. 2022;12:205. doi: 10.3390/metabo12030205. - DOI - PMC - PubMed
    1. Wörheide MA, Krumsiek J, Kastenmüller G, Arnold M. Multi-omics integration in biomedical research—a metabolomics-centric review. Analytica Chim. Acta. 2021;1141:144–162. doi: 10.1016/j.aca.2020.10.038. - DOI - PMC - PubMed
    1. Murray A, Tharmalingam S, Nguyen P, Tai TC. Untargeted metabolomics reveals sex-specific differences in lipid metabolism of adult rats exposed to dexamethasone in utero. Sci. Rep. 2021;11:20342. doi: 10.1038/s41598-021-99598-x. - DOI - PMC - PubMed
    1. Petr MA, et al. A cross-sectional study of functional and metabolic changes during aging through the lifespan in male mice. eLife. 2021;10:e62952. doi: 10.7554/eLife.62952. - DOI - PMC - PubMed
    1. Murfitt SA, et al. Metabolomics and lipidomics study of mouse models of type 1 diabetes highlights divergent metabolism in purine and tryptophan metabolism prior to disease onset. J. Proteome Res. 2018;17:946–960. doi: 10.1021/acs.jproteome.7b00489. - DOI - PubMed

Publication types

Substances