. 2023 Jan 19;13(1):1038.
doi: 10.1038/s41598-022-26367-9.

Video-based formative and summative assessment of surgical tasks using deep learning

Affiliations

Video-based formative and summative assessment of surgical tasks using deep learning

Erim Yanik et al. Sci Rep. .

Abstract

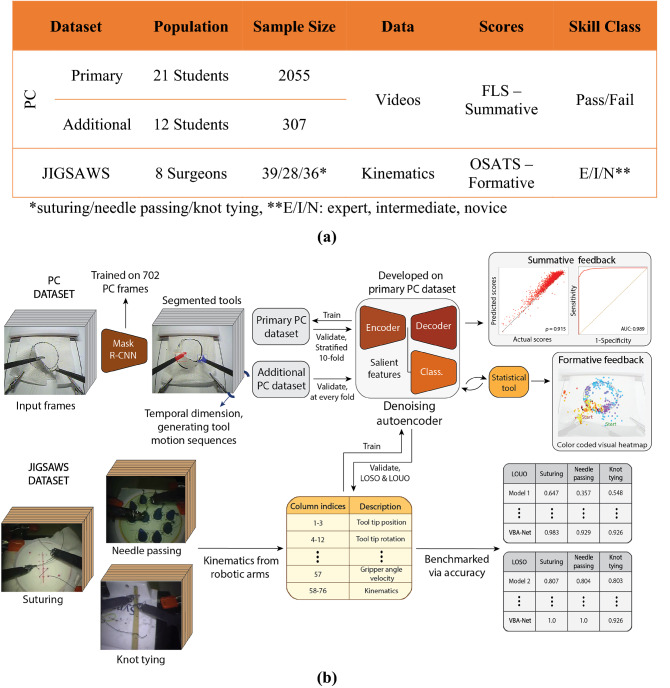
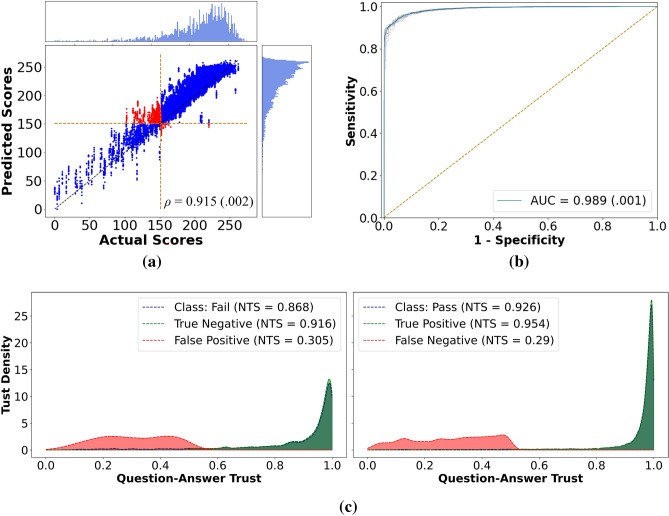
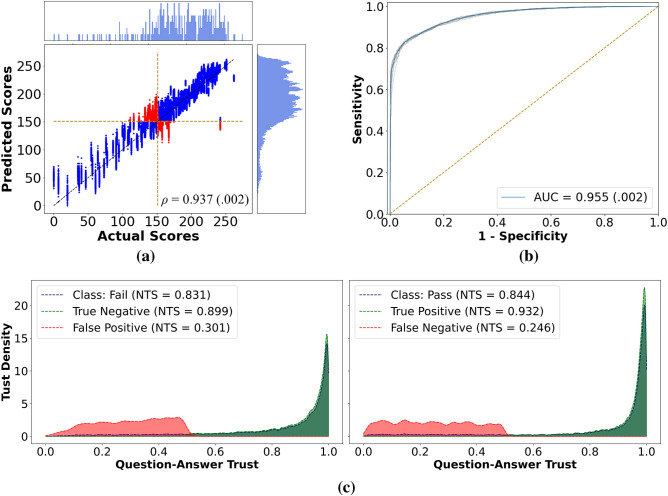
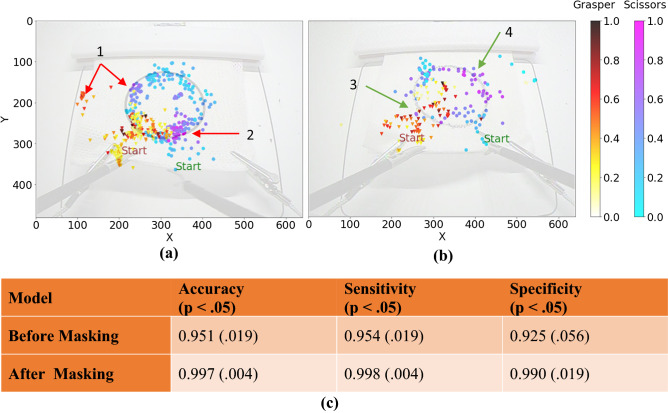
To ensure satisfactory clinical outcomes, surgical skill assessment must be objective, time-efficient, and preferentially automated-none of which is currently achievable. Video-based assessment (VBA) is being deployed in intraoperative and simulation settings to evaluate technical skill execution. However, VBA is manual, time-intensive, and prone to subjective interpretation and poor inter-rater reliability. Herein, we propose a deep learning (DL) model that can automatically and objectively provide a high-stakes summative assessment of surgical skill execution based on video feeds and low-stakes formative assessment to guide surgical skill acquisition. Formative assessment is generated using heatmaps of visual features that correlate with surgical performance. Hence, the DL model paves the way for the quantitative and reproducible evaluation of surgical tasks from videos with the potential for broad dissemination in surgical training, certification, and credentialing.


Conflict of interest statement

The authors declare no competing interests.

Figures

Figure 1
Figure 1
Overview of the study. (a) Subject demographics and descriptive data. (b) The pipeline of the VBA-Net. The model utilizes Mask R-CNN to generate tool motion sequences from video frames. Then denoising autoencoder (DAE) embeds the sequences for the classifier to predict summative and formative performance. The primary PC dataset is used to develop the model, i.e., tune its hyperparameters. The additional PC dataset, on the other hand, is used for validation. The JIGSAWS dataset is utilized to benchmark the model against the high-performing models in the literature.
Figure 2
Figure 2
Results for the primary PC datasets. (a) Actual vs. predicted FLS scores for all ten training sessions combined. Here, the histograms show the frequency of samples for a given score. As seen, the network has a slightly inflated score prediction trend resulting in some trials close to the cut-off ratio to cross it—shown in red. Since classification analysis was conducted separately, this inflated prediction does not affect the pass/fail prediction accuracy. (b) The ROC curves. The blue line is the average of 10 running sessions, each shown in gray. The yellow line represents the random chances. (c) Question–answer trust plots for each class. The VBA-Net has high trustworthiness for true predictions. i.e., Softmax probabilities are close to 1.0 for the majority of the samples, as shown in green. On the other hand, the network is cautious about wrong predictions, i.e., the Softmax probabilities are close to the threshold of 0.5 and do not accumulate on the extreme end of 0.0—illustrated in red.
Figure 3
Figure 3
Results for the additional PC datasets. (a) Actual vs. predicted FLS scores for all ten runs. Here, we did not observe inflated score prediction, as shown in Fig. 2. This may be due to a more balanced representation of the samples. (b) The ROC curves. (c) Question–answer trust plots for each class. We observed the same confident true predictions and cautious wrong predictions trend in this plot compared to Fig. 2c.
Figure 4
Figure 4
CAM results. CAM plots for (a) a TN (FLS score: 16.8) and (b) a TP (FLS score: 170.7) sample. The plots are presented in the original frame size of 640 × 480. Each dot represents the tool location for a timestamp generated at 1 FPS. This resulted in 256 dots for the TN case as the procedure took 256 s and 105 for TP. The red arrows indicate tool motions that may lead to poor performance, while the green arrows indicate smooth behavior. The color-coded heatmaps illustrate the intensities of the same CAM generated for the given samples. However, different color maps are used for scissors and grasper locations. (c) Overall VBA-Net performance comparison before and after masking. Here, p is the p-value of the statistical analysis, and the numbers within the parentheses in the second and third rows represent standard deviation based on tenfolds of training.

References

    1. Birkmeyer JD, et al. Surgical skill and complication rates after bariatric surgery abstract. N. Engl. J. Med. 2013;369:1434–1476. doi: 10.1056/NEJMsa1300625. - DOI - PubMed
    1. McQueen S, McKinnon V, VanderBeek L, McCarthy C, Sonnadara R. Video-based assessment in surgical education: A scoping review. J. Surg. Educ. 2019;76:1645–1654. doi: 10.1016/j.jsurg.2019.05.013. - DOI - PubMed
    1. Pugh CM, Hashimoto DA, Korndorffer JR. The what? How? And Who? Of video based assessment. Am. J. Surg. 2021;221:13–18. doi: 10.1016/j.amjsurg.2020.06.027. - DOI - PubMed
    1. Feldman LS, et al. SAGES video-based assessment (VBA) program: A vision for life-long learning for surgeons. Surg. Endosc. 2020;34:3285–3288. doi: 10.1007/s00464-020-07628-y. - DOI - PubMed
    1. ABS to Explore Video-Based Assessment in Pilot Program Launching June 2021 | American Board of Surgery. https://www.absurgery.org/default.jsp?news_vba04.21. Accessed 18 Feb 2022 (2022).

Publication types