3D osteogenic differentiation of human iPSCs reveals the role of TGFβ signal in the transition from progenitors to osteoblasts and osteoblasts to osteocytes
- PMID: 36658197
- PMCID: PMC9852429
- DOI: 10.1038/s41598-023-27556-w
3D osteogenic differentiation of human iPSCs reveals the role of TGFβ signal in the transition from progenitors to osteoblasts and osteoblasts to osteocytes
Abstract
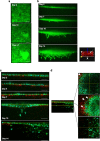
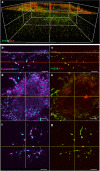
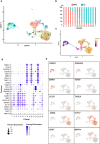
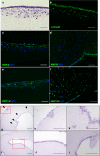
Although the formation of bone-like nodules is regarded as the differentiation process from stem cells to osteogenic cells, including osteoblasts and osteocytes, the precise biological events during nodule formation are unknown. Here we performed the osteogenic induction of human induced pluripotent stem cells using a three-dimensional (3D) culture system using type I collagen gel and a rapid induction method with retinoic acid. Confocal and time-lapse imaging revealed the osteogenic differentiation was initiated with vigorous focal proliferation followed by aggregation, from which cells invaded the gel. Invading cells changed their morphology and expressed osteocyte marker genes, suggesting the transition from osteoblasts to osteocytes. Single-cell RNA sequencing analysis revealed that 3D culture-induced cells with features of periosteal skeletal stem cells, some of which expressed TGFβ-regulated osteoblast-related molecules. The role of TGFβ signal was further analyzed in the transition from osteoblasts to osteocytes, which revealed that modulation of the TGFβ signal changed the morphology and motility of cells isolated from the 3D culture, suggesting that the TGFβ signal maintains the osteoblastic phenotype and the transition into osteocytes requires down-regulation of the TGFβ signal.
© 2023. The Author(s).
Conflict of interest statement
The authors declare no competing interests.
Figures

Similar articles
-
Phenotype and Viability of MLO-Y4 Cells Is Maintained by TGFβ₃ in a Serum-Dependent Manner within a 3D-Co-Culture with MG-63 Cells.Int J Mol Sci. 2018 Jun 30;19(7):1932. doi: 10.3390/ijms19071932. Int J Mol Sci. 2018. PMID: 29966376 Free PMC article.
-
Osteogenic differentiation of mesenchymal stem cells is regulated by osteocyte and osteoblast cells in a simplified bone niche.Eur Cell Mater. 2012 Jan 12;23:13-27. doi: 10.22203/ecm.v023a02. Eur Cell Mater. 2012. PMID: 22241610
-
Primary Human Osteocyte Networks in Pure and Modified Collagen Gels.Tissue Eng Part A. 2019 Oct;25(19-20):1347-1355. doi: 10.1089/ten.TEA.2018.0338. Epub 2019 Jun 14. Tissue Eng Part A. 2019. PMID: 30648477
-
Dynamics of the transition from osteoblast to osteocyte.Ann N Y Acad Sci. 2010 Mar;1192:437-43. doi: 10.1111/j.1749-6632.2009.05246.x. Ann N Y Acad Sci. 2010. PMID: 20392270 Free PMC article. Review.
-
[Bone and Stem Cells. The mechanism of osteogenic differentiation from mesenchymal stem cell].Clin Calcium. 2014 Apr;24(4):501-8. Clin Calcium. 2014. PMID: 24681495 Review. Japanese.
Cited by
-
Emerging Landscape of Osteogenesis Imperfecta Pathogenesis and Therapeutic Approaches.ACS Pharmacol Transl Sci. 2024 Jan 2;7(1):72-96. doi: 10.1021/acsptsci.3c00324. eCollection 2024 Jan 12. ACS Pharmacol Transl Sci. 2024. PMID: 38230285 Free PMC article. Review.
-
TNF receptor-associated factors: promising targets of natural products for the treatment of osteoporosis.Front Physiol. 2025 May 27;16:1527814. doi: 10.3389/fphys.2025.1527814. eCollection 2025. Front Physiol. 2025. PMID: 40496246 Free PMC article. Review.

