. 2023 Feb;25(2):298-308.
doi: 10.1038/s41556-022-01060-1. Epub 2023 Jan 19.

ETV6 dependency in Ewing sarcoma by antagonism of EWS-FLI1-mediated enhancer activation

Affiliations

ETV6 dependency in Ewing sarcoma by antagonism of EWS-FLI1-mediated enhancer activation

Yuan Gao et al. Nat Cell Biol. 2023 Feb.

Abstract

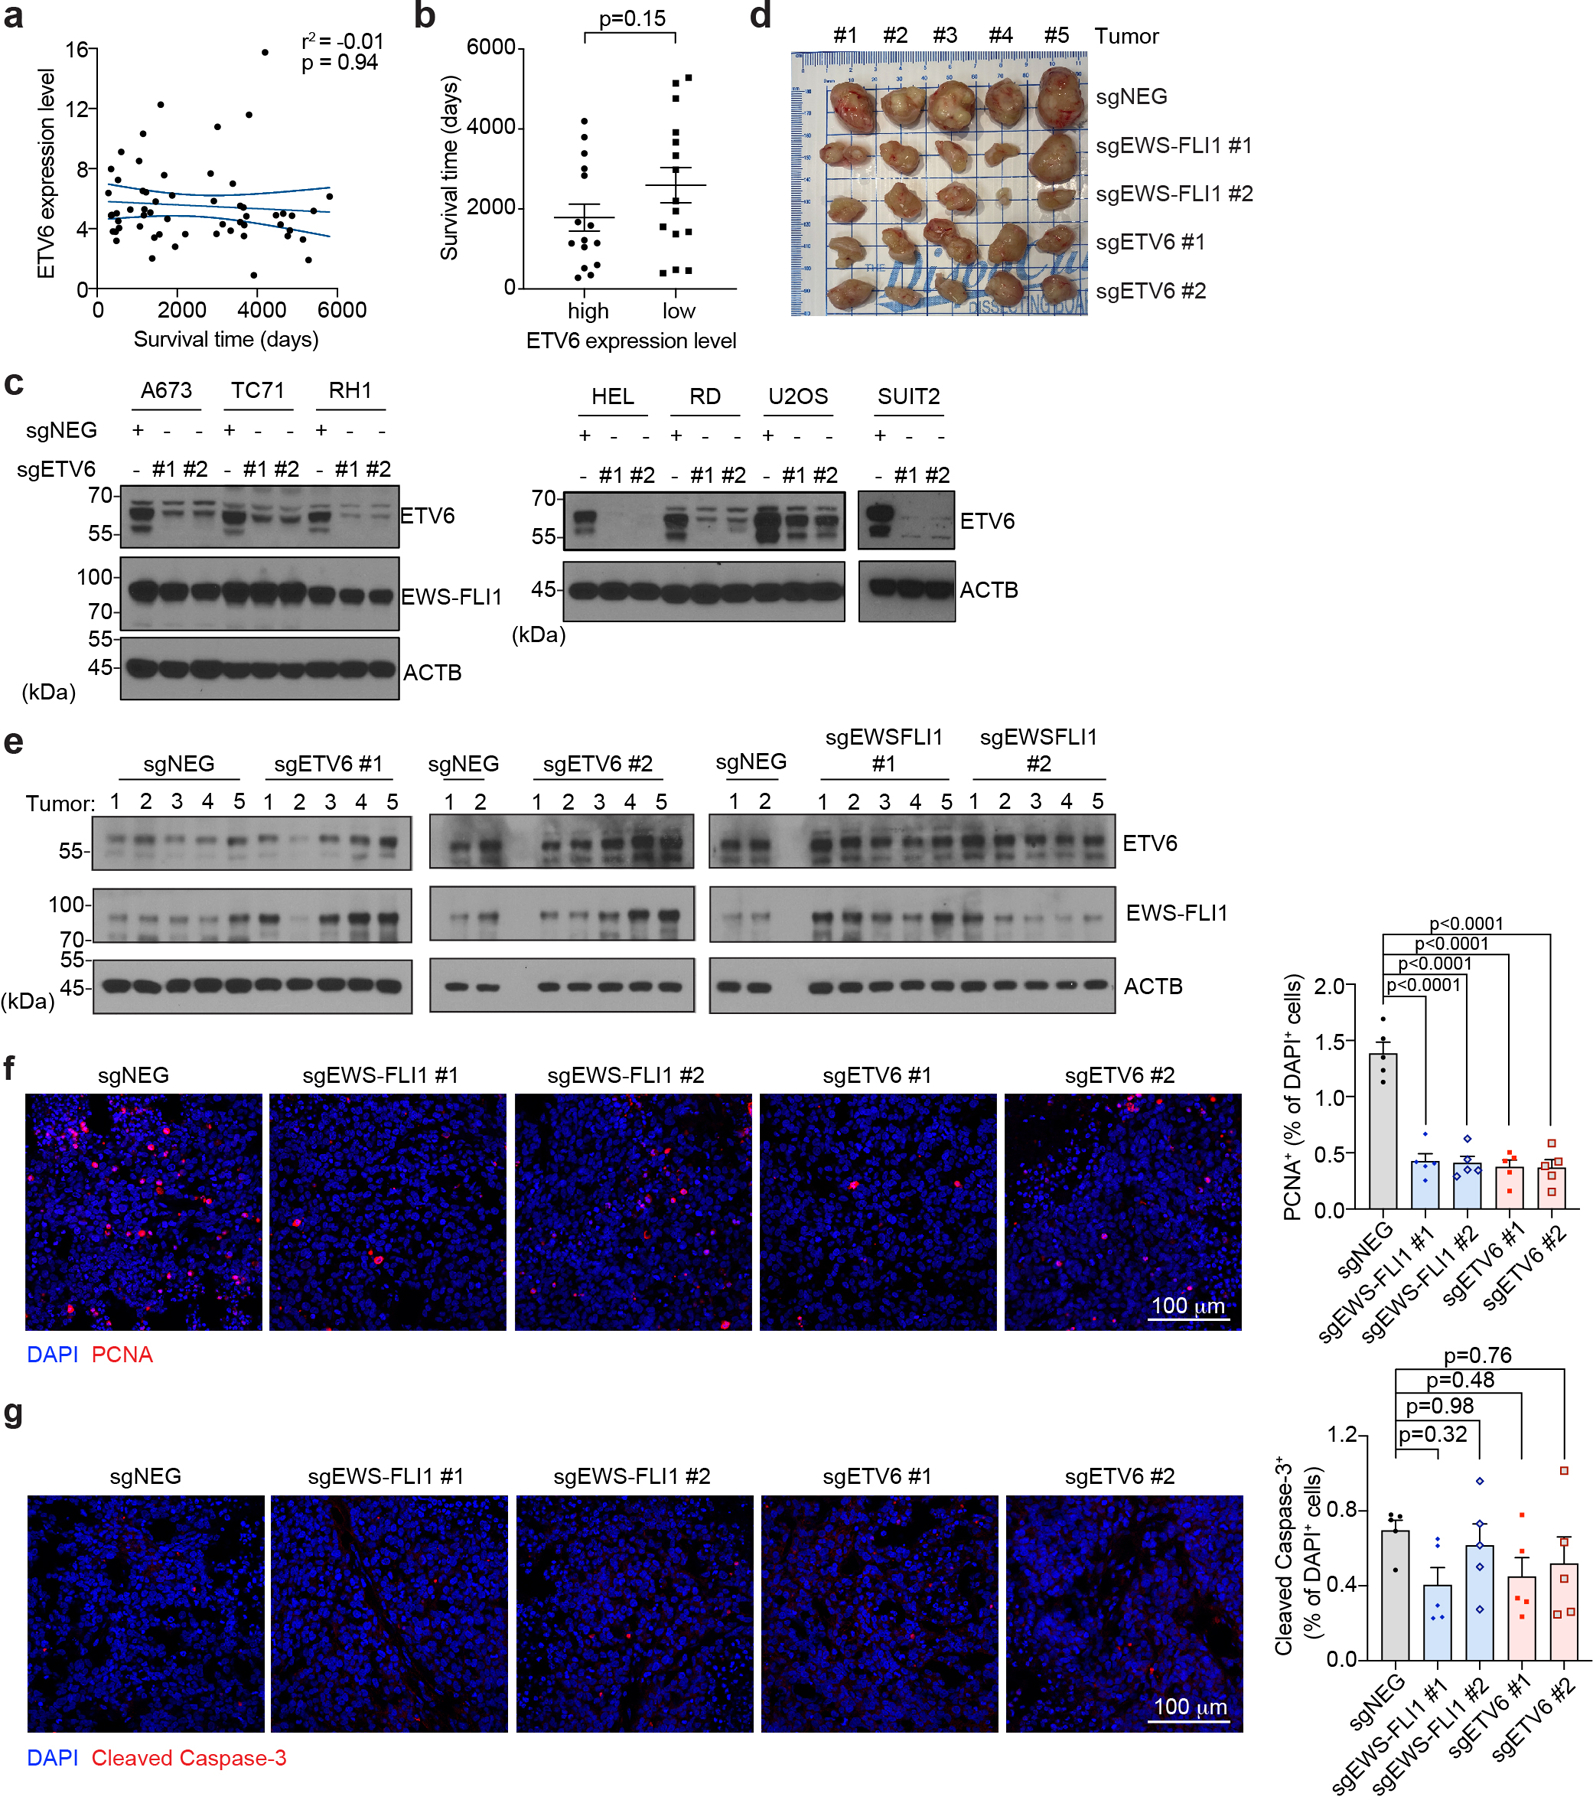
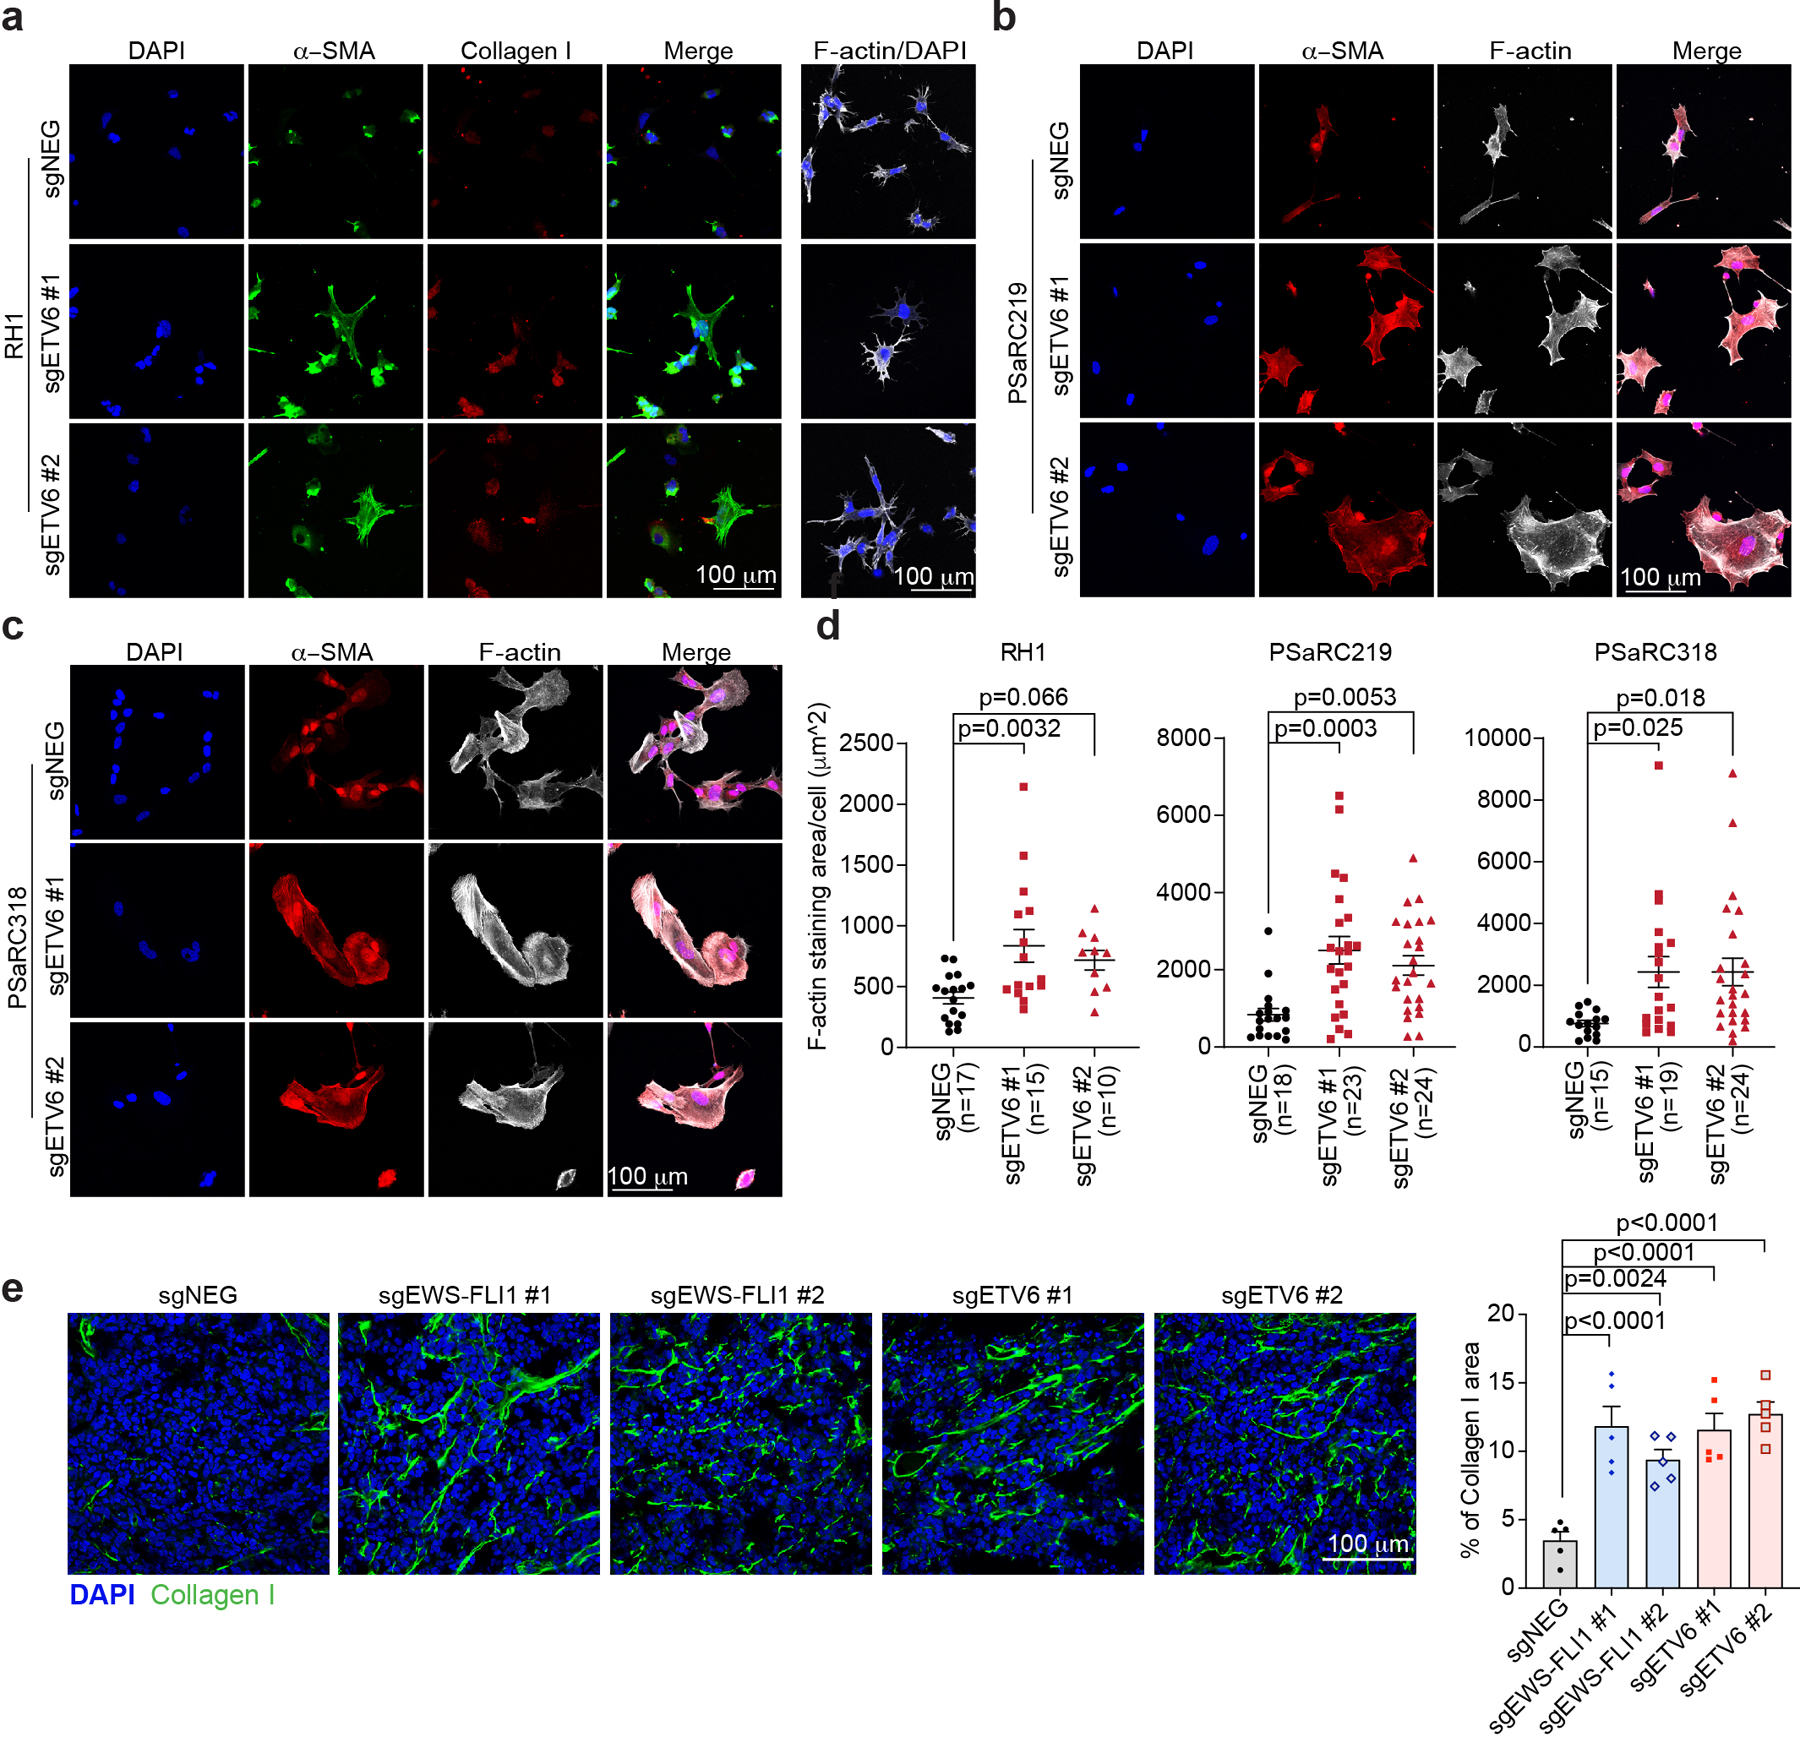
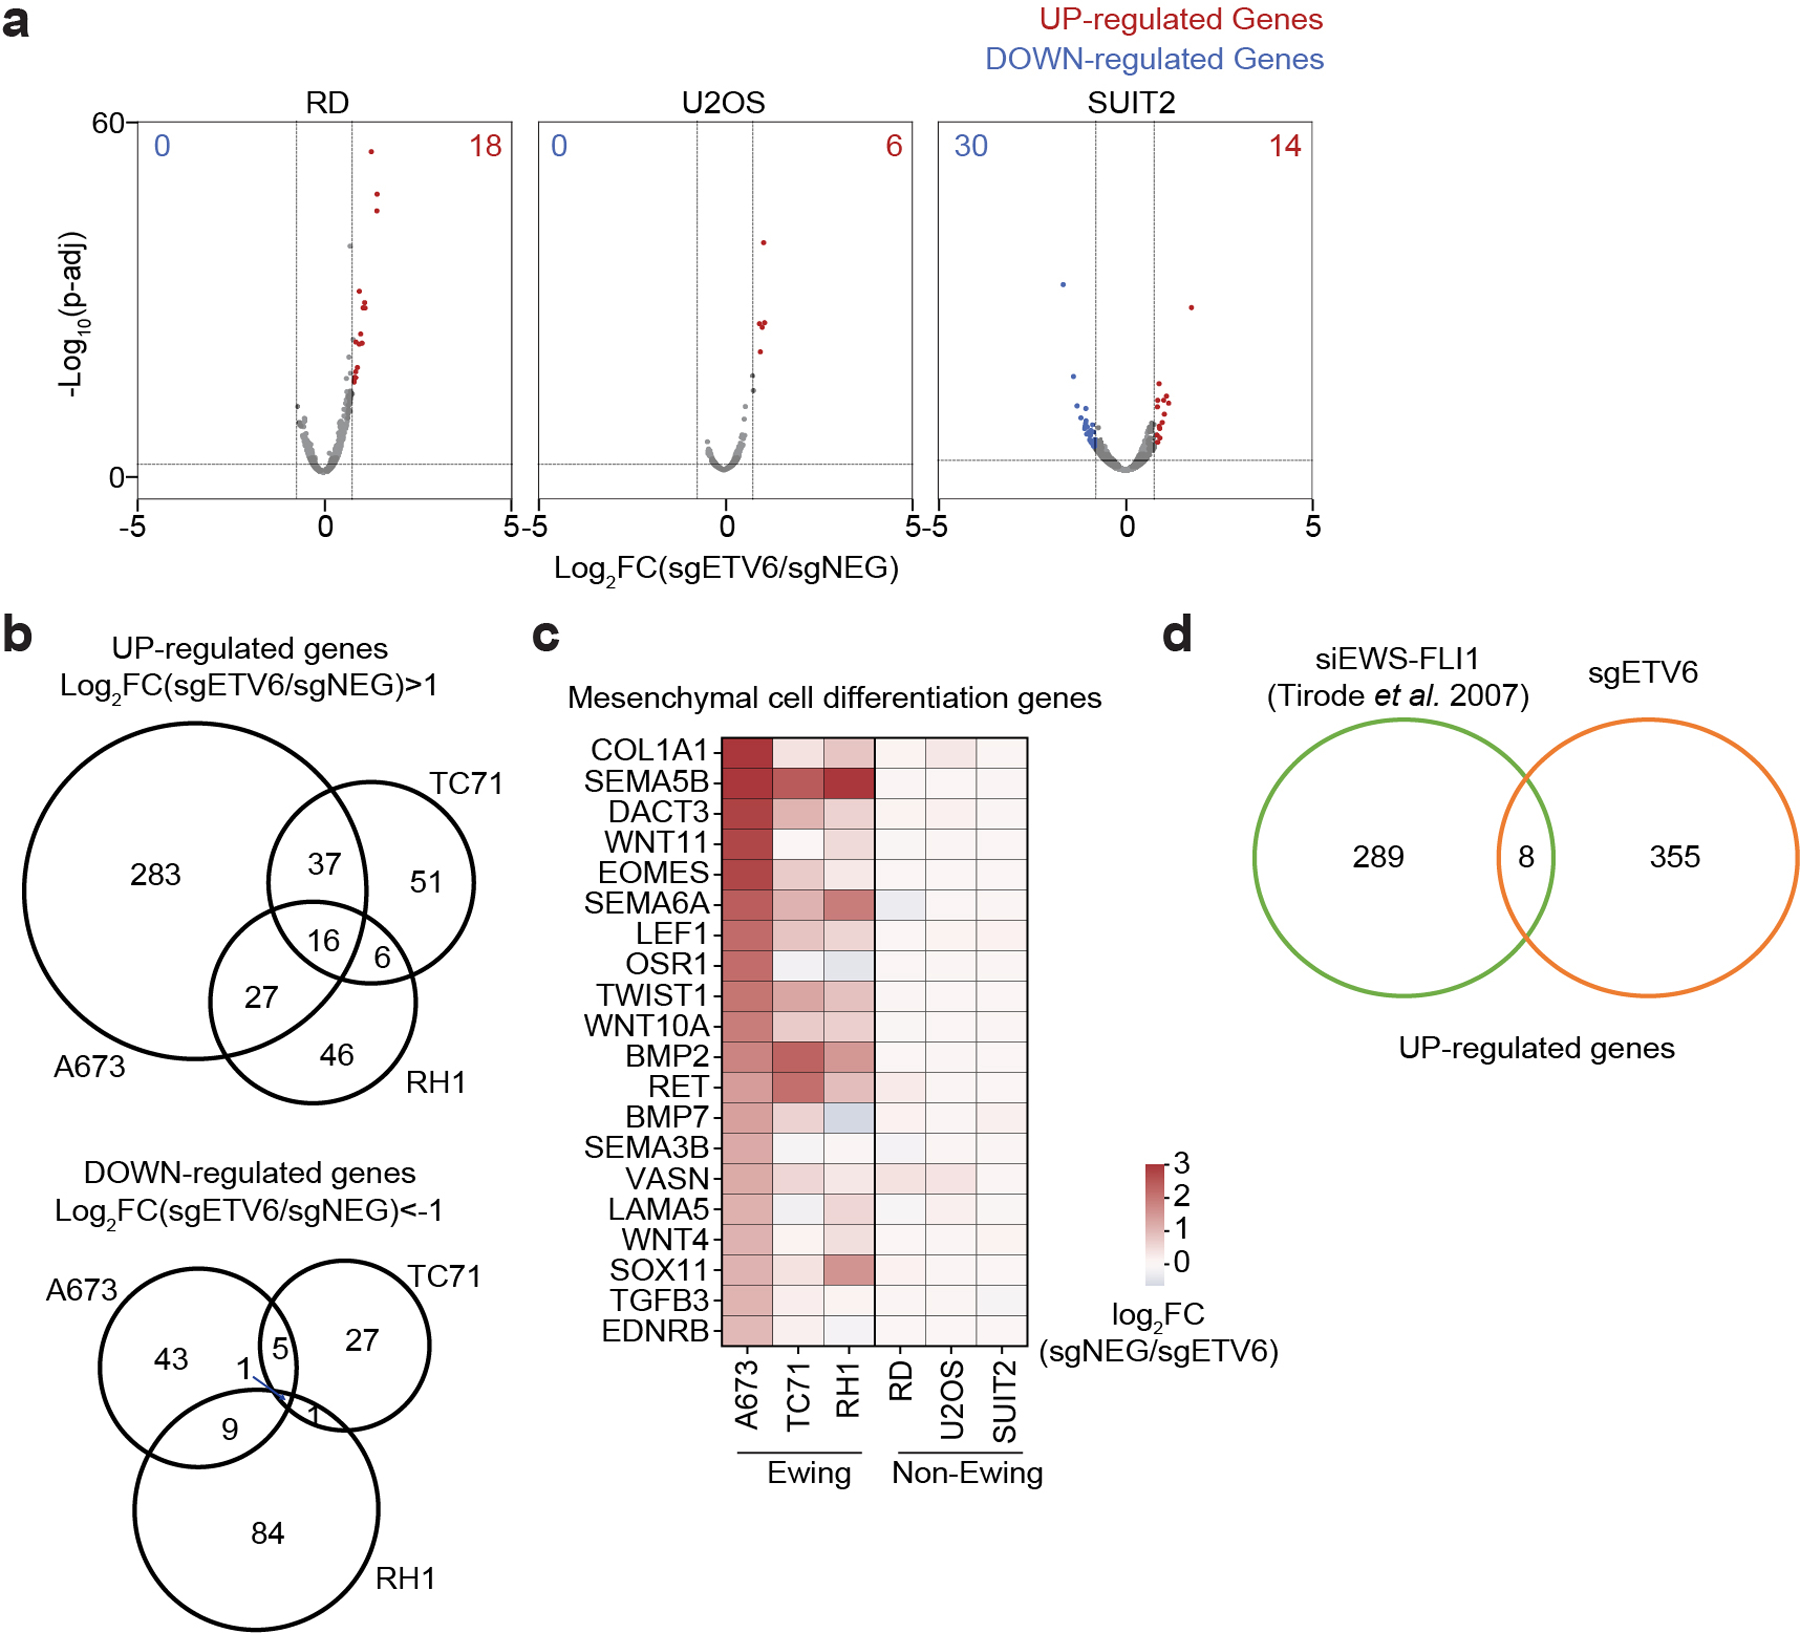
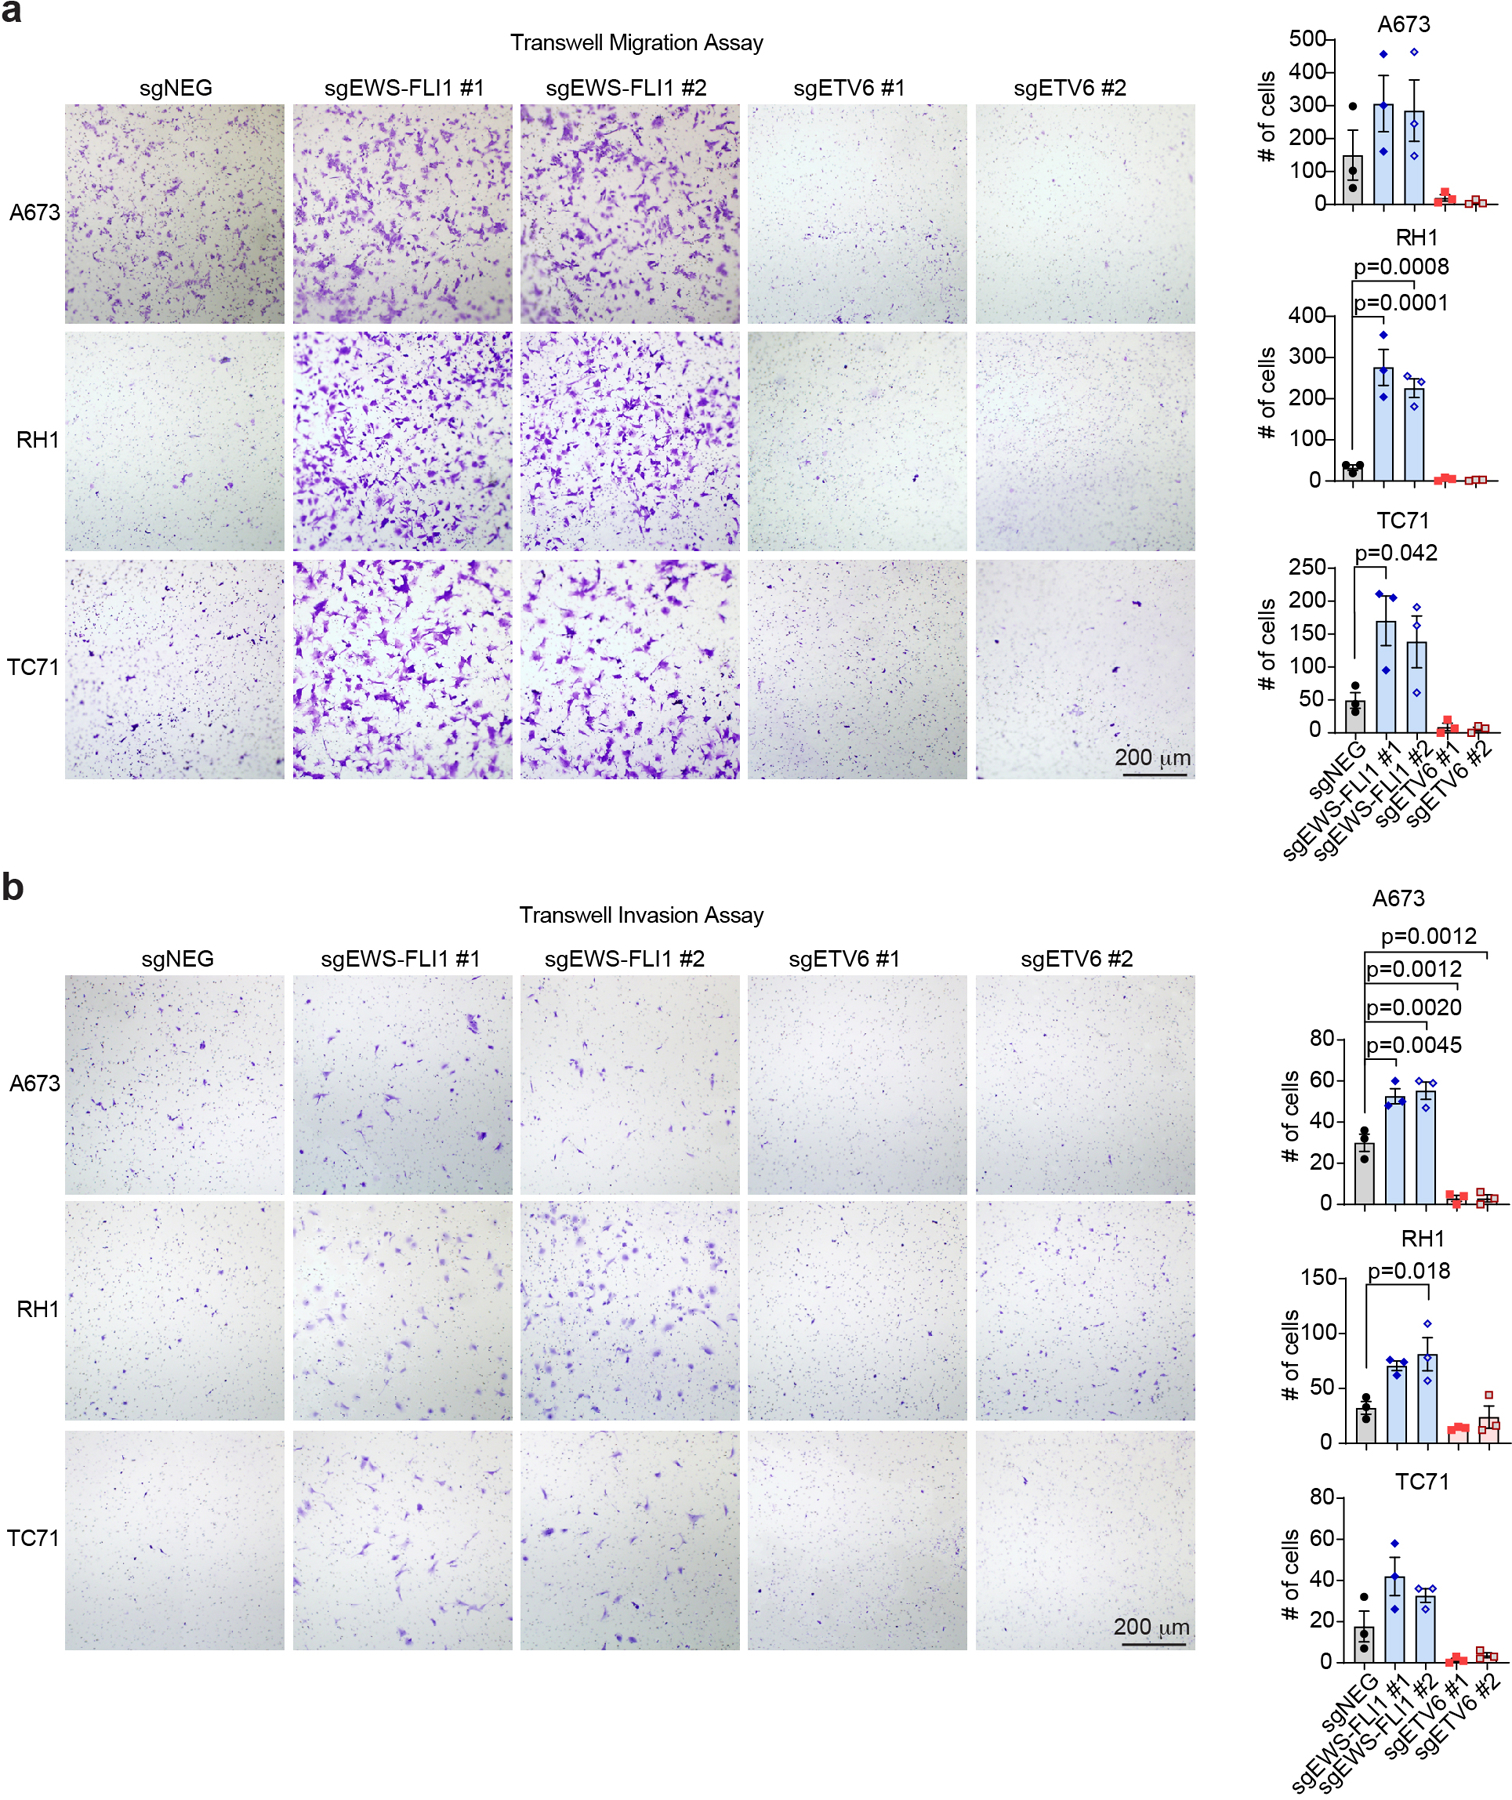
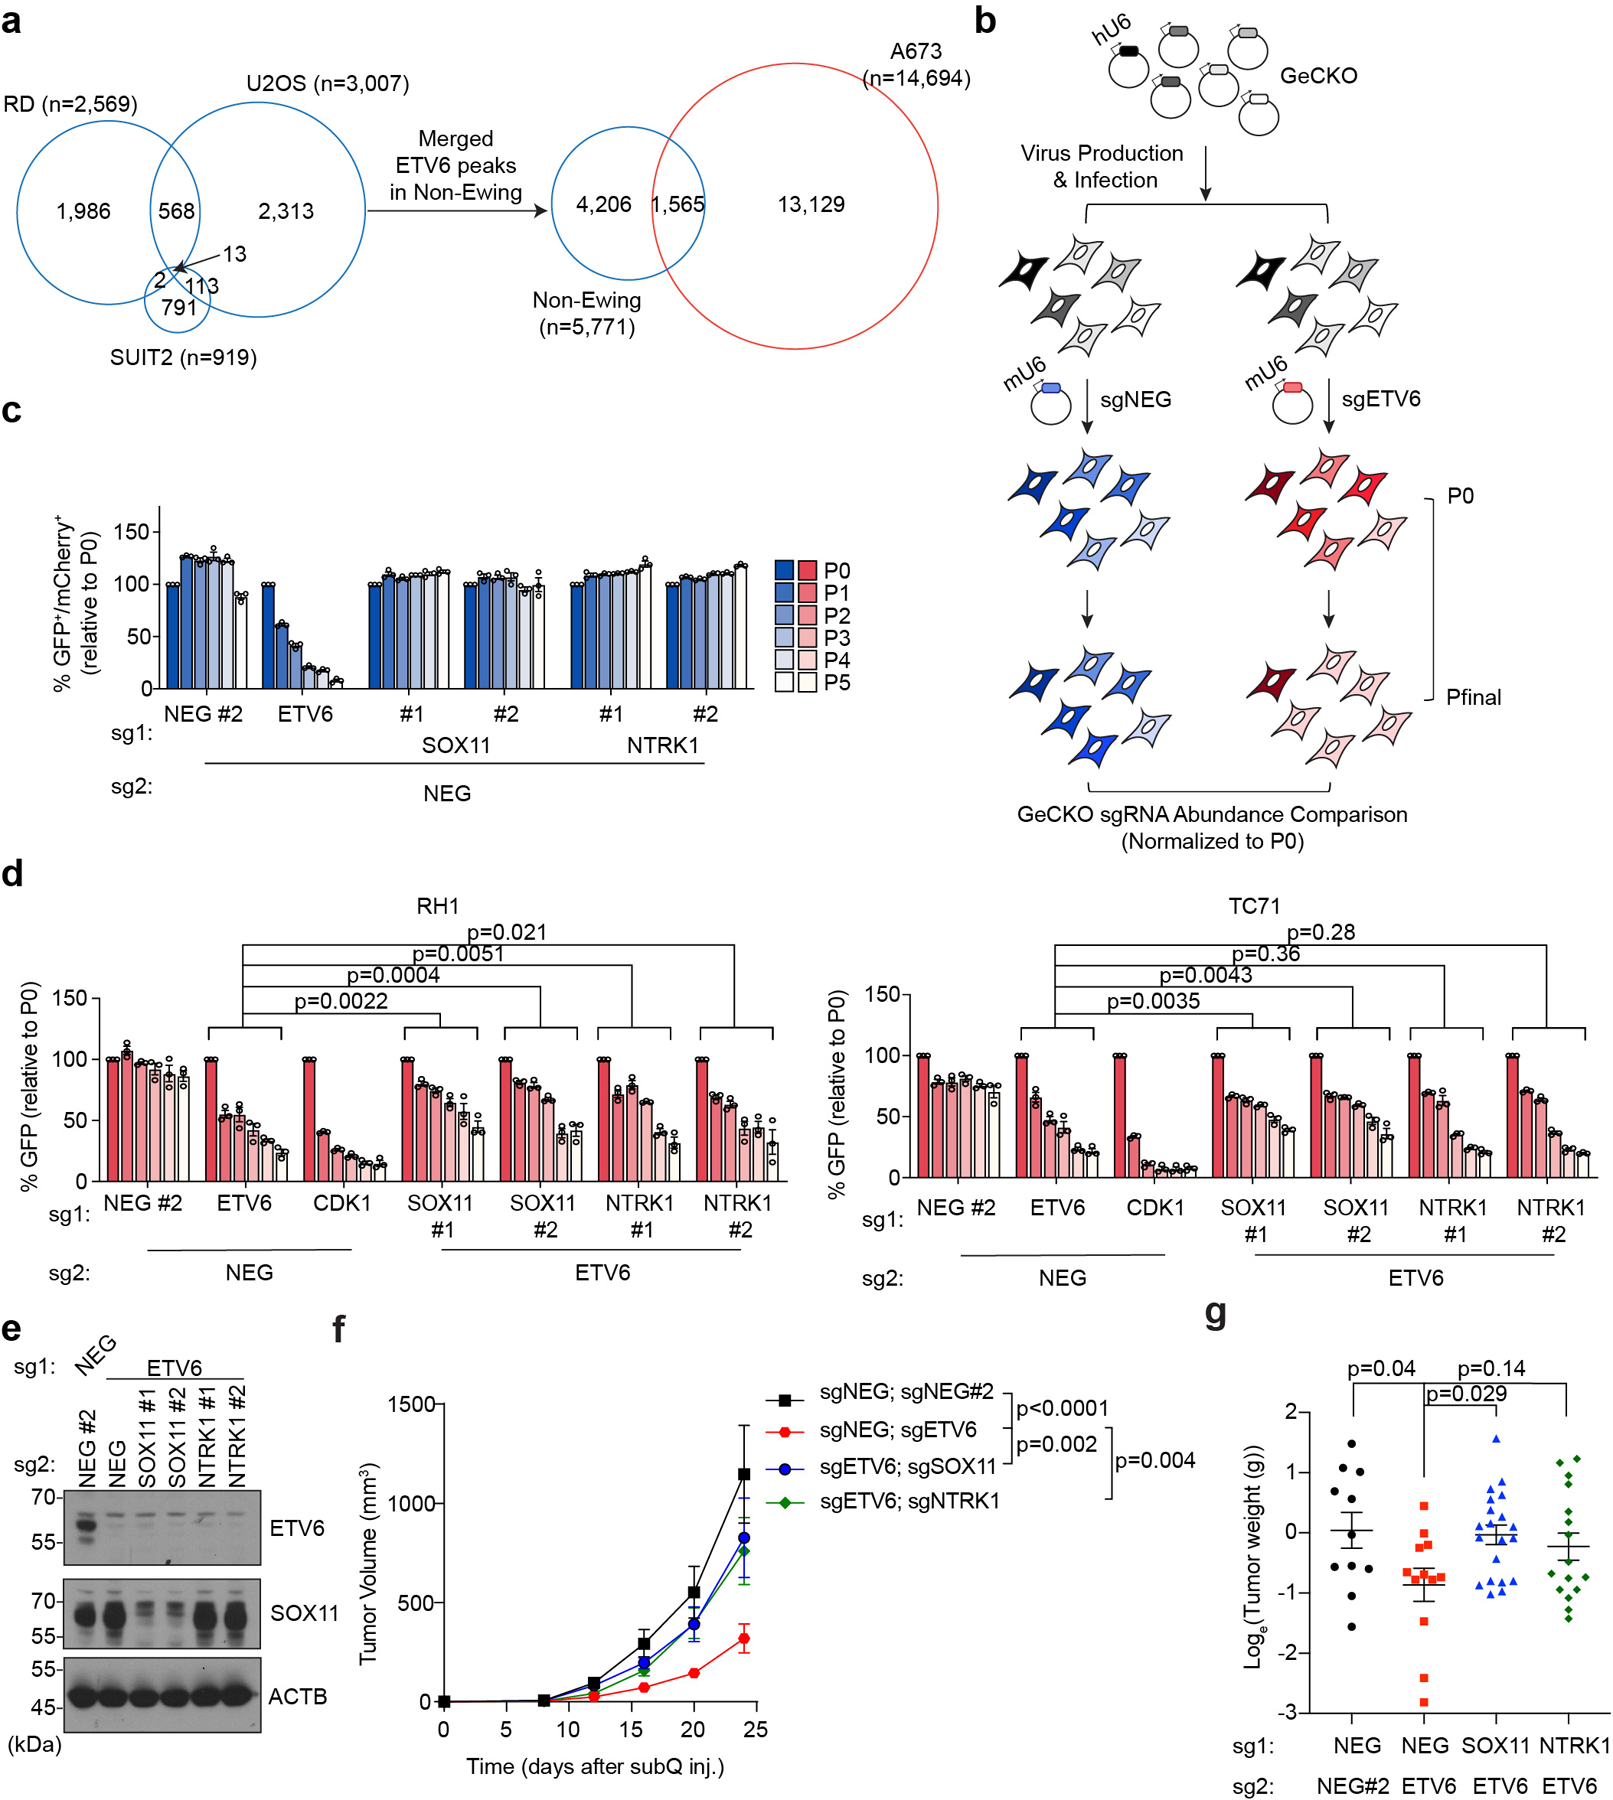
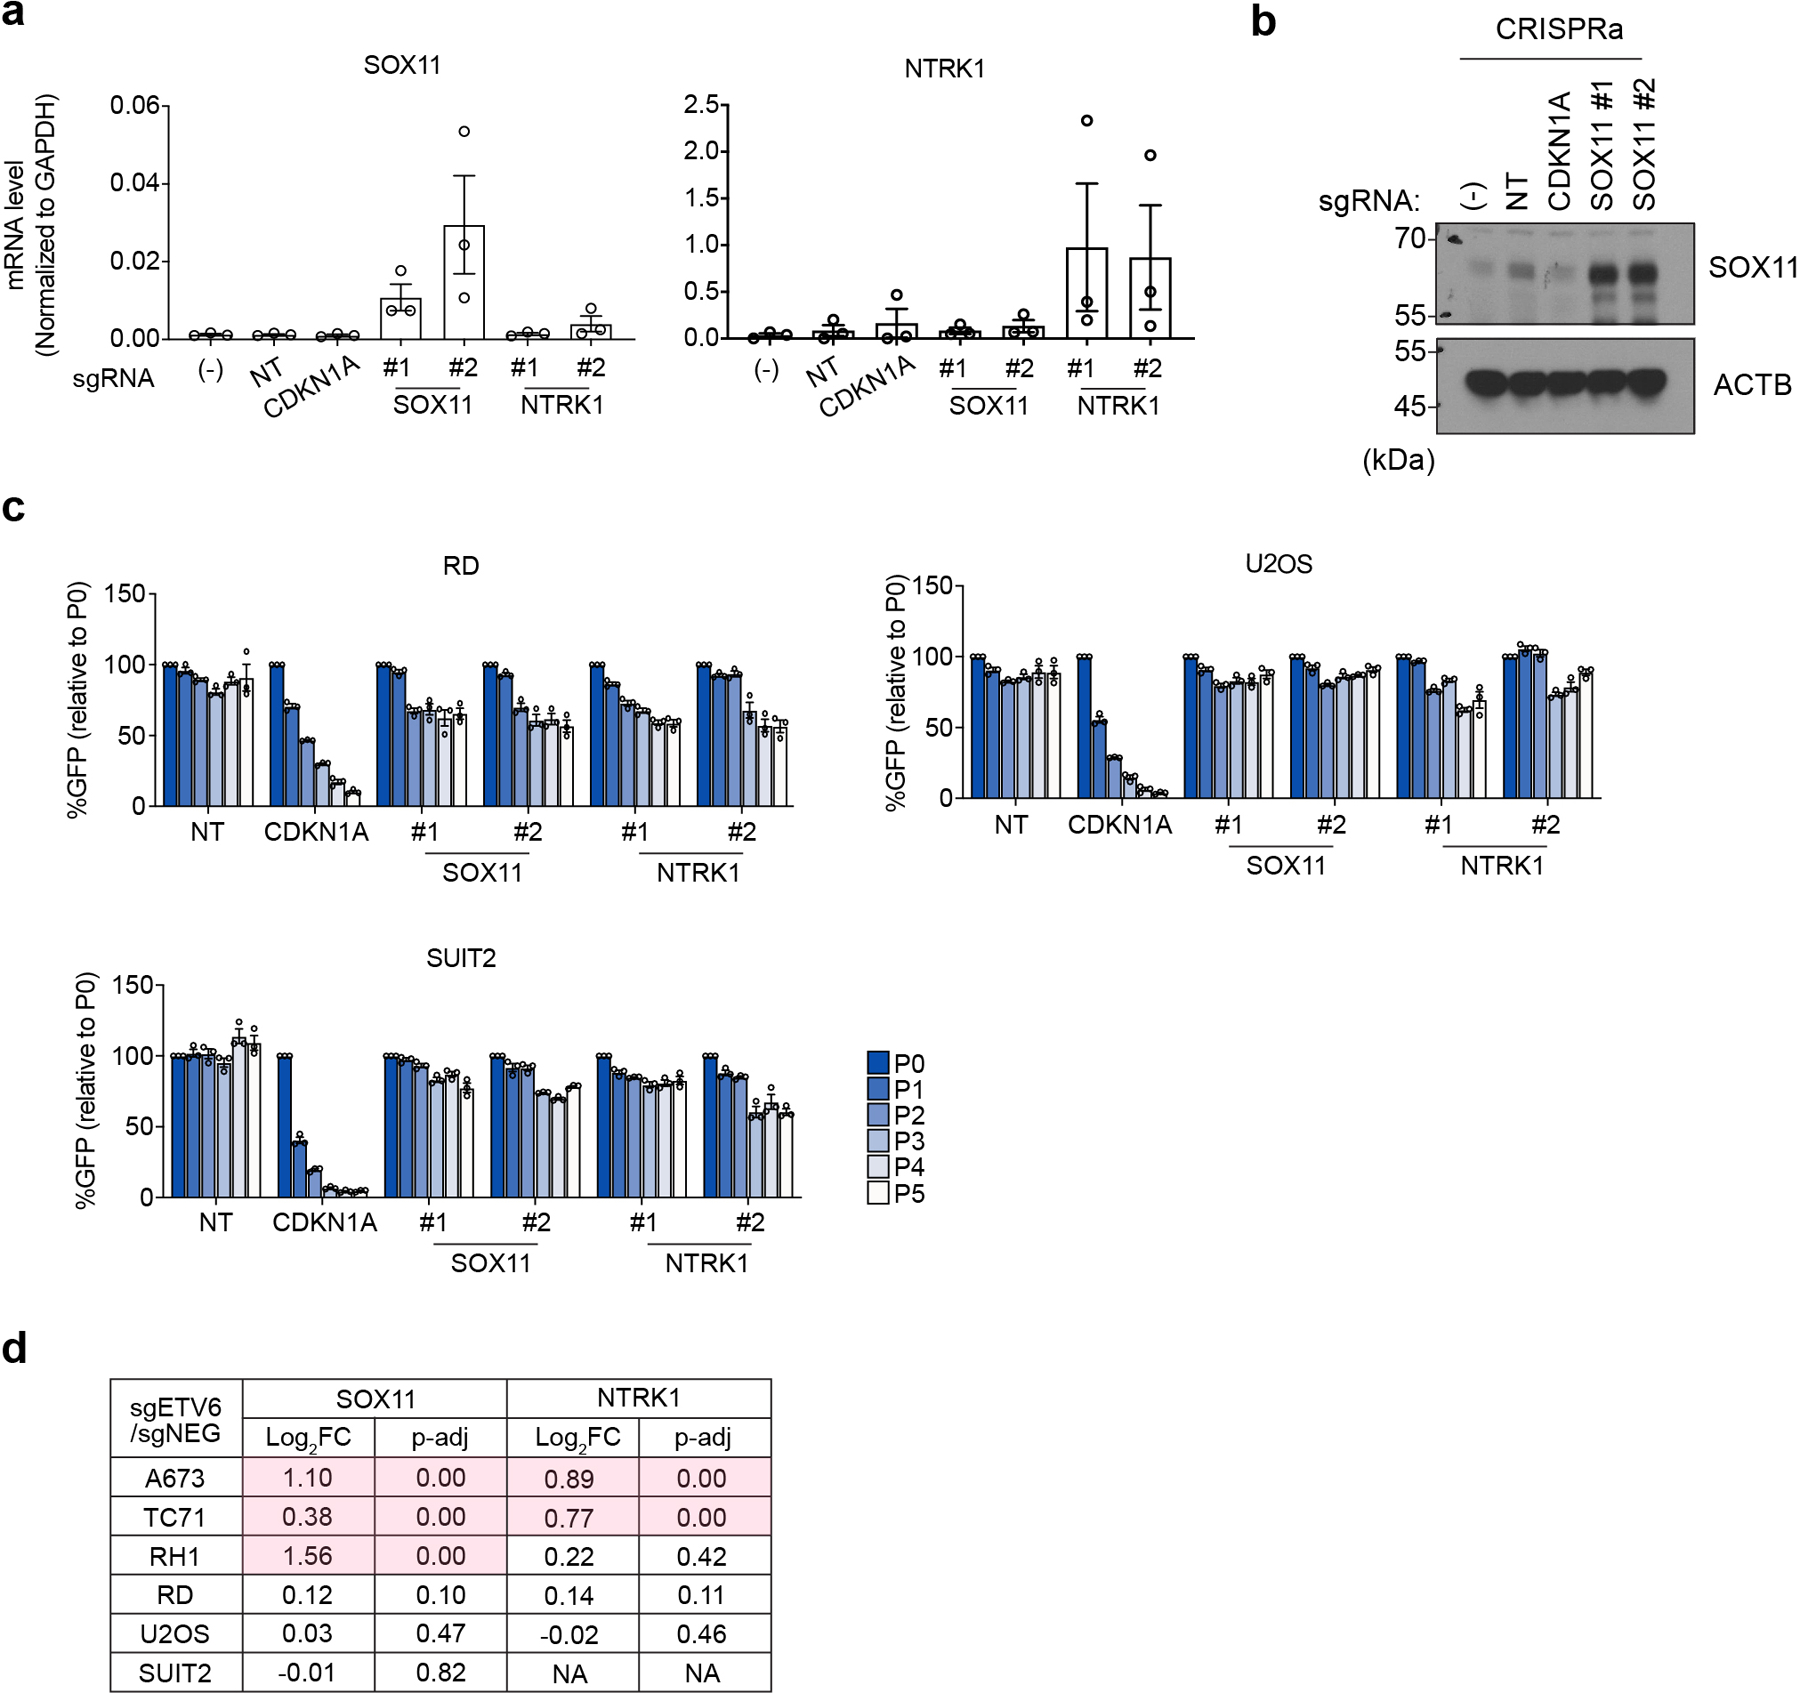
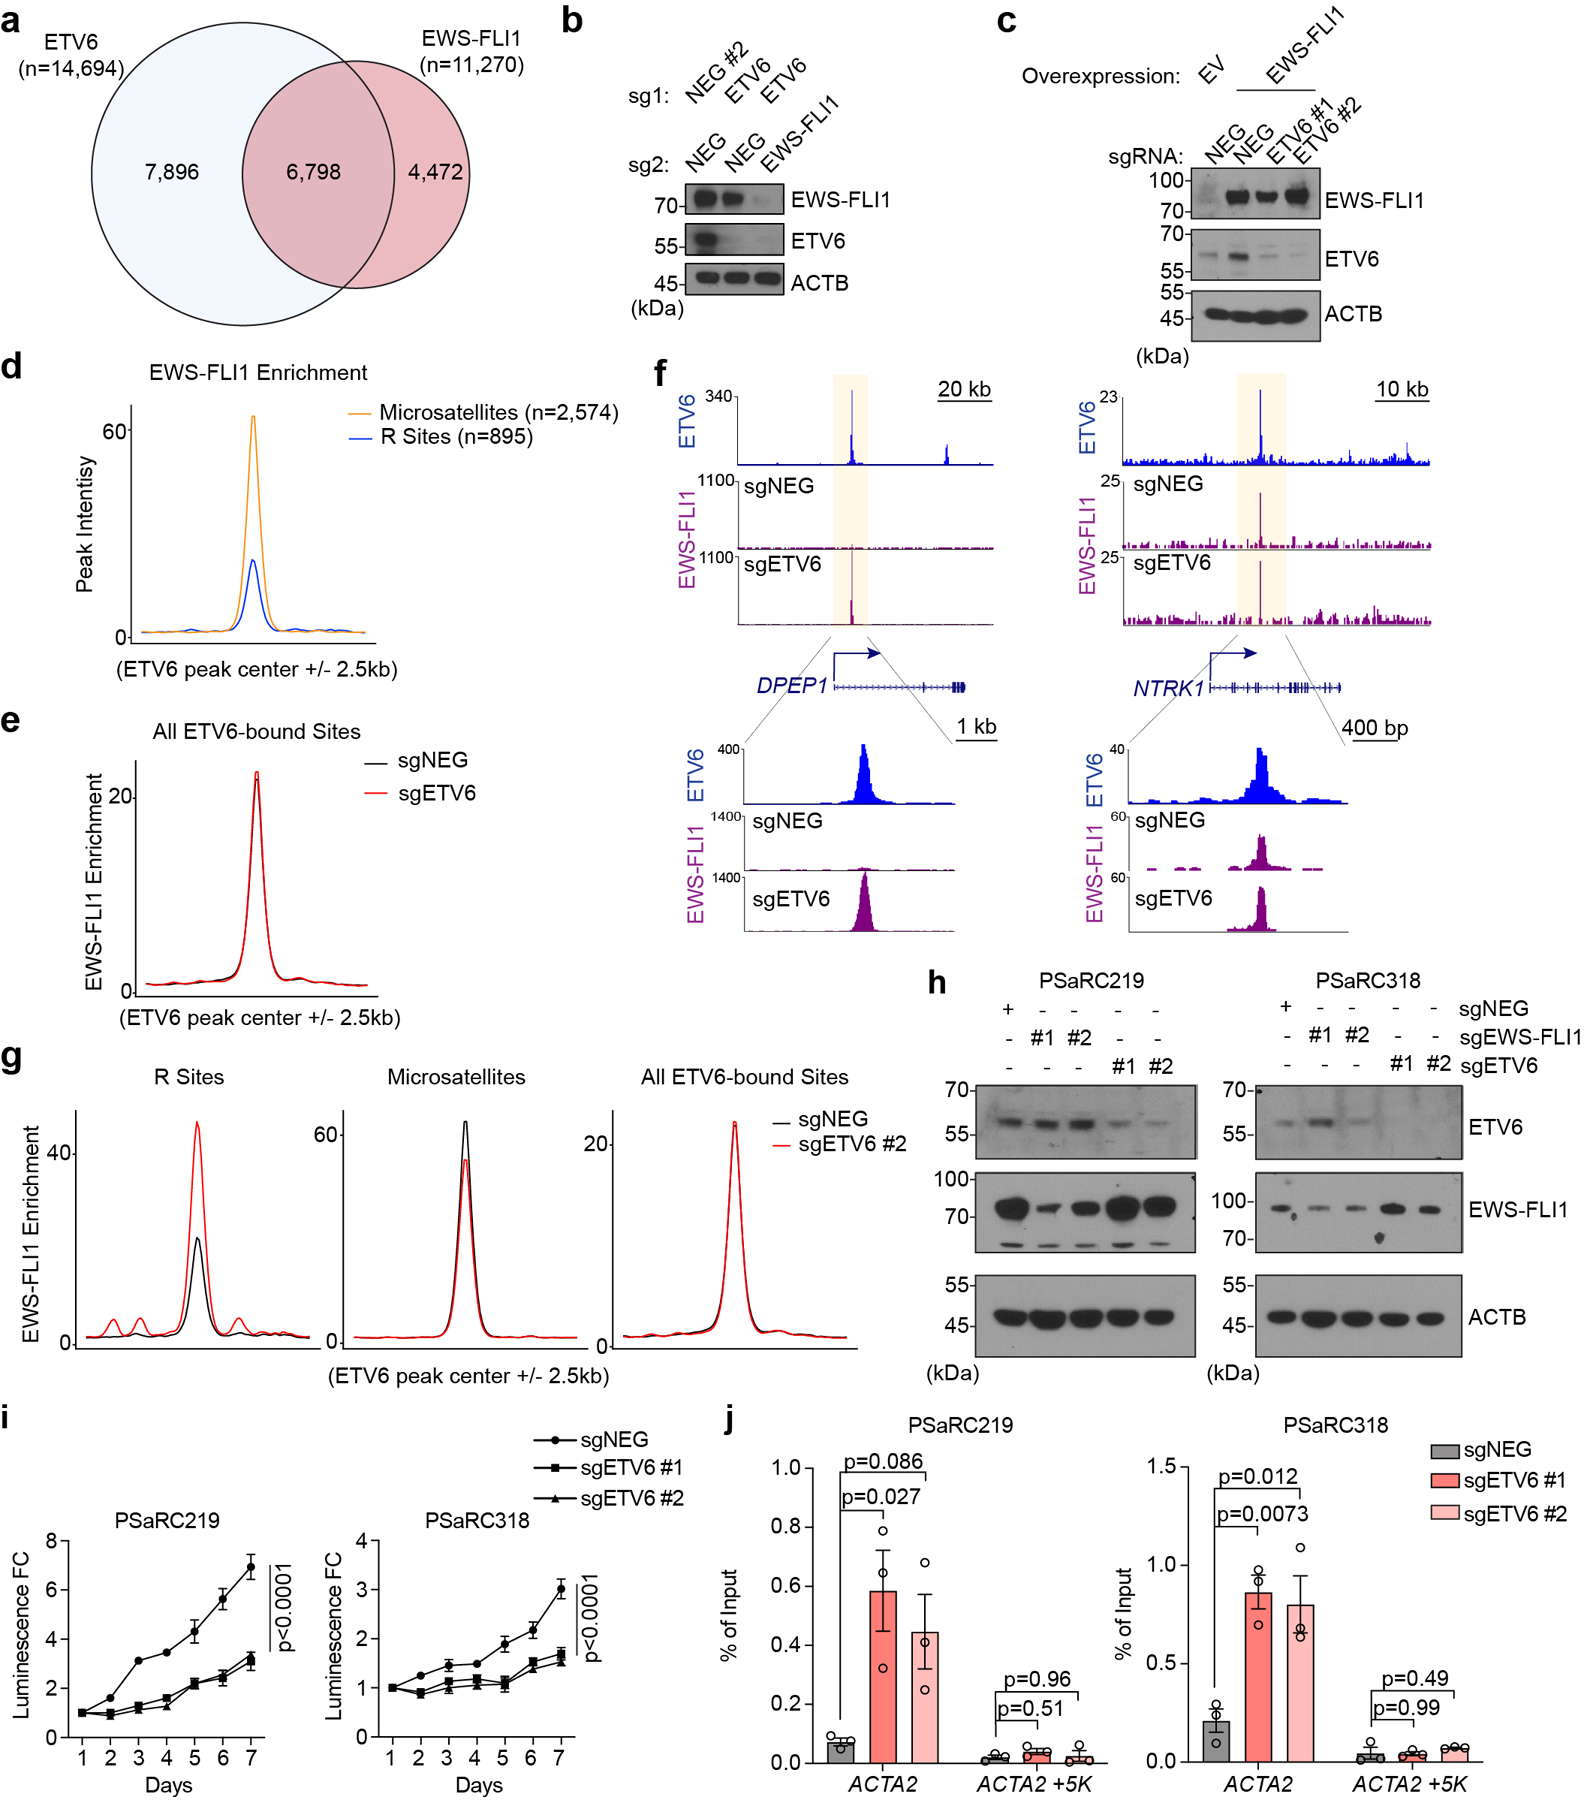
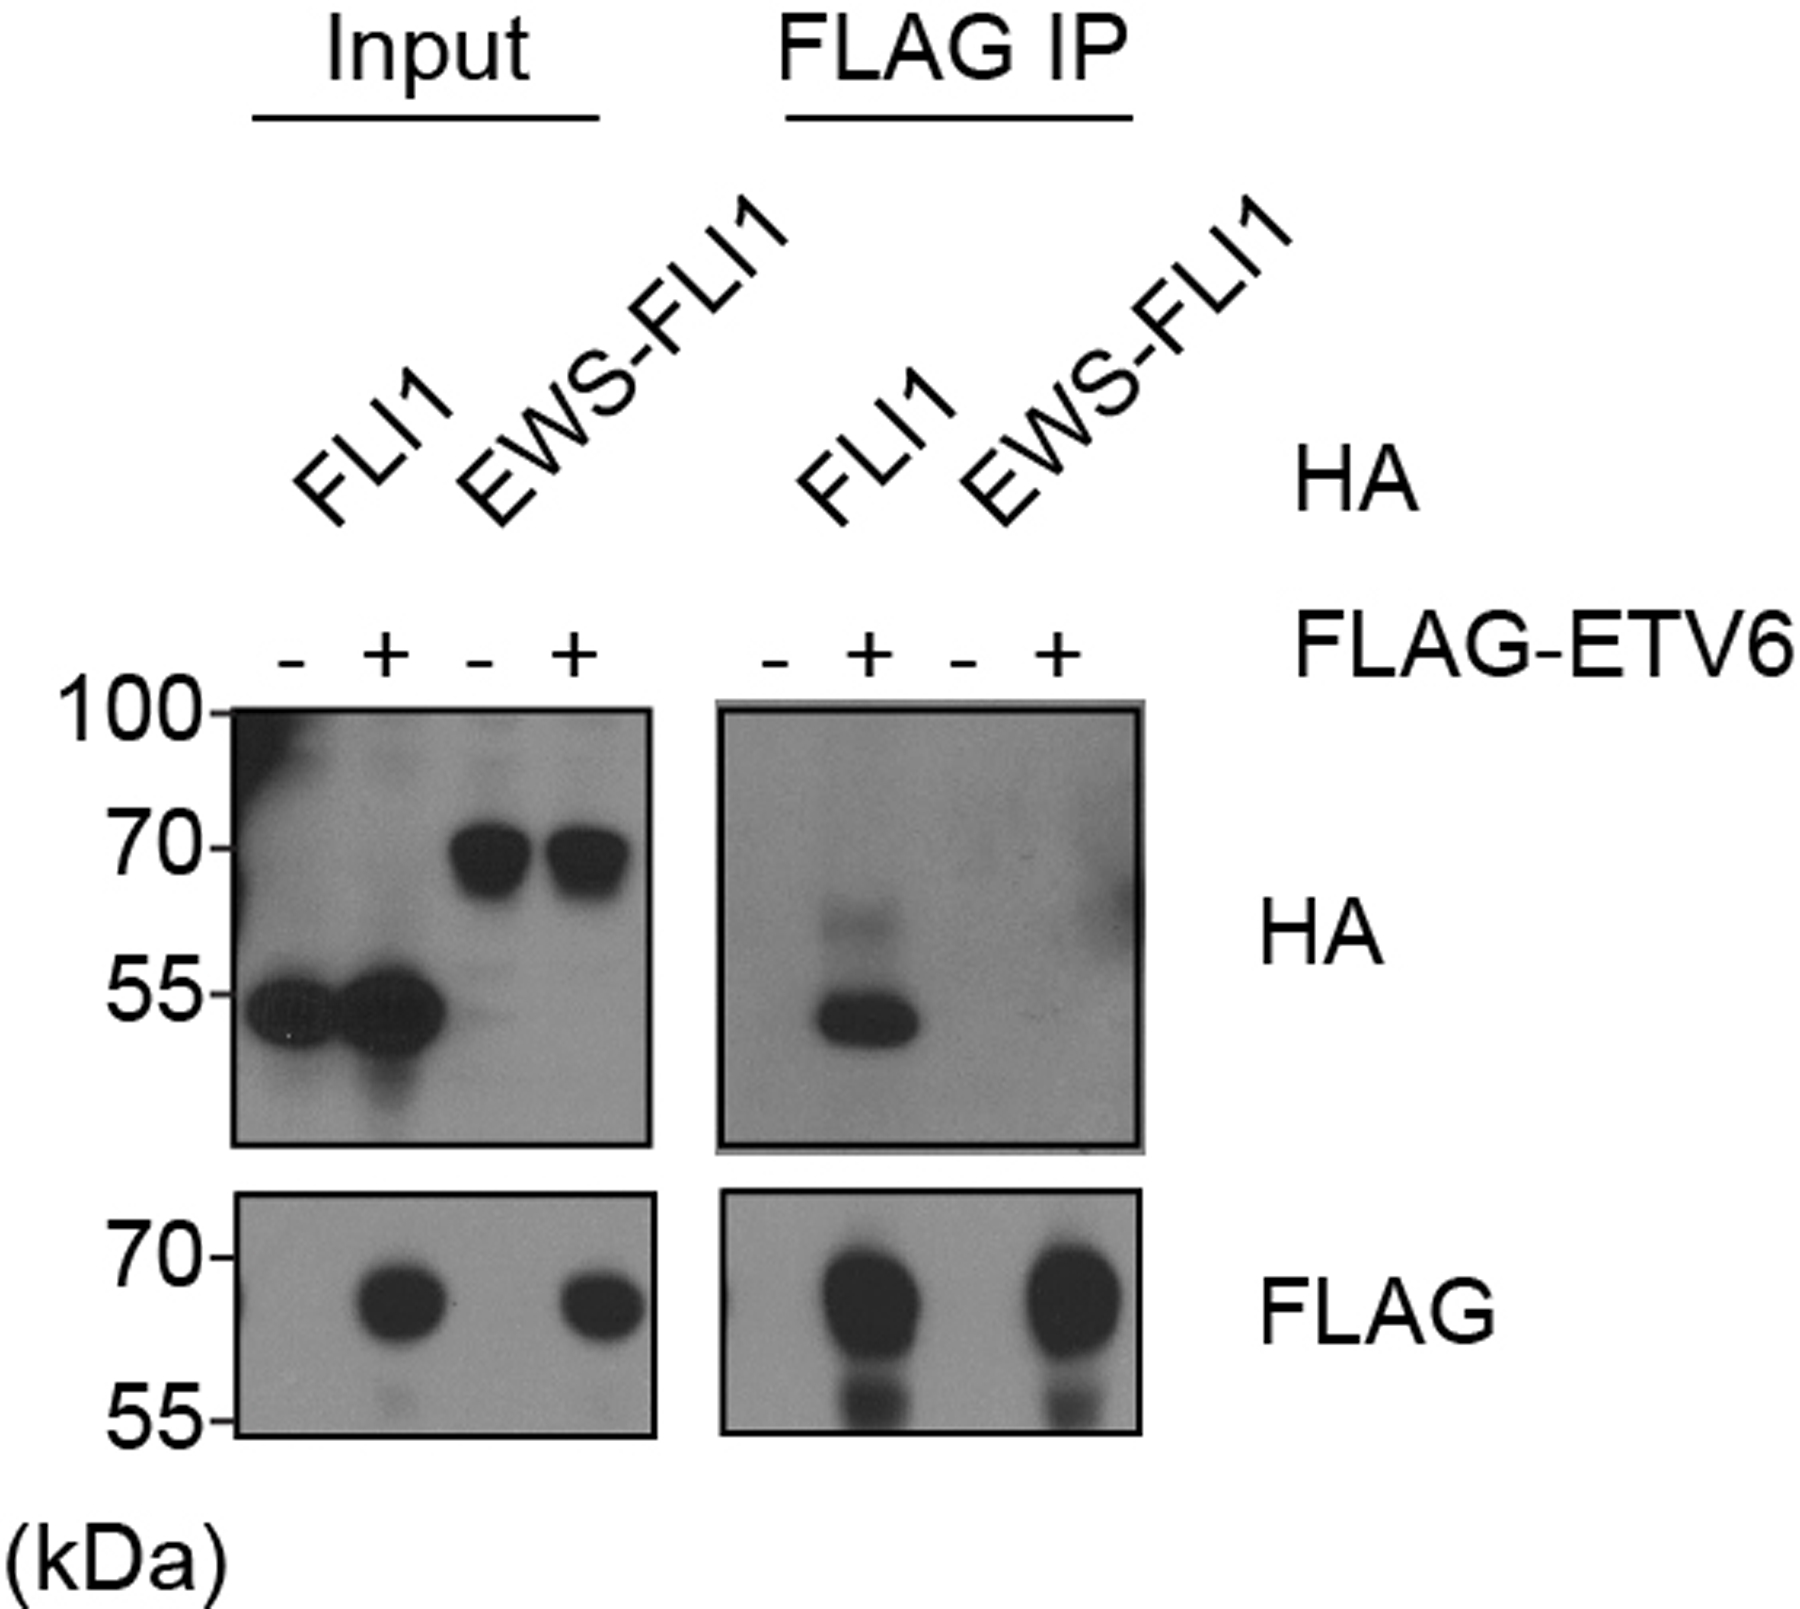
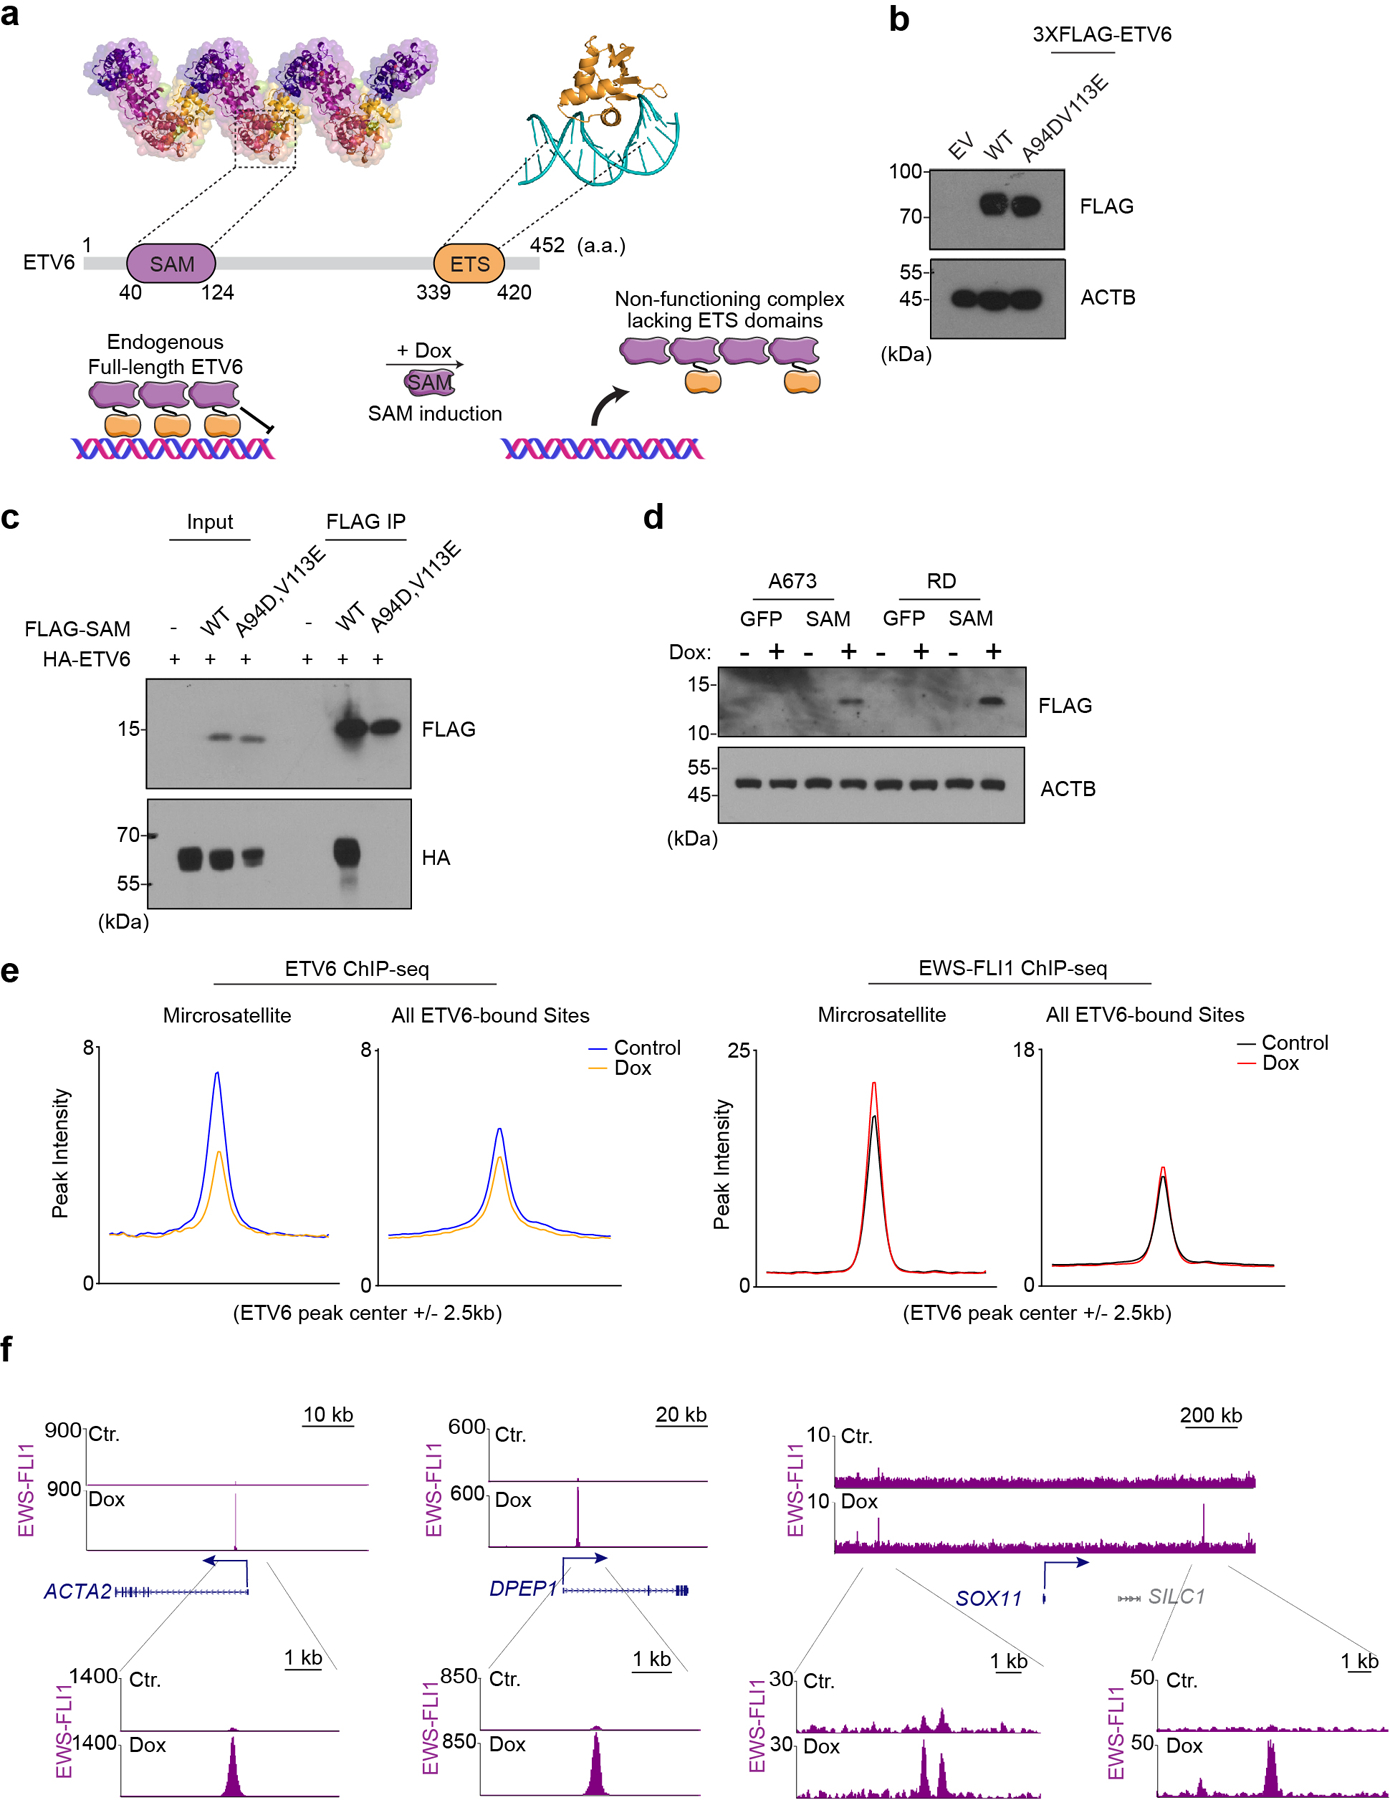
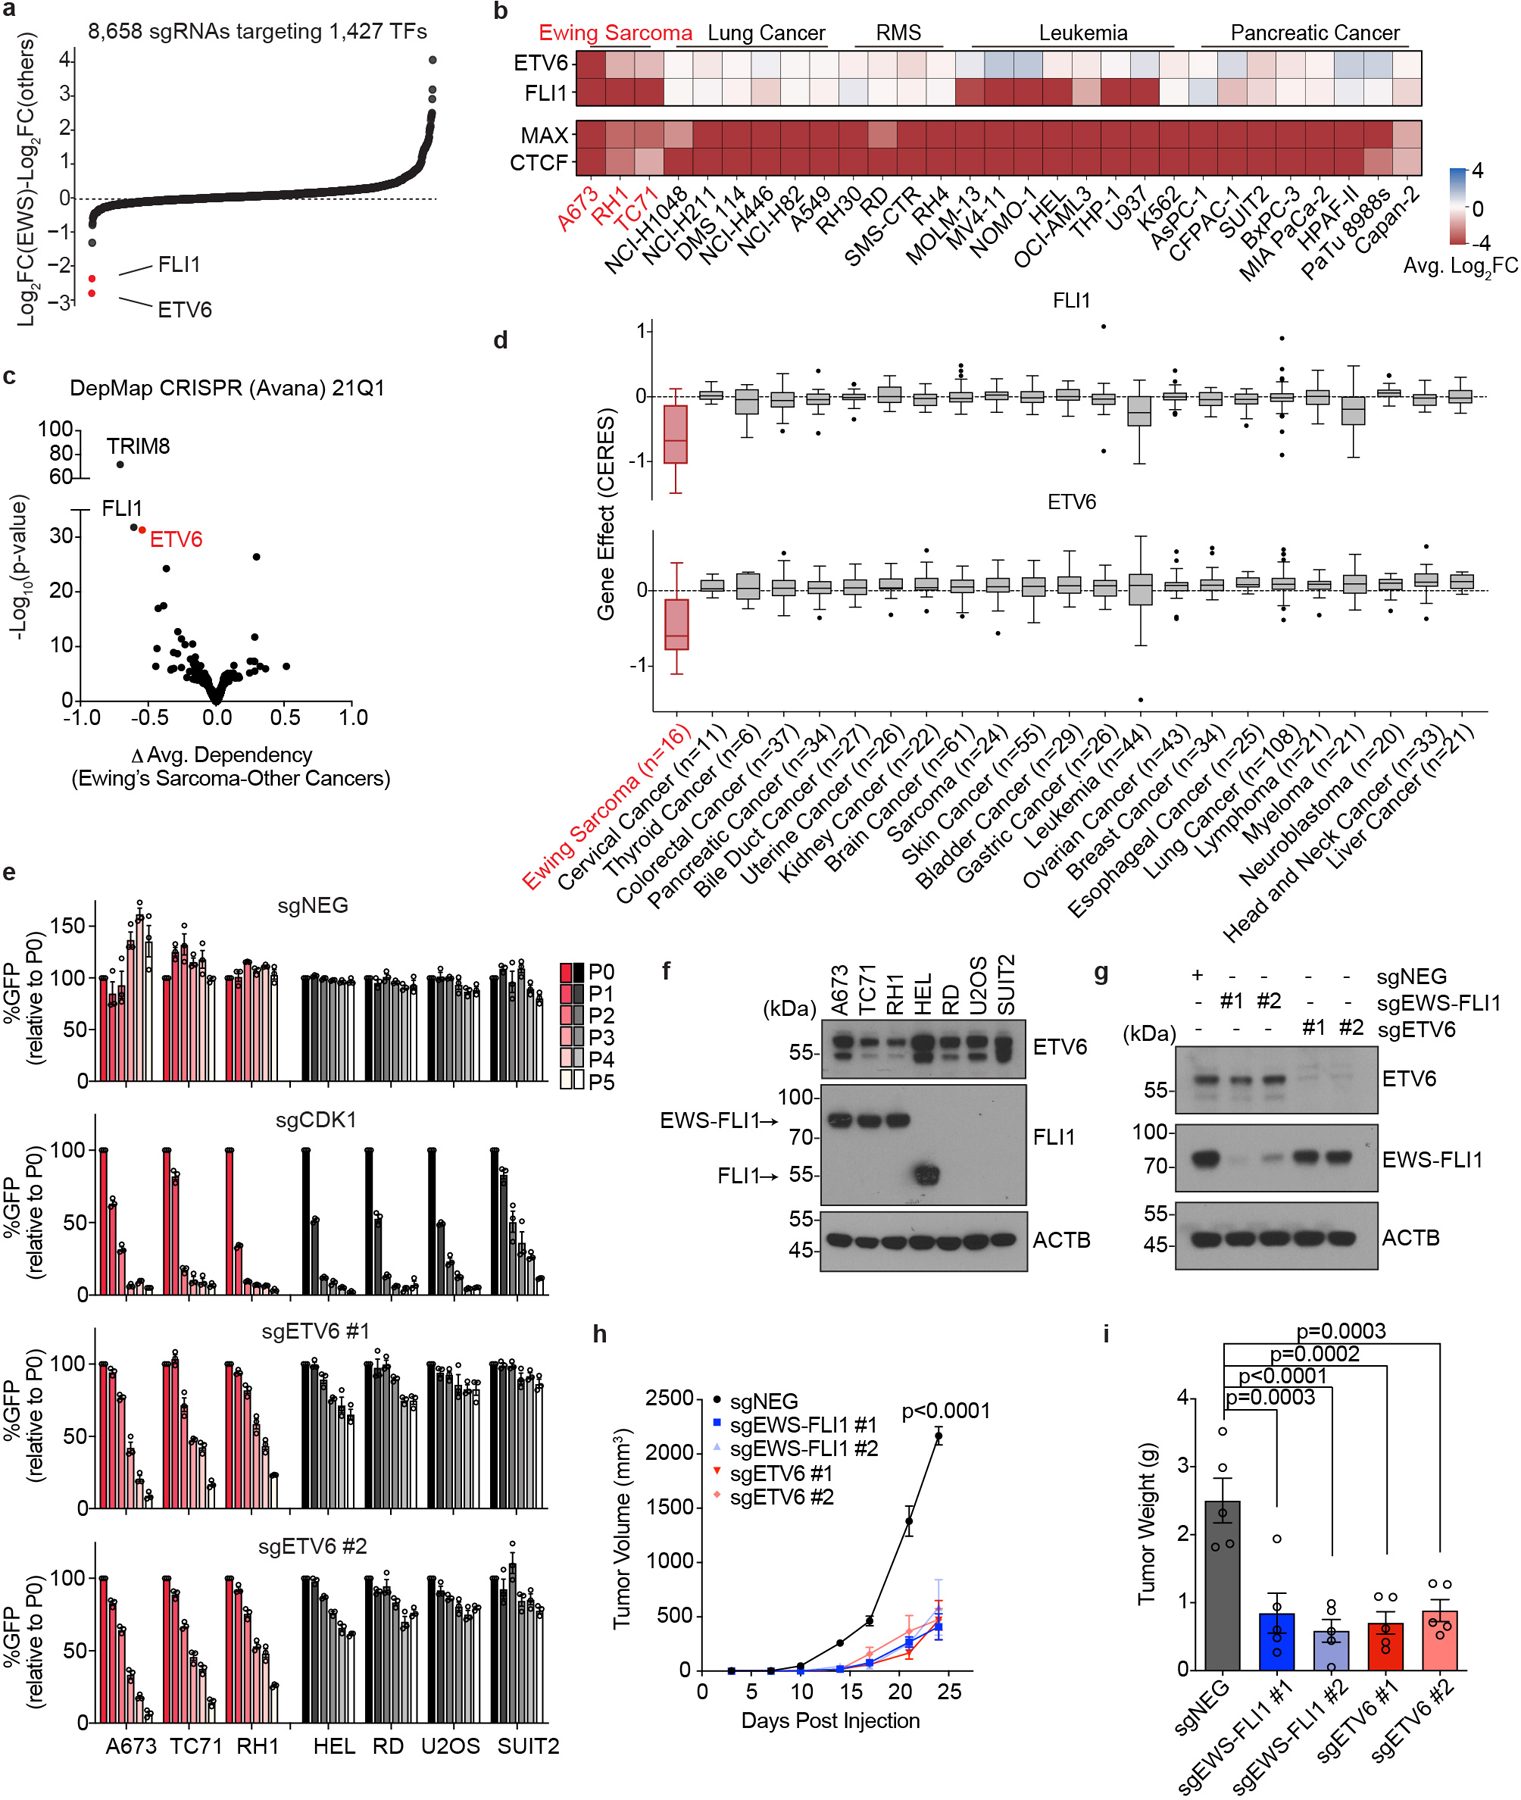
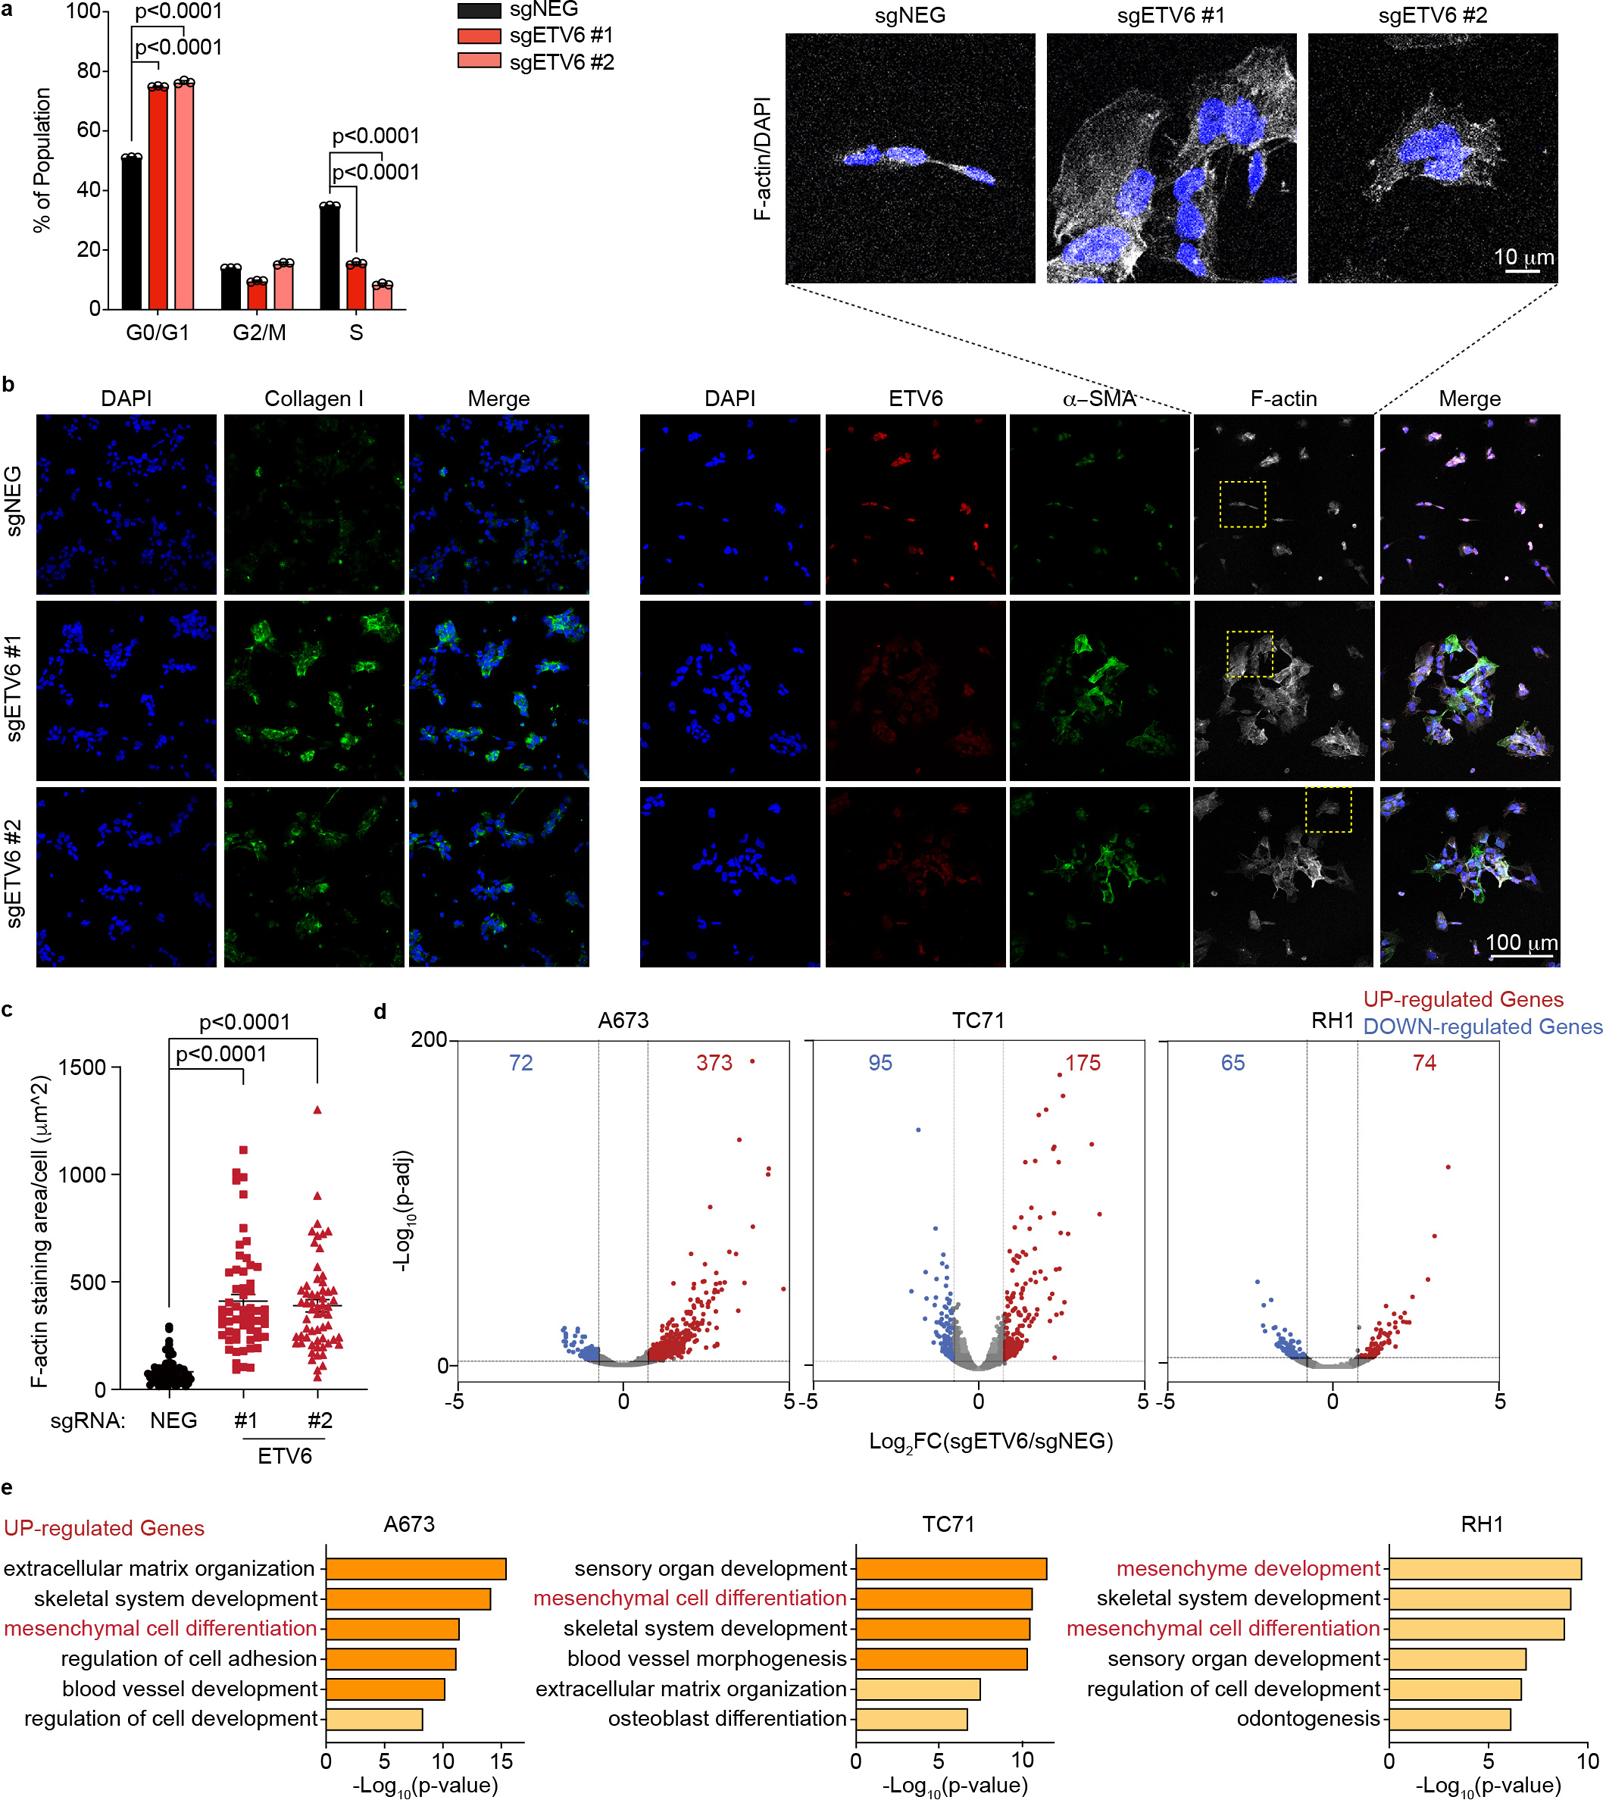
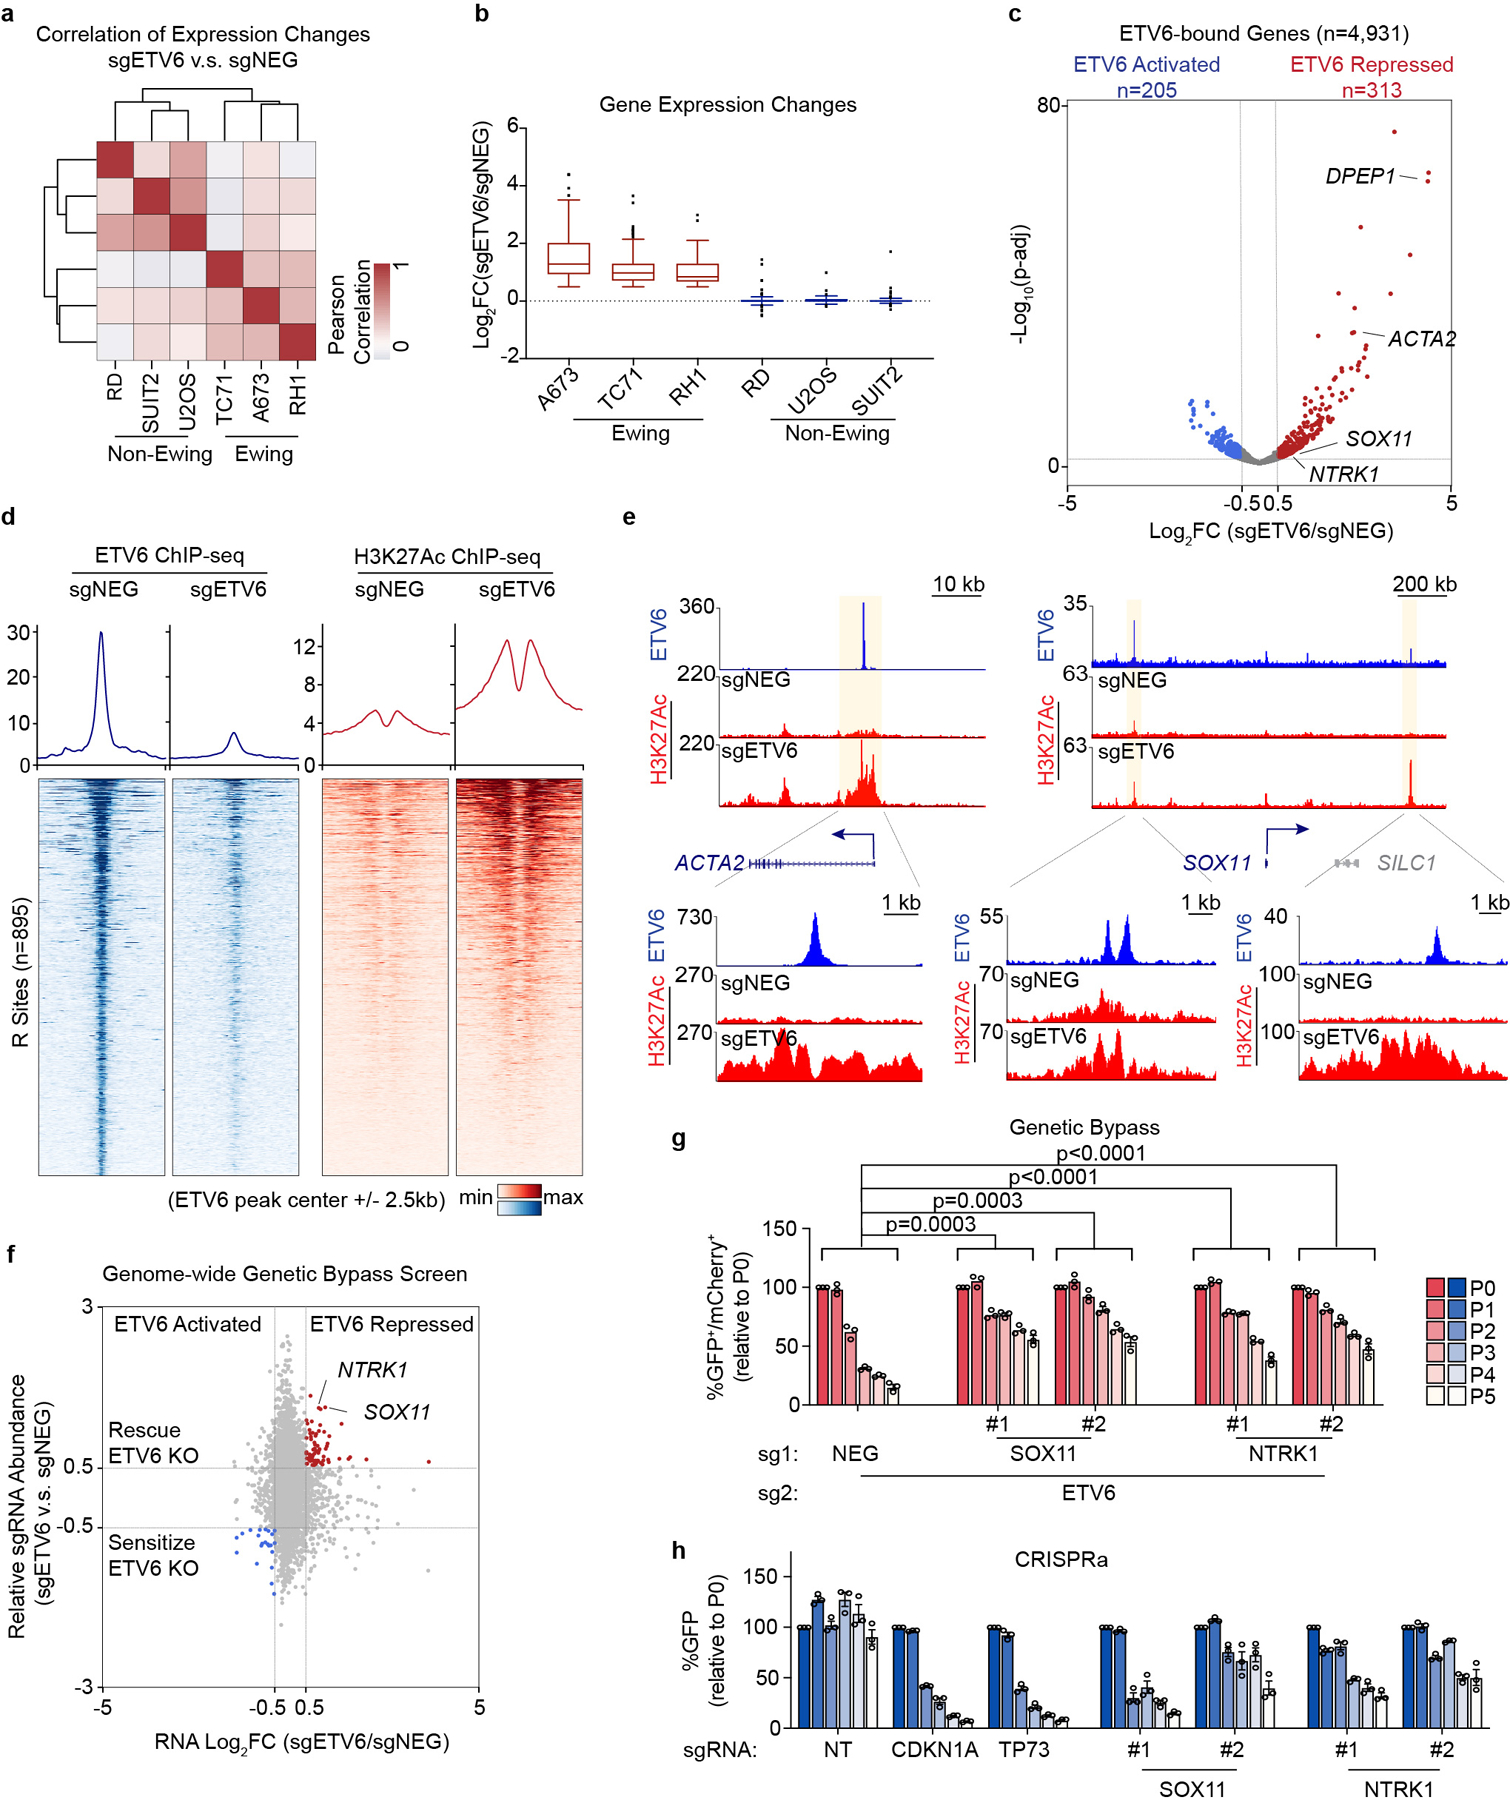
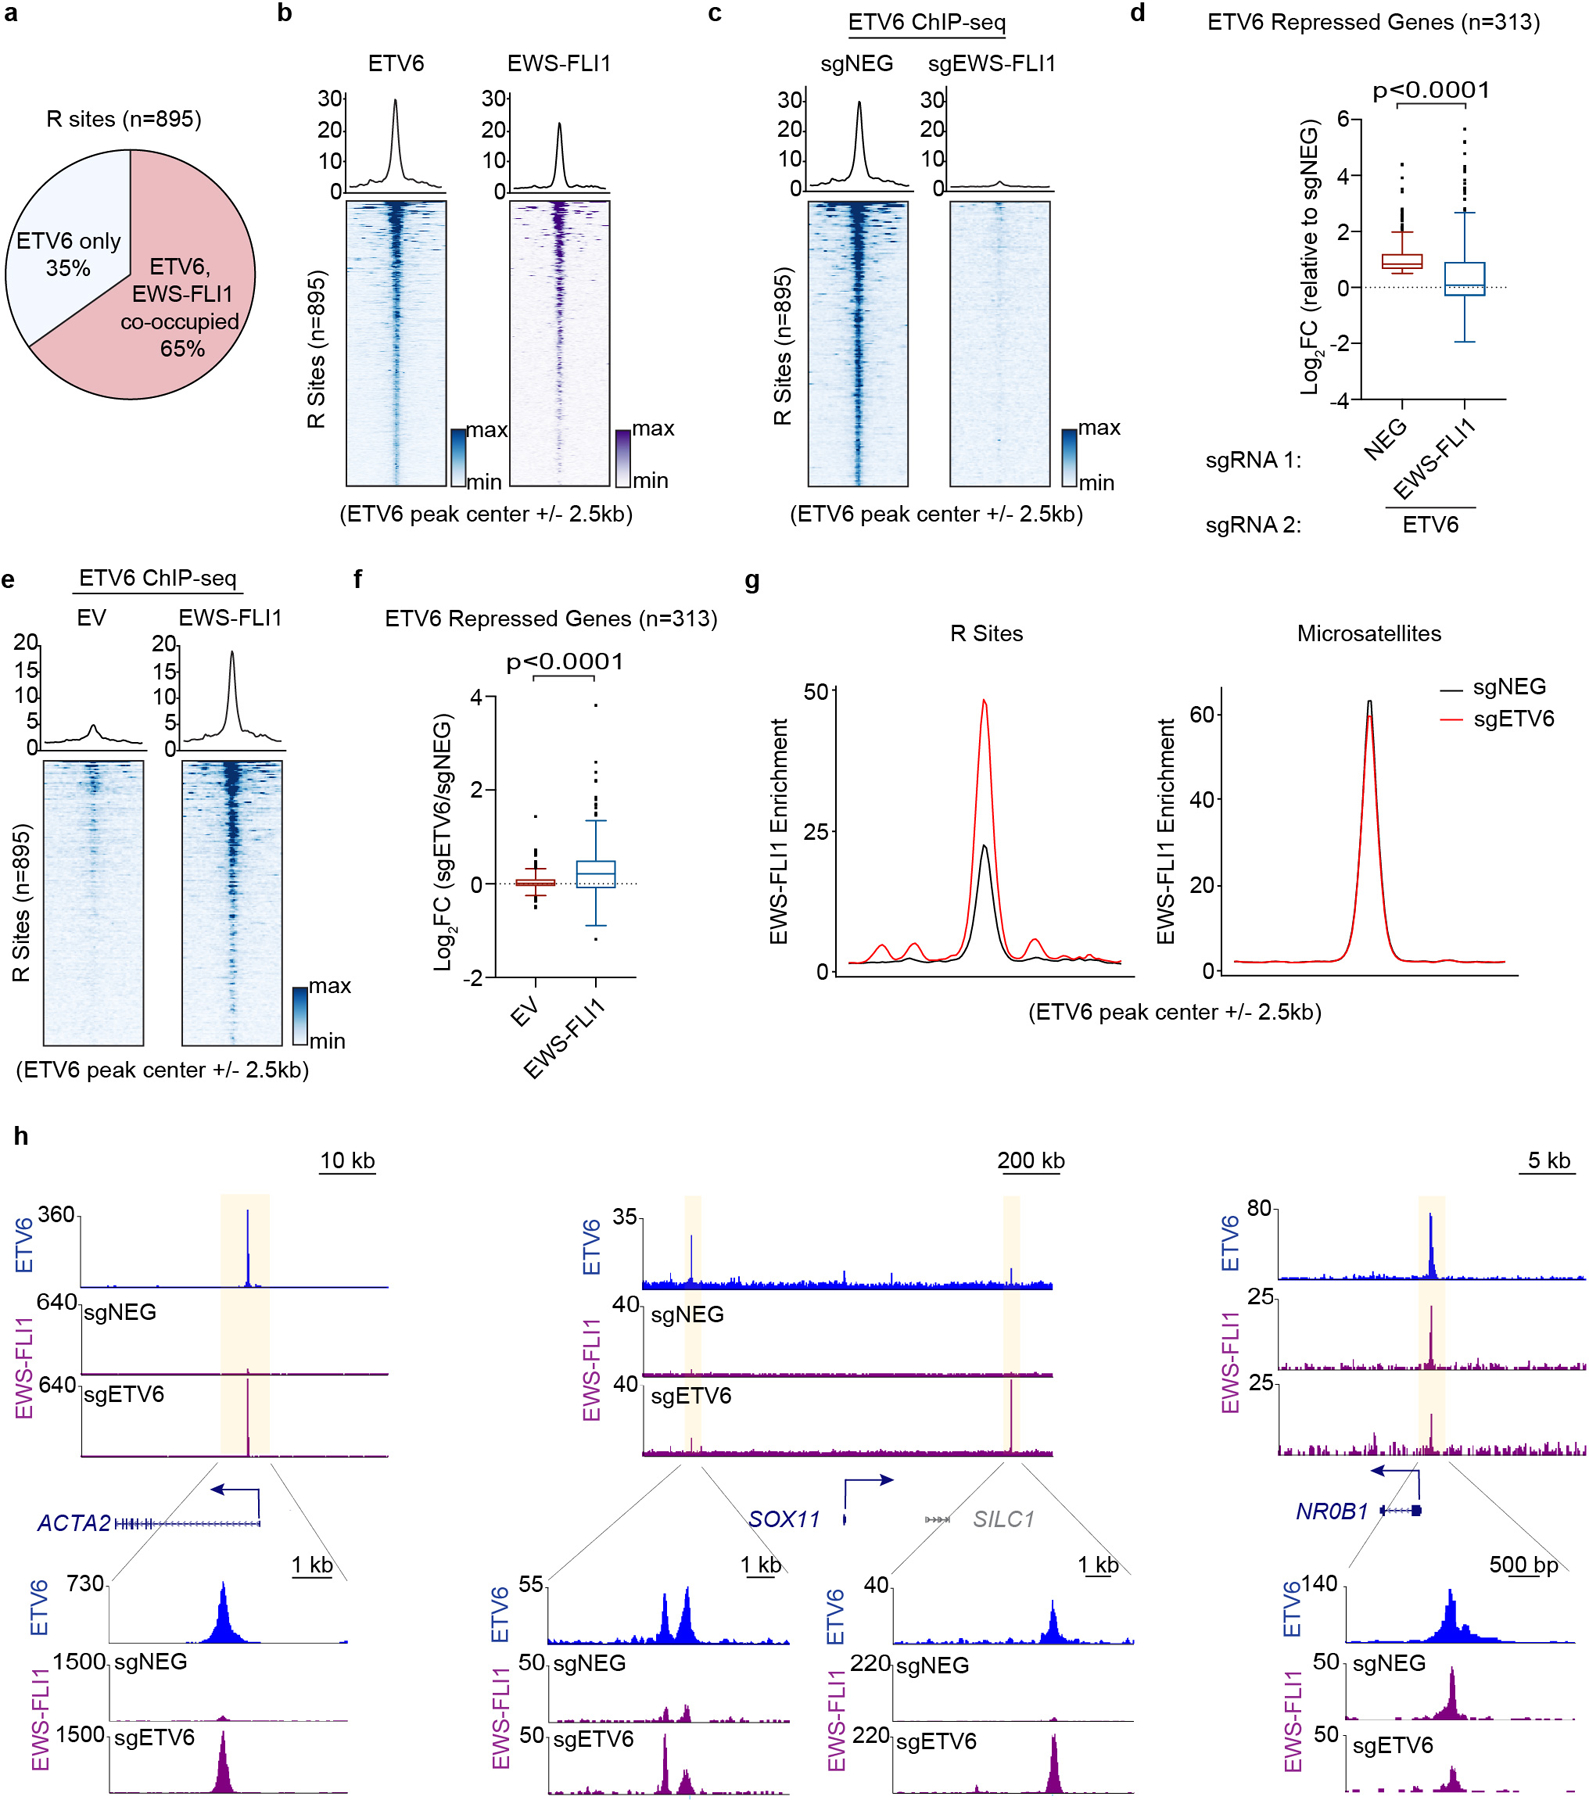
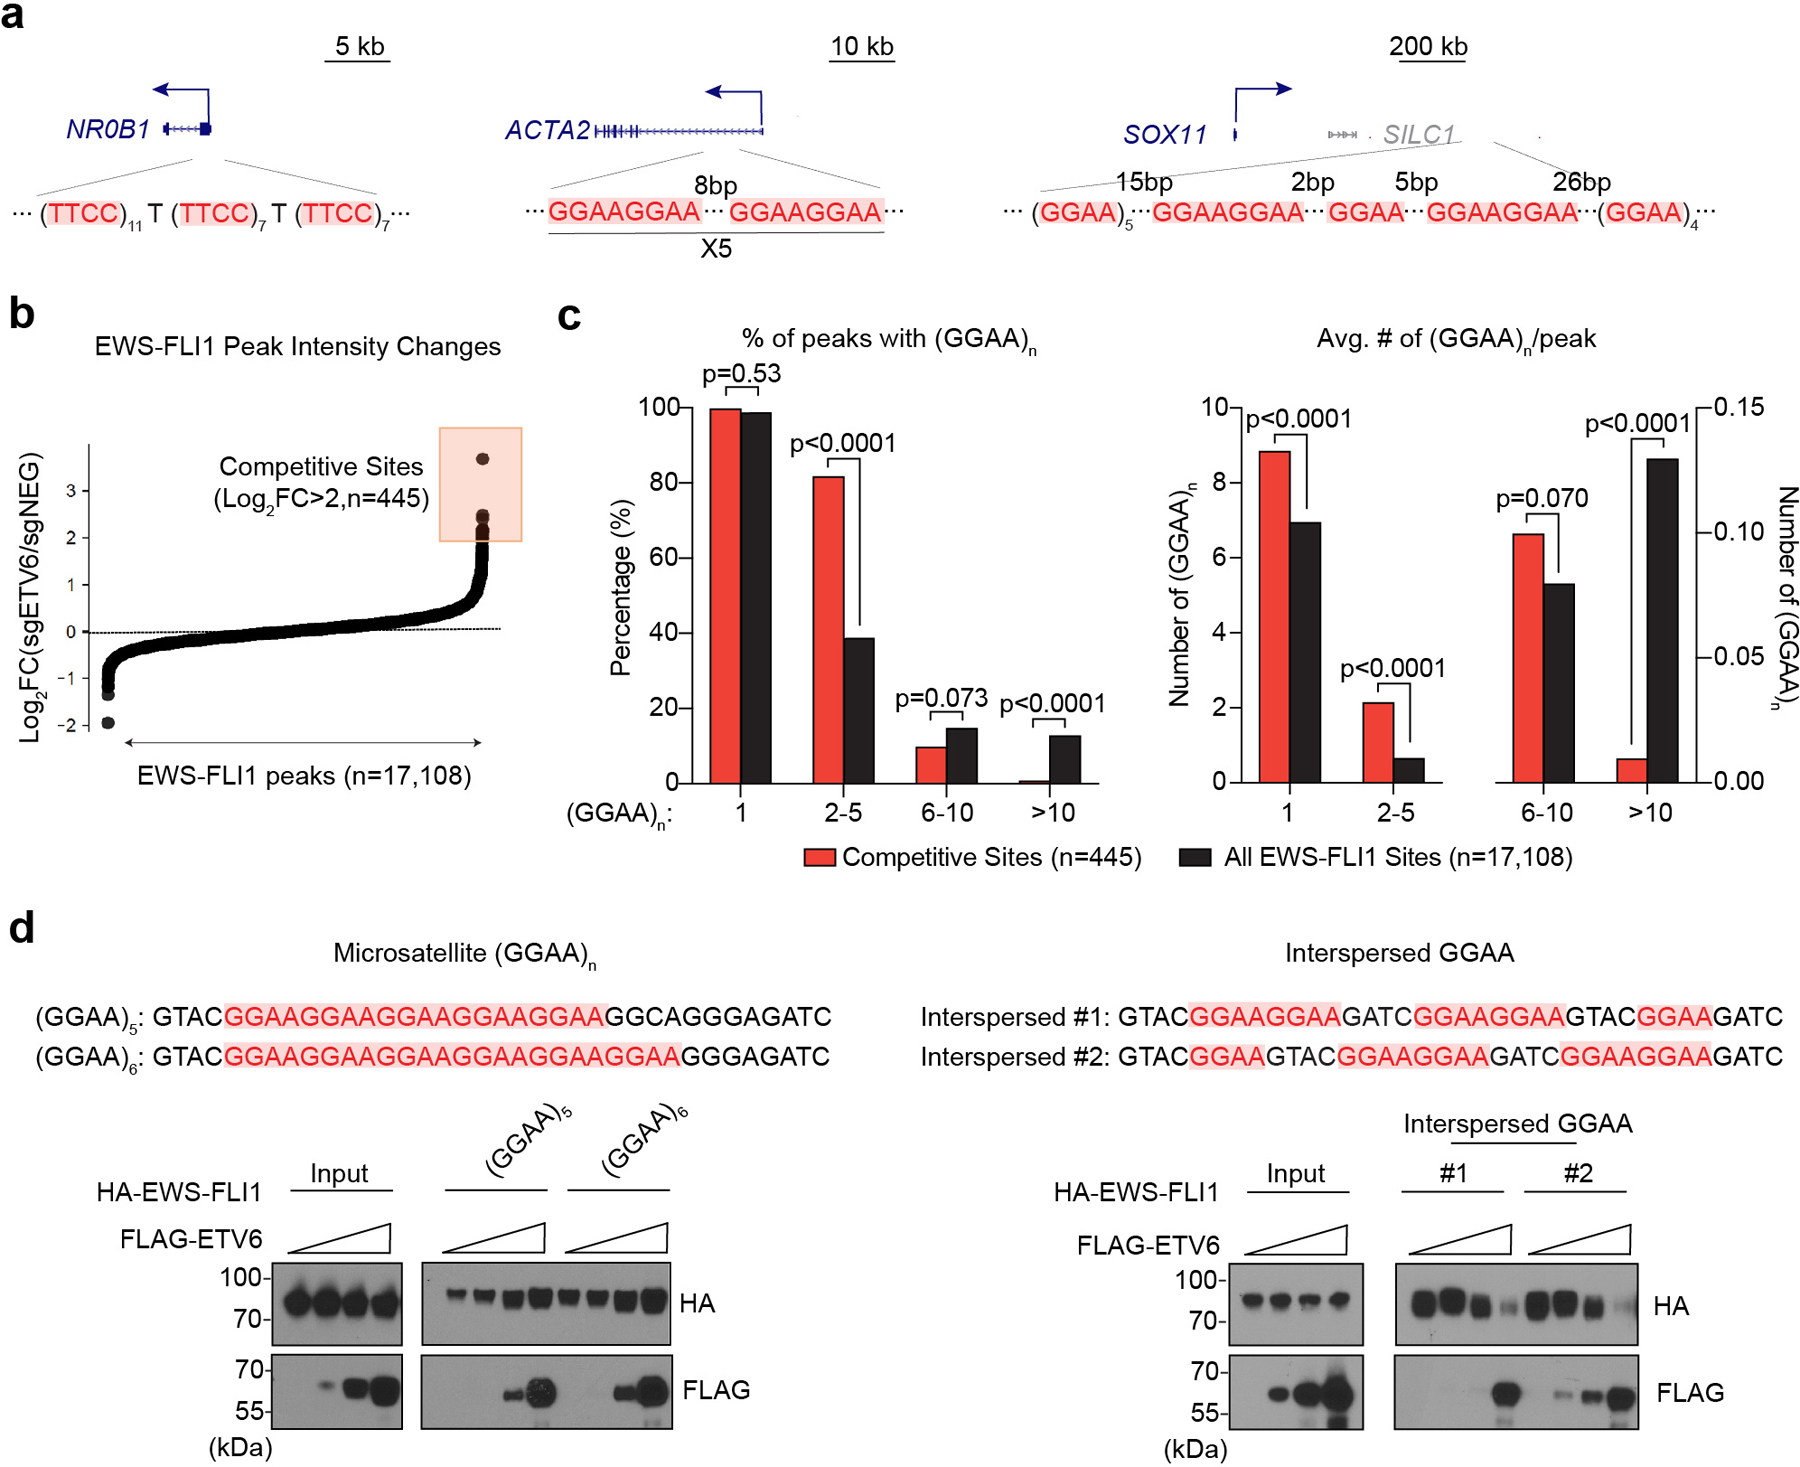
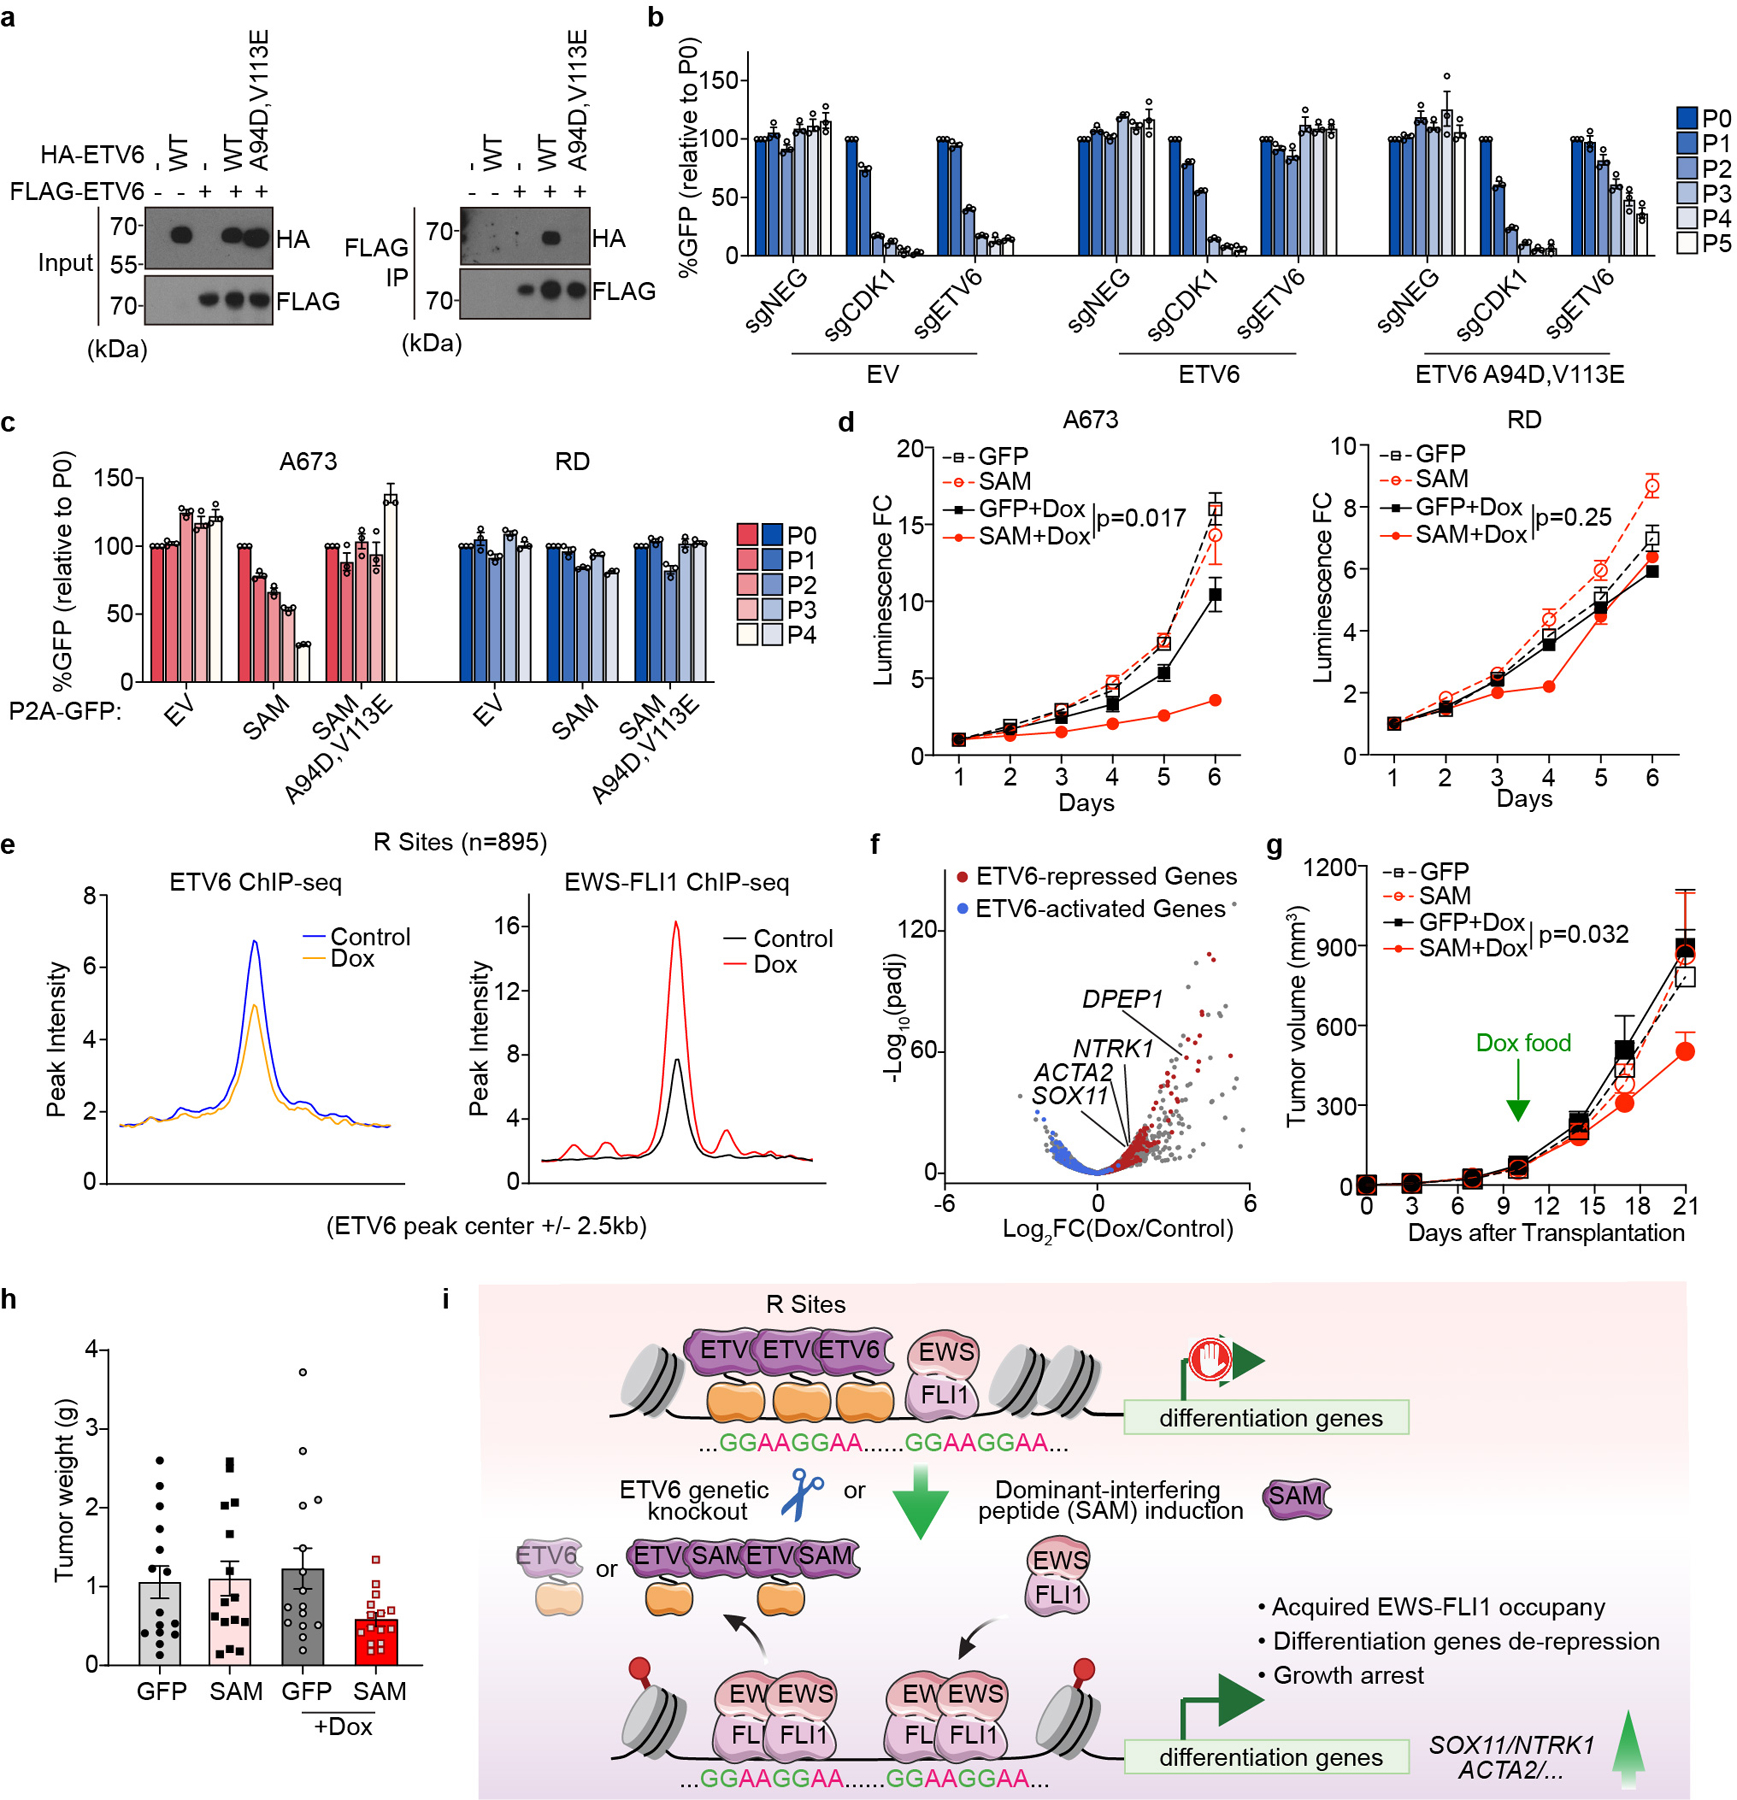
The EWS-FLI1 fusion oncoprotein deregulates transcription to initiate the paediatric cancer Ewing sarcoma. Here we used a domain-focused CRISPR screen to implicate the transcriptional repressor ETV6 as a unique dependency in this tumour. Using biochemical assays and epigenomics, we show that ETV6 competes with EWS-FLI1 for binding to select DNA elements enriched for short GGAA repeat sequences. Upon inactivating ETV6, EWS-FLI1 overtakes and hyper-activates these cis-elements to promote mesenchymal differentiation, with SOX11 being a key downstream target. We show that squelching of ETV6 with a dominant-interfering peptide phenocopies these effects and suppresses Ewing sarcoma growth in vivo. These findings reveal targeting of ETV6 as a strategy for neutralizing the EWS-FLI1 oncoprotein by reprogramming of genomic occupancy.


Figures

Extended Data Fig. 1 |
Extended Data Fig. 1 |. ETV6 is a dependency in Ewing sarcoma cell lines.
(a) Scatterplot showing the correlation between patient survival time and ETV6 expression level in primary tumours from the ICGC BOCA-FR dataset containing 57 Ewing sarcoma patients. Blue lines mark the mean with 95% confidence interval. (b) Comparison of patient survival time between ETV6-high (Top 25%, n = 15) and ETV6-low patients (Bottom 25%, n = 15). Data are mean ± SEM. P value was calculated using two-tailed unpaired Student’s t-test. (c) Western blot of ETV6 and EWS-FLI1 levels confirming the knockout of ETV6 in different cancer cell lines. Beta-ACTIN (ACTB) was used as a loading control. (d) Photographs of collected tumours at end time point. (e) Western blot indicates that the resulting tumours from A673 xenograft experiments maintain similar levels of ETV6 and EWS-FLI1. ACTB was used as a loading control. (f) Representative images of immunofluorescence staining for PCNA (red) in the resulting tumours from A673 xenograft experiments (left panel). Percentage of PCNA-positive over DAPIpositive cells was quantified in the right panel. Data are mean ± SEM. P values were calculated using one-way ANOVA, Tukey’s multiple comparison tests. (n = 5 tumours) (g) Representative images of immunofluorescence staining for Cleaved Caspase-3 (red) in the resulting tumours from A673 xenografts (left panel). Percentage of Cleaved Caspase-3 positive over DAPI stained cells was quantified in the right panel. Data are mean ± SEM. P values were calculated using one-way ANOVA, Tukey’s multiple comparison tests. (n = 5 tumours).
Extended Data Fig. 2 |
Extended Data Fig. 2 |. ETV6 knockout in Ewing sarcoma drives mesenchymal differentiation.
(a) Representative images of immunofluorescence staining for collagen I (red), alpha smooth muscle actin (α-SMA, green) and the cytoskeleton component F-actin (white) in RH1 cells infected with indicated sgRNAs. (b, c) Representative images of immunofluorescence staining for alpha smooth muscle actin (α-SMA, red) and the cytoskeleton component F-actin (white) in two independent patient-derived Ewing sarcoma tumour cells PSaRC219 (b) and PSaRC318 (c) infected with indicated sgRNAs. (d) Quantification of cell size based on F-actin staining (μm2 ) in RH1, PSaRC219 and PSaRC318 cells. Data are mean ± SEM. P values were calculated using one-way ANOVA, Dunnett’s multiple comparison tests. (e) Representative images of immunofluorescence staining for collagen I (green) in the resulting tumours from A673 xenografts (left). Percentage of Collagen I stained area was quantified (right). (n = 5 tumours) Data are mean ± SEM. P values were calculated using one-way ANOVA, Dunnett’s multiple comparison tests
Extended Data Fig. 3 |
Extended Data Fig. 3 |. ETV6 knockout up-regulates mesenchymal differentiation program in Ewing sarcoma cells, but not in non-Ewing cancer cell lines.
(a) Volcano plots showing the gene expression changes upon ETV6 knockout in 3 different non-Ewing cancer cell lines (RD, U2OS and SUIT2) assessed by RNA-seq. UP-regulated Genes (Log2FC > 0.5, p-adj 1) and down-regulated (Log2FC  1, P value 1, P value<0.01) from our study in A673 cells.
Extended Data Fig. 4 |
Extended Data Fig. 4 |. ETV6 knockout does not enhance Ewing sarcoma cell migration or invasion phenotype.
(a) Representative images of migrated cells toward a high serum environment after 24 hours seeded in serum-free media in three Ewing sarcoma cell lines (A673, RH1 and TC71) (left). Comparison of the cell counts that migrate through the pores. Data are mean ± SEM. P values were calculated using one-way ANOVA, Tukey’s multiple comparison tests. (n = 3 biological replicates) (b) Representative images (left) and quantification (right) of trans-well invasion assay measuring the number of cells invade through a Matrigel matrix (24 hours). Data are mean ± SEM. P values were calculated using one-way ANOVA, Tukey’s multiple comparison tests. (n = 3 biological replicates).
Extended Data Fig. 5 |
Extended Data Fig. 5 |. ETV6 represses a unique set of genes that contributes to the dependency in Ewing sarcoma cells.
(a) Venn diagram showing the overlap of ETV6 ChIP-seq peaks between Ewing (A673) and non-Ewing cell lines. The ETV6 peaks in non-Ewing cells were annotated by merging ETV6 peaks from 3 different non-Ewing cancer cell lines. (b) The schematic diagram of genetic bypass screening. (c) Competition-based proliferation assay to validate the genetic bypass screening results using single sgRNAs. The sgNEG-mCherry control related to Fig. 3g. Data are mean ± SEM. (n = 3 biological replicates) (d) Competitionbased proliferation assay to validate the genetic bypass screening results in two additional Ewing sarcoma cell lines (TC71 and RH1). Cells were infected with a dual-sgRNA linked to a GFP reporter. The percentage of cells that are positive for GFP were monitored during culturing. Data are mean ± SEM. P values were calculated using two-way ANOVA. (n = 3 biological replicates) (e)Western blot confirming the knockout of ETV6 and SOX11 in A673 cells prior to subcutaneous injections. ACTB was used as a loading control. (f) Average growth curves of ETV6 or/and SOX11, NTRK1 knockout A673 xenografts in immunodeficient mice. Data are mean ± SEM. Linear mixed-effects model with sgRNA, time and sgRNA by time interaction as fixed effects and sample specific random intercept was used to fit the longitudinal tumour volume data. Differences in tumour volume were examined using simultaneous tests for general linear hypotheses of contrasts of interest. P values were adjusted for multiple comparisons using the BonferroniHolm method. (sgNEG;sgNEG#2 (n = 11), sgNEG;sgETV6 (n = 12), sgETV6;sgSOX11 (n = 20), sgETV6;sgNTRK1 (n = 16)). (g) Weight of the resected tumours at the end point. Data are mean ± SEM. Log-transformed tumour weight in different groups were compared using Welch’s ANOVA test followed by Dunnett’s T3 multiple-comparison tests. (sgNEG;sgNEG#2 (n = 11), sgNEG;sgETV6 (n = 12), sgETV6;sgSOX11 (n = 20), sgETV6;sgNTRK1 (n = 16)).
Extended Data Fig. 6 |
Extended Data Fig. 6 |. Activation of ETV6 target genes specifically impairs Ewing sarcoma cell growth.
(a) RT-PCR analysis of SOX11 and NTRK1 levels in the CRISPR activation experiments. (−), no virus infection control. NT, non-targeting sgRNA control. Data are mean ± SEM. (n = 3 biological replicates) (b) Western blot confirming the elevation of SOX11 level upon CRISPR activation. ACTB was used as a loading control. (c) Competition-based proliferation assay evaluating the effects of candidate gene activation, using CRISPR activation (CRISPRa), to cell fitness in non-Ewing cancer cell lines (RD, U2OS and SUIT2). The percentage of GFP positive cells was monitored during culturing. Data are mean ± SEM. (n = 3 biological replicates) (d) Gene expression changes of SOX11 and NTRK1 in different cell lines assessed by RNA-seq. The significant expression changes (p
Extended Data Fig. 7 |
Extended Data Fig. 7 |. ETV6 antagonizes EWS-FLI1 function at select DNA elements.
(a) Venn diagram showing the overlap between ETV6 and EWS-FLI1 peaks in A673 cells. (b)Western blot assessing EWS-FLI1 and ETV6 levels in A673 cells transduced with indicated dual-sgRNA constructs. (c)Western blot of EWSFLI1 and ETV6 in EWS-FLI1 reprogrammed RD cells. RD cells were transduced with EV (empty vector) control or EWS-FLI1 linked to indicated sgRNAs. (d) Metagene representation of the mean EWS-FLI1 signal differences at R sites versus microsatellites. (e) Metagene representation of the mean EWS-FLI1 signal differences at all ETV6 binding sites in A673 cells upon targeting ETV6. (f) Gene tracks of ETV6 and EWS-FLI1 ChIP-seq occupancy upon ETV6 knockout at DPEP1 and NTRK1 sites at two different scales. (g) Metagene representation of mean EWS-FLI1 ChIP-seq signal changes across R sites, microsatellites and all ETV6 binding regions in A673 cells upon targeting ETV6 using sgETV6 #2. (h) Western blot of ETV6 and EWS-FLI1 levels in patient-derived tumour cells (PSaRC219, left; PSaRC318, right) infected with indicated sgRNAs. ACTB was used as a loading control. (i) CellTiter Glo assay evaluating the effects of ETV6 knockout to proliferation in the patient-derived tumour cells (PSaRC219, left; PSaRC318, right). The relative luminescence fold changes (FC) to day 1 were plotted. Data are mean ± SEM. P values were calculated using two-way ANOVA. (n = 4 biological replicates) (j) EWS-FLI1 ChIP-qPCR analysis assessing the EWS-FLI1 occupancy changes at the ACTA2 site in the patient-derived Ewing tumour cells (PSaRC219 and PSaRC318) upon ETV6 knockout. A site 5 kb downstream of the ACTA2 site was used as a negative control. Data are mean ± SEM. P values were calculated using one-way ANOVA, Dunnett’s multiple comparison tests. (n = 3 biological replicates).
Extended Data Fig. 8 |
Extended Data Fig. 8 |. EWS-FLI1 does not bind to ETV6.
Immunoprecipitation assay showing ETV6 interacts with wild-type FLI1, but not EWS-FLI1 fusion. HEK293T cells were co-transfected with FLAG tagged ETV6 and HA tagged FLI1 or EWS-FLI1. FLAG IP was performed.
Extended Data Fig. 9 |
Extended Data Fig. 9 |. ETV6 oligomerization is essential in Ewing sarcoma.
(a) Illustration of ETV6 domain structure and SAM induction altering endogenous ETV6 function. (a.a: amino acid) (b) Western blot of A673 cells transduced with EV (empty vector), 3×FLAG tagged sgRNA resistant wild-type or (A94D, V113E) mutant ETV6 cDNA. Beta-ACTIN was used as a loading control. (c) Immunoprecipitation assay showing wild-type, but not (A94D, V113E) mutant SAM domain is able to associate with full-length ETV6. HEK293T cells were co-transfected with HA tagged ETV6 and FLAG tagged wild-type or (A94D, V113E) mutant SAM domain. FLAG IP was performed. (d) Western blot of A673 and RD cells transduced with Dox-inducible GFP or FLAG tagged SAM fragment. The samples were collected 48 hours after control or doxycycline treatment (1 μg/mL). ACTB was used as a loading control. (e) Metagene representation of the mean ETV6 and EWS-FLI1 signal changes upon SAM induction across microsatellites and all ETV6 binding sites. (f) Gene tracks of EWS-FLI1 ChIP-seq occupancy upon doxycycline treatment at ACTA2, DPEP1 and SOX11 sites in two different scales.
Fig. 1 |
Fig. 1 |. ETV6 is a dependency in Ewing sarcoma.
a, Summary of TF domain focused CRISPR screens. Plotted are 1,427 TFs ranked by preferential essentiality in Ewing sarcoma (n = 3) against all other cell lines (n = 26). The most Ewing sarcoma biased hits (ETV6 and FLI1) are labelled in red. b, Heat map of sgRNA abundance changes of two hits (ETV6 and FLI1) and two pan-essential controls (CTCF and MAX) in different cancer cell lines. RMS, rhabdomyosarcoma. c, Analysis of Ewing sarcoma biased essentiality using Project Achilles (21Q1) screening data. The P values compared gene effect scores in Ewing sarcoma (n = 16) versus other cancers (n = 792) using two-tailed unpaired Student’s t-test. d, Dependency scores of FLI1 and ETV6 on DepMap. Box plots indicate the distribution of dependency scores extracted from Project Achilles (21Q1) (CERES: a normalized metric of gene essentiality) of FLI1 (top) and ETV6 (bottom) across different cancer types. Box plot with centre line represents the median; lower and upper hinges indicate 25th and 75th percentiles; whiskers extend to 1.5 times the interquartile range (IQR). e, Competition-based proliferation assay of individual sgRNAs performed in Cas9-expressing cells. The expression of sgRNA is linked to a GFP reporter. The relative GFP percentage (normalized to P0) over culturing is plotted. An sgRNA targeting CDK1 was included as a positive control. sgNEG, negative control. Data are mean ± standard error of the mean (s.e.m.) (n = 3 biological replicates). f, Western blot of ETV6 and FLI1 (or EWS-FLI1) level across different cancer cell lines. β-Actin (ACTB) was included as a loading control. g, Western blot of ETV6 and EWS-FLI1 levels in A673 cells infected with indicated sgRNAs before subcutaneous injection. h, Average growth curves of EWS-FLI1 or ETV6 knockout A673 xenografts in immunodeficient mice. Differences in tumour volume were examined using simultaneous tests for general linear hypotheses of contrasts of interest. Data are mean ± s.e.m. P values were adjusted for multiple comparisons using the Bonferroni–Holm method (n = 5 tumours). i, Weight of the resected tumours at the end point. Data are mean ± s.e.m. Tumour weights were compared using one-way ANOVA test followed by pairwise comparisons using two-sample
Fig. 2 |
Fig. 2 |. ETV6 knockout in Ewing sarcoma drives mesenchymal differentiation.
a, Cell cycle analysis based on BrdU incorporation and DNA content (7-AAD) staining of A673 cells infected with indicated sgRNAs. Data are mean ± s.e.m. P values were calculated using one-way ANOVA, Dunnett’s multiple comparison tests (n = 3 biological replicates). b, Representative images of immunofluorescence staining for ETV6 (red), two mesenchymal differentiation markers: collagen I (green, left), α-SMA (green, right) and the cytoskeleton component F-actin (white) in A673 cells infected with indicated sgRNAs. Top: zoomed-in areas of F-actin and DAPI overlay. c, Quantification of cell size based on F-actin staining. The size of F-actin-stained area (μm2 ) per cell was quantified in each group. Data are mean ± s.e.m. P values were calculated using Kruskal– Wallis one-way ANOVA, Dunnett’s multiple comparison tests (sgNEG; n = 65 cells, sgETV6 #1; n = 58 cells; sgETV6 #2; n = 60 cells). d, Volcano plots showing the gene changes upon ETV6 knockout in three different Ewing sarcoma cell lines assessed by RNA-seq. Upregulated genes (log2FC >0.5, adjusted P value
Fig. 3 |
Fig. 3 |. ETV6-mediated transcriptional repression is essential in Ewing sarcoma.
a, Heat map representation of unsupervised hierarchical clustering of six cancer cell lines based on all the gene changes upon ETV6 knockout assessed by RNA-seq. Colour coding indicates Pearson correlation coefficient. b, Box plot showing the gene expression changes of common upregulated genes (log2FC >0.5) in three Ewing sarcoma cell lines across six different cancer cell lines (n = 80 genes). Box plot with centre line represents the median; lower and upper hinges indicate 25th and 75th percentiles; whiskers extend to 1.5 times the IQR. c, Volcano plot showing the expression changes upon ETV6 knockout of all the ETV6-bound genes, which were defined by expressed genes (in either control or ETV6 knockout cells) with a ETV6 peak nearby in A673 cells. ETV6- repressed genes (log2FC >0.5, adjusted P value
Fig. 4 |
Fig. 4 |. ETV6 antagonizes EWS-FLI1-mediated enhancer activation at select DNA elements.
a, Pie chart showing the percentage of ETV6 only, and ETV6 and EWS-FLI1 co-occupied R sites. b, Bottom: density plot showing the occupancy of ETV6 (blue) and EWS-FLI1 (purple) 5 kb surrounding the summit of R sites in A673 cells. The peaks were ranked by mean intensity within each condition. Top: metagene plots indicate the mean of ChIP–seq signal at R sites in each group. c, Metagene and density plots of ETV6 occupancy 5 kb surrounding the summits R sites in A673 cells upon EWS-FLI1 knockout. d, Box plots showing the expression changes of all the ETV6-repressed genes upon ETV6 knockout in A673 cells with or without EWS-FLI1. Cas9-expressing A673 cells were infected with a dual-sgRNA expression vector. All the gene expression changes were normalized to cells expressing sgNEG-sgNEG#2. Box plot with centre line represents the median; lower and upper hinges indicate 25th and 75th percentiles; whiskers extend to 1.5 times the IQR. P value was calculated using two-tailed unpaired Student’s t-test. e, Metagene and density plots of ETV6 occupancy 5 kb surrounding the summits R sites in RD cells with or without EWS-FLI1 induction. f, Box plots showing the expression changes of ETV6-repressed genes upon ETV6 knockout in RD cells with or without EWS-FLI1 induction. Box plot and P value are as described in d. g, Metagene representation of mean EWS-FLI1 ChIP–seq signal changes 5 kb surrounding the summits of R sites and microsatellites in A673 cells upon ETV6 knockout. The microsatellites were annotated by ETV6 peaks with (GGAA)≥4. h, Gene tracks of ETV6 and EWS-FLI1 ChIP–seq occupancy upon ETV6 knockout at three gene loci in two different scales.
Fig. 5 |
Fig. 5 |. ETV6 competes with EWS-FLI1 at short, interspersed GGAA repeats.
a, The underlying DNA sequences at EWS-FLI1 peak centre region near NR0B1, ACTA2 and SOX11. b, Scatter plot of all the EWS-FLI1 peaks ranked by the intensity changes upon ETV6 knockout in A673 cells. The competitive sites (n = 445) were defined by log2FC >2. c, The percentage of peaks with at least one (GGAA)n (left) and the average number of (GGAA)n per peak (right) were compared between competitive and all the EWS-FLI1 sites. Different lengths of GGAA repeat sequences were divided into four groups (n = 1, n = ~2–5, n = ~6–10 and n > 10). Fisher’s exact test was used to determine if there was a significant difference in the proportion of (GGAA)n between competitive and all groups. For the average number of (GGAA)n, P values were calculated using Mann–Whitney U test. d, Biotinylated DNA pulldown assay evaluating the competitive binding between ETV6 and EWS-FLI1 to different DNA probes. The same amount of HA-tagged EWS-FLI1 with increasing levels of FLAG-tagged ETV6 were incubated with microsatellites-like (left) or interspersed GGAA (right) DNA probes. The protein pulled down by each probe was evaluated using western blot.
Fig. 6 |
Fig. 6 |. Squelching of ETV6 with a SAM domain reprogrammes EWS-FLI1 occupancy and blocks Ewing sarcoma growth in vivo.
a, Immunoprecipitation assay showing ETV6 (A94D and V113E) mutant is defective for selfoligomerization. b, Competition-based proliferation assay in A673 cells harbouring empty vector, sgRNA-resistant 3× FLAG-tagged wild-type or (A94D and V113E) mutant ETV6 cDNA and infected with a control (sgNEG), CDK1 or ETV6 sgRNA. Data are mean ± s.e.m (n = 3 biological replicates). c, Competition-based proliferation assay evaluating the effects of different ETV6 fragments induction to cell fitness in A673 and RD cells. The expression of FLAG-tagged ETV6 SAM fragment is linked to a GFP reporter. Data are mean ± s.e.m. (n = 3 biological replicates). d, CellTiter-Glo assay evaluating the effects of SAM induction to A673 and RD cell proliferation in vitro. The relative luminescence FCs to day 1 were plotted. Data are mean ± s.e.m. P values were calculated using two-way ANOVA (n = 3 biological replicates). e, Metagene representation of the mean ETV6 and EWS-FLI1 signal changes upon ETV6 SAM induction across R sites. f, Volcano plot showing the gene expression changes upon ETV6 SAM induction in A673 cells. The ETV6 repressed (red) and activated (blue) genes were defined on the basis of the genetic knockout of ETV6 in the same cell line. g, Average growth curves of Dox-inducible GFP- or SAM-expressing A673 xenografts in immunodeficient mice. The mice in Dox groups were put on Dox food on day 10 post injection. Linear mixed-effects model with treatment, time and treatment by time interaction as fixed effects and sample specific random intercept was used to fit the longitudinal tumour volume data. Differences in tumour volume were examined using simultaneous tests for general linear hypotheses of contrasts of interest. Data are mean ± s.e.m. P values were adjusted for multiple comparisons using the Bonferroni–Holm’s method (n = 15 tumours). h, Weights of the resected tumours at the end point. Data are mean ± s.e.m (n = 15 tumours). i, Model of EWS-FLI1 imposed ETV6 dependency in Ewing sarcoma.

Comment in

  • Oncogenic role for an EWS-FLI1 suppressor.
    Apfelbaum AA, Lawlor ER. Apfelbaum AA, et al. Nat Cell Biol. 2023 Feb;25(2):214-216. doi: 10.1038/s41556-022-01067-8. Nat Cell Biol. 2023. PMID: 36658218 No abstract available.

References

    1. Ewing J Diffuse endothelioma of bone. Ca Cancer J Clin 22, 95–98 (1972). - PubMed
    1. Grünewald TGP et al. Ewing sarcoma. Nat Rev Dis Primers 4, 5 (2018). - PubMed
    1. Stahl M et al. Risk of recurrence and survival after relapse in patients with Ewing sarcoma. Pediatr Blood Cancer 57, 549–553 (2011). - PubMed
    1. Gaspar N et al. Ewing Sarcoma: Current Management and Future Approaches Through Collaboration. J Clin Oncol 33, 3036–3046 (2015). - PubMed
    1. Zucman J et al. Cloning and characterization of the Ewing’s sarcoma and peripheral neuroepithelioma t(11;22) translocation breakpoints. Genes Chromosomes Cancer 5, 271–277 (1992). - PubMed

Publication types

MeSH terms

Substances