. 2023 Feb;25(2):285-297.
doi: 10.1038/s41556-022-01059-8. Epub 2023 Jan 19.

The ETS transcription factor ETV6 constrains the transcriptional activity of EWS-FLI to promote Ewing sarcoma

Affiliations

The ETS transcription factor ETV6 constrains the transcriptional activity of EWS-FLI to promote Ewing sarcoma

Diana Y Lu et al. Nat Cell Biol. 2023 Feb.

Abstract

Transcription factors (TFs) are frequently mutated in cancer. Paediatric cancers exhibit few mutations genome-wide but frequently harbour sentinel mutations that affect TFs, which provides a context to precisely study the transcriptional circuits that support mutant TF-driven oncogenesis. A broadly relevant mechanism that has garnered intense focus involves the ability of mutant TFs to hijack wild-type lineage-specific TFs in self-reinforcing transcriptional circuits. However, it is not known whether this specific type of circuitry is equally crucial in all mutant TF-driven cancers. Here we describe an alternative yet central transcriptional mechanism that promotes Ewing sarcoma, wherein constraint, rather than reinforcement, of the activity of the fusion TF EWS-FLI supports cancer growth. We discover that ETV6 is a crucial TF dependency that is specific to this disease because it, counter-intuitively, represses the transcriptional output of EWS-FLI. This work discovers a previously undescribed transcriptional mechanism that promotes cancer.


Conflict of interest statement

K.S. receives grant funding from the DFCI/Novartis Drug Discovery Program and from KronosBio, is a member of the SAB and has stock options with Auron Therapeutics and has consulted for AstraZeneca. S.L.L. declares a competing interest as a member of the advisory board for Salarius Pharmaceuticals and is a listed the inventor on US patent no. US 7,939,253 B2, ‘Methods and compositions for the diagnosis and treatment of Ewing’s sarcoma’ and US patent no. US 8,557,532, ‘Diagnosis and treatment of drug-resistant Ewing’s sarcoma.’ N.V.D. is an employee of Genentech, a member of the Roche Group. N.S.G. is a founder, scientific advisory board member and equity holder in Syros, C4, Allorion, Jengu, B2S, Inception, EoCys, Larkspur (board member) and Soltego (board member). The remaining authors declare no competing interests.

Figures
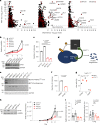
Fig. 1
Fig. 1. The repressive ETS TF ETV6 is a selective dependency in Ewing sarcoma cells.
a, Scatter plot depicting 18,333 genes interrogated in the DepMap CRISPR–Cas9 screen. –log10(q value) of enrichment (x axis) measures the specificity of dependency for each tumour type (Ewing, n = 14; neuroblastoma, n = 20; rhabdomyosarcoma, n = 11). –log10(q value) of enrichment (y axis) measures the specificity of gene expression for each tumour type (Ewing, n = 20; neuroblastoma, n = 28; rhabdomyosarcoma, n = 18). TF genes are red and labelled if x > 8 (except ZEB2 = 3.28). Dashed lines show –log10(0.05). b, Top: line graph depicting mean cell viability ± s.e.m. in A673 Ewing sarcoma cells transduced with CRISPR–Cas9 constructs targeting ETV6 (sgETV6-1 to sgETV6-4) or control single guide RNAs (sgChr2.2 cutting; sgLacZ non-cutting) (n = 8 biological replicates, two-way analysis of variance (ANOVA), Dunnett’s multiple comparisons, P adjusted < 0.0001). Represents two independent experiments. Bottom: western blot shows ETV6 with GAPDH loading control. c, Bar plot showing mean ± s.e.m. number of A673 cell colonies in methylcellulose. ETV6 loss reduced the colony number (one-way ANOVA, n = 3 biological replicates, Sidak’s multiple comparisons, P adjusted < 0.0001). Represents two independent experiments. d, Schematic of the dTAG approach used to study ETV6. Ub, ubiquitin; VHL, von Hippel–Lindau. e, Western blot demonstrating ETV6–FKBP12F36V–HA protein degradation and endogenous ETV6 knockout in A673 ETV6–dTAG cells treated with dTAGV-1 or DMSO for 6 h. Parental A673 lysates are shown on the left. Represents one experiment. f, Bar plot showing mean ± s.e.m. number of A673 ETV6–dTAG cell colonies in methylcellulose (n = 3 biological replicates, two-tailed t-test, P < 0.0001). Represents two independent experiments. g, Cell cycle analysis of A673 ETV6–dTAG cells treated for 72 h with DMSO or dTAGV-1 (n = 3 biological replicates, two-tailed t-test, Sidak’s multiple comparisons; G1/G0 phase, P adjusted = 5.20 × 10−8; S phase, P adjusted =4.16 × 10−7). Represents two independent experiments. h, Left: western blot of A673 cells implanted intramuscularly. Right: mean total body bioluminescence (±s.e.m.) (n = 5 mice per condition, biological replicates). ETV6 loss reduced tumour growth compared with sgChr2.2 (two-way ANOVA, Tukey’s multiple comparisons; sgETV6-1, P adjusted = 0.0363; sgETV6-2, P adjusted = 0.0254). i, Mean ± s.e.m. log(bioluminescence) measurements of ex vivo resected liver and lung (n = 5). sgLacZ livers exhibited greater bioluminescence than sgETV6-1 (Kruskal–Wallis test, Dunn’s multiple comparisons; P adjusted = 0.0418) or sgETV6-2 livers (P adjusted = 0.0028). sgLacZ lungs exhibited greater bioluminescence than sgETV6-2 (P adjusted = 0.0333) but not sgETV6-1 lungs (not significant (NS), P adjusted = 0.2763). Key is the same as h. Source data
Fig. 2
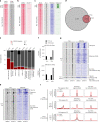
Fig. 2. Acute loss of ETV6 leads to increased EWS–FLI binding.
ac, Heatmaps showing 3-kb windows centred at 3,309 consensus ETV6-binding sites, subplotted by overlap within 2.5 kb of transcription start sites (TSSs) and peaks ranked by maximum height. a, Left: CUT&Tag (C&T) of endogenous ETV6 in A673 parental cells. Right: anti-HA ChIP-seq of ETV6–FKBP12F36V–HA in EW8 ETV6–dTAG cells. b, Anti-HA CUT&Tag in A673 ETV6–dTAG cells treated with DMSO or dTAGV-1 for 24 h. c, Left to right: endogenous ETV6 CUT&Tag, EWS–FLI ChIP-seq, H3K27ac ChIP-seq and published H3K4me3 ChIP-seq in A673 cells. d, Venn diagram showing genomic locations of ETV6 consensus binding sites versus 30,030 EWS–FLI binding sites in A673 cells. e, Stacked column plot showing varying lengths of tandem 5′-GGAA-3′ motif repeats occurring at binding sites detected by (left to right): (1) endogenous ETV6 CUT&Tag in parental A673 cells; (2) ETV6–FKBP12F36V–HA ChIP-seq in A673 ETV6–dTAG cells; (3) EWS–FLI ChIP-seq in parental A673 cells; (4) ETV6–FKBP12F36V–HA ChIP-seq in EW8 ETV6–dTAG cells; (5) EWS–FLI ChIP-seq in parental EW8 cells; (6) and (7) endogenous ETV6 ChIP-seq in GM12878 B lymphocyte lymphoblastoid cells,; and (8) endogenous ETV6 ChIP-seq in K-562 chronic myelogenous leukaemia cells. Number of binding sites in each dataset is shown. ETV6 bound to a higher percentage of >4 GGAA repeats in Ewing sarcoma compared to B lymphocyte ETV6 (2018) (A673 ETV6 C&T, P < 1 × 10−300; A673 ETV6 ChIP-seq, P = 5.41 × 10−214; and EW8 ETV6, P = 1.34 × 10−18; Fisher’s exact tests). f, Bar plots showing the number of genomic regions exhibiting significantly altered EWS–FLI binding at 6 or 72 h following ETV6 degradation identified by CSAW (CSAW using the edgeR generalized linear model; P < 0.05). FLI1 up sites exhibited increased EWS–FLI binding. FLI1 down sites exhibited decreased EWS–FLI binding. g,h, Heatmaps of EWS–FLI and H3K27ac ChIP-seq performed in EW8 ETV6–dTAG (g) and A673 ETV6–dTAG cells (h) at 6 h following DMSO or dTAGV-1 treatment. Loci exhibiting significantly altered EWS–FLI binding are subplotted by direction of change (up or down) and overlap with TSS, enhancer or neither. Enhancer locations were defined using H3K27ac ChIP-seq in parental EW8 (g) and A673 (h) cells. i, Metaplots of FLI1 binding at regions shown in g and h.
Fig. 3
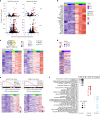
Fig. 3. ETV6 is primarily a transcriptional repressor in Ewing sarcoma.
a, RNA-seq volcano plot in A673 ETV6–dTAG and EW8 ETV6–dTAG cells treated with DMSO or dTAGV-1 for 6 and 72 h (n = 3 biological replicates). Red indicates genes upregulated in dTAGV-1-treated cells (DESeq2 Wald test Benjamini–Hochberg P adjusted < 0.05; A673: n = 423 at 6 h and 2,554 at 72 h; EW8: n = 123 at 6 h and 1,614 at 72 h). Blue indicates genes downregulated in dTAGV-1-treated cells (P adjusted < 0.05; A673: n = 221 at 6 h and 2,556 at 72 h; EW8: n = 67 at 6 h and 1,208 at 72 h). b, Row-normalized RNA-seq log2(transcripts per million (TPM) + 1) heatmap of the 25 most differentially repressed genes in A673 ETV6–dTAG cells, identified from 6-h data, ranked by P value (DESeq2 P adjusted < 0.05 and log2(fold change) > 1.5). c, Top left: Venn diagram of genes identified as ETV6-repressed in A673 ETV6–dTAG (423 genes) and EW8 ETV6–dTAG cells (123 genes) at 6 h (P adjusted < 0.05), identifying 85 common ETV6-repressed genes. Bottom: row-normalized RNA-seq log2(TPM + 1) heatmap of 85 common ETV6-repressed genes in A673 ETV6–dTAG and EW8 ETV6–dTAG cells. d. Row-normalized log2(TPM + 1) RNA-seq heatmap of 85 ETV6-repressed genes, ranked as shown in c, in parental A673 cells transduced with CRISPR–Cas9 vectors, identifying 53 ETV6-repressed genes using this approach (one-sided hypergeometric test, P = 2.66 × 10−20). e, Top: gene set enrichment analysis (GSEA) plots of ETV6-bound genes enriched in ETV6-regulated genes in A673 ETV6–dTAG and EW8 ETV6–dTAG cells. ETV6-bound genes were defined by CUT&Tag and ChIP-seq in A673 cells and by ChIP-seq in EW8 cells. ETV6-regulated genes were defined by RNA-seq at 24 h. Bottom: RNA-seq heatmaps of ETV6-repressed core enrichment genes. ES, enrichment score; FDR, false discovery rate; NES, normalized enrichment score. Colour coding for time and treatment is the same as in c. f, Combined enrichment plot of MSigDB c2 pathways significantly enriched in ETV6-repressed genes defined by RNA-seq at 24 h common to both models (hypergeometric enrichment test, P < 0.05). Gene sets are ranked by significance. Dot size indicates the number of genes in the overlap between the gene set and common ETV6-repressed genes at 6, 24 and 72 h (85, 251 and 832 genes, respectively). Missing dots indicate non-significance. ‘EWS–FLI’, ‘HDAC’ and ‘Lineage’ gene sets characterize genes regulated by EWS–FLI, genes regulated by histone deacetylase enzymes, and genes underlying tissue-specific development or function, respectively.
Fig. 4
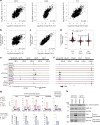
Fig. 4. ETV6 constrains EWS–FLI-induced gene expression.
ac, Lines indicate Pearson correlation; Pearson correlation value (R) is shown. a, Left and middle: scatter plots of log2(fold change) in EWS–FLI binding at 6 and 72 h following DMSO or dTAGV-1 treatment in A673 and EW8 ETV6-dTAG cells (n = 2 biological replicates). Right: scatter plot comparing models. b, Scatter plot comparing log2(fold change) in EWS–FLI binding to H3K27ac abundance detected by 6 h ChIP-seq in A673 ETV6–dTAG cells (n = 2 biological replicates). c, Scatter plot comparing log2(fold change) in EWS–FLI binding in assay of transposase accessible chromatin sequencing (ATAC-seq) experiments (n = 3 biological replicates) at 72 h in A673 ETV6–dTAG cells. d, Plot comparing genes mapped from altered EWS–FLI binding sites (CSAW, n = 2 biological replicates) to log2(fold change) in expression measured by RNA-seq in A673 ETV6–dTAG cells (n = 3 biological replicates) at 72 h. Grey boxes indicate median and first and third quartiles. Red diamond and error bars indicate mean expression ± s.d. (FLI1 up, n = 148, mean = 0.98; FLI1 down, n = 542, mean = –0.19; no change, n = 4,585, mean = 0.028). P values calculated using paired t-test, Benjamini–Hochberg corrections. e,f, Gviz-generated views of the FAS–ACTA2 (e) and TRIB1 (f) loci. ETV6 tracks show CUT&Tag of ETV6–FKBP12F36V–HA in A673 ETV6–dTAG cells at 24 h. FLI1 tracks show ChIP-seq for EWS–FLI performed at 6 h, H3K27ac tracks show ChIP-seq for H3K27ac at 6 h and ATAC tracks show ATAC-seq at 72 h. FLI1 (EW8) tracks show ChIP-seq for EWS–FLI at 6 h in EW8 ETV6–dTAG cells. GGAA tracks indicate locations of tandem GGAA motif repeats. g, Top: bar plots showing qPCR in A673 ETV6–dTAG cells transduced with CRISPR–Cas9 constructs targeting control (sgChr2.2) or EWS–FLI (sgFLI) and treated for 24 h with DMSO (black) or dTAGV-1 (red). Bars indicate mean 2−∆∆Ct of n = 2 biological duplicates, each representing the mean of technical triplicates. h, Western blot A673 ETV6–dTAG cells shown in g treated with DMSO or dTAGV-1 for 96 h. Source data
Fig. 5
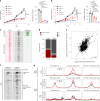
Fig. 5. ETV6 competes with EWS–FLI for binding in clinically relevant Ewing sarcoma models.
a,b, Cell growth in the newly derived Ewing sarcoma cell lines PEDS0009 (a) and PEDS0010 (b) following CRISPR–Cas9 knockout of ETV6 (red) or EWS–FLI (blue) compared to sgChr2.2 and sgLacZ controls (black). Line graphs show mean cell viability ± s.e.m. (n = 6 biological replicates); knockout of ETV6 and EWS–FLI reduced viability in both lines compared to sgChr2.2 (two-way ANOVA, Tukey’s multiple comparisons, P adjusted < 0.0001). Bar plots show mean cell colony number ± s.e.m. (n = 3 biological replicates) in methylcellulose; ETV6 and EWS–FLI knockout reduced colony number in PEDS0009 cells (one-way ANOVA, Tukey’s multiple comparisons, P adjusted < 0.0001 for all comparisons indicated) and PEDS0010 cells (sgLacZ versus sgETV6-1, P adjusted = 0.0161, sgETV6-2, P adjusted = 0.0029, sgFLI, P < 0.0001; sgChr2.2 versus sgETV6-1, NS P adjusted = 0.1120, sgETV6-2, P adjusted = 0.0182, sgFLI, P adjusted = 0.0003). c, Heatmaps showing 3-kb windows centred at 3,309 consensus ETV6 binding sites, subplotted by overlap within 2.5 kb of TSSs. PEDS0009 cells were transduced with sgChr2.2 control CRISPR–Cas9 constructs and profiled by CUT&Tag to detect endogenous ETV6 (left) and CUT and release using nuclease (CUT&RUN) to detect EWS–FLI (middle) and the histone mark H3K4me3 (right). d, Stacked column plot showing varying lengths of tandem 5′-GGAA-3′ motif repeats occurring at ETV6 (left) and EWS–FLI (right) binding sites in PEDS0009 cells. e, Scatter plots of log2(fold change) in EWS–FLI binding in A673 ETV6–dTAG cells following 72 h of ETV6 degradation (y axis) compared to CRISPR–Cas9-transduced PEDS0009 cells with knockout of ETV6 (x axis). Line indicates Pearson correlation; Pearson correlation value (R) is shown. f, Heatmaps of FLI1 CUT&RUN performed in control or ETV6 knockout PEDS0009 cells. Loci shown are defined in Fig. 2h as regions that exhibited increased EWS–FLI binding following ETV6 loss in A673 ETV6–dTAG cells. g, Metaplots of FLI1 binding in control or ETV6 knockout PEDS0009 cells at genomic regions shown in f (top). Metaplots of FLI1 binding at loci defined in Fig. 2g as regions that exhibited increased EWS–FLI binding 72 h following ETV6 degradation in EW8 ETV6–dTAG cells. Source data
Fig. 6
Fig. 6. Knockout of the ETV6-repressed gene SOX11 rescues the phenotype of ETV6 loss.
a, Left: Gviz-generated view of the SOX11 locus. Top four tracks show data generated in A673 ETV6–dTAG cells: ETV6, 24 h ETV6-FKBP12F36V–HA CUT&Tag; FLI1, 6 h EWS–FLI ChIP-seq; H3K27ac, 6 h H3K27ac ChIP-seq; ATAC, 72 h ATAC-seq. FLI1 (EW8) shows 6 h EWS–FLI ChIP-seq in EW8 ETV6–dTAG cells. ETV6 (PEDS0009) and FLI1 (PEDS0009) show CUT&Tag for ETV6 and EWS–FLI, respectively, in PEDS0009 cells. GGAA shows tandem GGAA motif repeats. The red arrowhead indicates an enhancer region assigned to SOX11, the nearest expressed gene; SILC1 and LOC400940 are not expressed and labeled in grey. Right: magnified view of the enhancer. b, SOX11 expression by qPCR, as described in Fig. 4g. c, Western blot of cells shown in b at 96 h. HA, EWS–FLI, GAPDH bands are also shown in Fig. 4h. d, Western blot of sgChr2.2-transduced or sgSOX11-transduced A673 ETV6–dTAG cells cultured in DMSO or dTAGV-1. Represents two independent experiments. e, Left: cells in d stained with crystal violet. Right, top: bar plots showing mean ± s.e.m. of median stain intensity per well (one-way ANOVA, n = 3 biological replicates, Sidak’s multiple comparisons; DMSO versus dTAGV-1 sgChr2.2, P adjusted < 0.0001, sgSOX11, P adjusted = 0.0459; sgChr2.2 versus sgSOX11 dTAGV-1, P adjusted < 0.0001). Right, bottom: relative median intensity comparing dTAGV-1-treated with DMSO-treated wells (two-tailed t-test, n = 3, P < 0.0001). Represents two independent experiments. f, Western blot of TC32 cells transduced with CRISPR–Cas9 constructs in combination. Represents one experiment. g, Line graph depicting mean viability in vitro (n = 6 biological replicates, s.e.m. bars too small to depict) of cells in f. ETV6 knockout alone (red) reduced viability compared to control (black) (two-way ANOVA, Tukey’s multiple comparisons, P adjusted < 0.0001). Simultaneous ETV6 and SOX11 knockout (blue star) did not reduce viability compared to SOX11 knockout alone (grey) (NS, P adjusted = 0.8847) and exhibited greater viability than ETV6 knockout alone (red) (P adjusted < 0.0001). h, Left: Line graph depicting mean subcutaneous tumour volume (mm3) ± s.e.m. (n = 6 tumours, biological replicates) formed by cells shown in f. ETV6 knockout alone reduced tumour volume (two-way ANOVA, Tukey’s multiple comparisons, P adjusted < 0.0001). Simultaneous ETV6 and SOX11 knockout did not reduce tumour growth (NS, P adjusted = 0.9892) and exhibited greater growth than ETV6 knockout alone (P adjusted < 0.0001). Right: representative tumours from each condition. Source data
Extended Data Fig. 1
Extended Data Fig. 1. The repressive ETS transcription factor, ETV6, is a selective dependency in Ewing sarcoma cells.
a. Volcano plot of genes in the DepMap screen in Ewing sarcoma cell lines (n = 14) compared to all other cell lines (n = 782). Effect size (x-axis) indicates the impact of gene deletion on growth. Log10(q-value) (y-axis) indicates specificity of dependency in Ewing sarcoma. Blue marks known selective TF dependencies. b. Venn diagram of Ewing sarcoma selective TF dependencies in the DepMap, GeCKO, and Sanger CRISPR/Cas9 screens. c. Scaled rank plot depicting all cell lines in DepMap. Gene effect (x-axis) measures ETV6 deletion impact in each cell line. Ewing lines are enlarged and color-coded by specific EWS/ETS fusion (EWS/FLI n = 11, EWS/ERG n = 2, EWS/FEV n = 1). d and e. Expression (log2(TPM + 1); TPM, transcripts per million) of ETV6 (d) and BCL11B, ZEB2 (e) in primary tumors (Treehouse Childhood Cancer Initiative, Ewing sarcoma n = 85; other n = 12,571). Points show the full range between maxima and minima. Boxes show values for the 25th and 75th percentiles; middle line shows median (50th percentile). Whiskers extend no further than 1.5 times the inter-quartile range. Gene expression in Ewing sarcoma was different from other tumor types (Welch 2sample T-test, ETV6 p = 2.067 × 10−15, ZEB2 p = 4.995 × 10−31, BCL11B p = 1.515 × 10−37). f. Line graphs depicting mean cell viability ±SEM in Ewing sarcoma cell lines (n = 8 biological replicates). ETV6 knock-out cells exhibited lower viability than control (2way ANOVA, Dunnett multiple comparisons EW8 p-adj<0.0001; TC32 p-adj<0.0001). Represents two independent experiments. Westerns show ETV6 and GAPDH loading control (kDa, kiloDaltons). g. Bar plots showing mean ±SEM number of methylcellulose cell colonies. ETV6 knock-out samples formed fewer colonies (EW8 two-tailed t-test, n = 4 biological replicates, p = 0.0001; TC32 two-tailed t-test, n = 4 biological replicates, p = 0.0052). h. (Left) Bar plot showing mean ±SEM number of EW8 ETV6-dTAG cell colonies. dTAGV-1-treated cells formed fewer colonies than control (n = 3 biological replicates, two-tailed t-test, p < 0.0001). (Right) Western blot of dTAG cells shown here and in Fig. 1f. Source data
Extended Data Fig. 2
Extended Data Fig. 2. ETV6 promotes growth in Ewing sarcoma cells.
a. Cell cycle analysis in EW8 ETV6-dTAG cells treated for 96 hours with DMSO or dTAGV-1 (n = 3 biological replicates, two-tailed t-test, Sidak’s multiple comparisons, G1/G0 p-adjust=0.002, S p-adj=1.8 × 10−5). b. (Left) Cell cycle analysis in A673 cells transduced with CRISPR/Cas9 constructs (n = 3 biological replicates, two-tailed t-test, Sidak’s multiple comparisons, G1/G0 p-adjust=2.25 × 10−11, S p-adj=4.47 × 10−11). (Right) Western blot of ETV6. c. Western blot of A673 and EW8 ETV6-dTAG cells treated with 1 µM cisplatin (as a positive control) for 24 hours or with DMSO or dTAGV-1 for 72 hours. Represents one independent experiment. d. (Left) Mean subcutaneous tumor volume in cubic millimeters ±SEM (n = 5, biological replicates) in mice implanted with CRISPR/Cas9-transduced TC32 cells (2-way ANOVA, p = 0.0191). (Right) Western blot showing ETV6. e. Western blots detecting exogenous expression of wild-type ETV6 protein (ETV6-WT) or mutant ETV6 harboring an ETS DNA binding domain deletion (ETV6-ΔETS) in cytosolic (Cyt), nuclear (Nuc), and chromatin (Chrom) subcellular fractions in A673 (left) and EW8 (right) cell lines. Vinculin and Histone 3 demonstrate the quality of fractionation. Represents one independent experiment. f. Line graphs depicting mean cell viability ±SEM (n = 4 biological replicates) in A673 and EW8 cells transduced with control (sgChr2.2, black) or ETV6-targeting (sgETV6, red) CRISPR/Cas9 constructs and expressing doxycycline-induced wild-type ETV6 (ETV6-WT) or ETS DNA binding domain-deleted ETV6 (ETV6-ΔETS). Cells were treated with either vehicle (circles, solid lines) or doxycycline (squares, dashed lines). Knockout of ETV6 alone reduced cell viability (2-way ANOVA, Tukey’s multiple comparisons, A673 p-adj=0.0169; EW8 p-adj=0.0060). ETV6 knockout in combination with wild-type ETV6 exogenous expression did not alter cell viability (ns, A673 p-adj=0.9769; EW8 p-adj=0.0972), but ETV6 knockout in combination with DBD-deleted ETV6 expression reduced cell viability (A673 p-adj=0.0003; EW8 p-adj<0.0001). Source data
Extended Data Fig. 3
Extended Data Fig. 3. Acute loss of ETV6 leads to increased EWS/FLI binding.
a. (Left) Heatmaps of endogenous ETV6 CUT&Tag in parental A673 cells using two commercial antibodies and anti-ETV6-FKBP12F36V-HA ChIP-seq in A673 ETV6-dTAG cells. Shown are ETV6 consensus binding sites sub-plotted by TSS overlap, ranked by height. (Right) Venn diagram showing that consensus binding sites were detected in at least 2 data sets. b. Heatmaps at consensus binding sites detected by anti-HA ChIP-seq in EW8 ETV6-dTAG cells at 24 hours DMSO or dTAGV-1 treatment. c. (Left to right): Anti-HA ChIP-seq in EW8 ETV6-dTAG cells, anti-FLI1 ChIP-seq in parental EW8 cells, anti-H3K27ac ChIP-seq in parental EW8 cells. d. Venn diagram showing overlap between 718 ETV6-FKBP12F36V-HA binding sites in EW8 ETV6-dTAG cells and 16,525 EWS/FLI binding sites in parental EW8 cells. e. Log2(TPM + 1) expression of ETV6 in Ewing sarcoma cell lines (n = 21) and the K-562 leukemia cell line (n = 1) from CCLE. Specific cell lines are in red. Points show the full range between maxima and minima. Boxes show values for the 25th and 75th percentiles; middle line shows median (50th percentile). Whiskers extend no further than 1.5 times the inter-quartile range. f. Metaplots of H3K27ac abundance at regions shown in Fig. 3g, h. g. Stacked column plot showing varying lengths of tandem 5′-GGAA-3′ motif repeats occurring at genomic regions exhibiting significantly altered EWS/FLI binding (CSAW using the edgeR generalized linear model; p < 0.05) in A673 or EW8 dTAG cells at 72 hours. The number of peaks in each data set is listed. No genomic regions lost EWS/FLI binding in A673 dTAG at 6 hours. At 72 hours, regions that gained EWS/FLI binding were enriched for repeats of 2, 3, and 4 compared to regions that lost EWS/FLI binding (Fisher exact test, A673 p = 6.974 × 10−15, EW8 p = 1.15 × 10−15).
Extended Data Fig. 4
Extended Data Fig. 4. ETV6 is primarily a transcriptional repressor in Ewing sarcoma.
a. Western blot of EW8 ETV6-dTAG cells treated for 6 hours with DMSO or dTAGV-1. Represents one experiment. b. t-SNE of RNA-seq expression in parental Ewing sarcoma cell lines from the Cancer Cell Line Encyclopedia (CCLE) and in A673 ETV6-dTAG and EW8 ETV6-dTAG cells treated for 6 hours with DMSO. EW8 parental and EW8 ETV6-dTAG cell samples are blue. A673 parental and A673 ETV6-dTAG cell samples are red. c. Gene set enrichment analysis (GSEA) of ETV6-repressed genes identified at 6 hours in A673 ETV6-dTAG compared to EW8 ETV6-dTAG RNA-seq data at 6 hours (top) and vice versa (bottom). d. Western blot of A673 parental cells transduced with sgChr2.2, sgLacZ, and sgETV6 CRISPR/Cas9 constructs. Represents one independent experiment. e. RNA-seq mean Log2(TPM + 1) for 81 of 85 ETV6-repressed genes, compared to all other genes, across Ewing sarcoma cell lines in CCLE. Boxes show the values for the 25th and 75th percentiles; middle line shows the median (50th percentile). Whiskers extend up from the 75th percentile and down from the 25th percentile, no further than 1.5*IQR (where IQR is the inter−quartile range, or distance between the 25th and 75th percentiles). Points show the full range between maxima and minima. f. RNA-seq heatmap of ETV6-activated core enrichment genes, identified by GSEA described in Fig. 3e, in A673 (68 genes) and EW8 dTAG cells (126 genes). g. Combined enrichment plot of MSigDB c2 pathways enriched in ETV6-activated genes in both dTAG models (24-hour RNA-seq, hypergeometric enrichment test; p < 0.05). Gene sets are ranked by significance; missing dots indicate insignificance. Dot size indicates the number of ETV6-activated genes at 6, 24, and 72 hours also in the gene set (33, 130, and 543 genes, respectively). ‘EWS/FLI’, ‘HDAC’, and ‘Lineage’ gene sets characterize EWS/FLI-regulated genes, histone deacetylase enzyme-regulated genes, and genes exhibiting tissue-specific expression, respectively.
Extended Data Fig. 5
Extended Data Fig. 5. ETV6 constrains EWS/FLI-induced gene expression.
a. Scatter plot comparing log2 fold-change in EWS/FLI binding to log2 fold-change in H3K27ac abundance detected by ChIP-seq at 6 hours in EW8 ETV6-dTAG cells (n = 2 biological replicates). Pearson correlation value (R) is shown. b. Plot comparing genes mapped from significantly altered EWS/FLI binding sites (n = 2 biological replicates) to Log2 Fold-change in expression measured by RNA-seq in EW8 ETV6-dTAG cells (n = 3 biological replicates) at 72 hours. Gray boxes indicate median and first and third quartiles. Red diamond and error bars indicate mean expression ±standard deviation (FLI1 Up n = 404 mean=0.3; FLI1 Down n = 1,042 mean = -0.062; No Change n = 8,252 mean=0.033). FLI1 Up vs. No Change p = 1.99e-12, FLI1 Down vs. No Change p = 2.81e-18, paired t-test, Benjamini-Hochberg corrections. c and d. Gviz-generated views of the SEMA5B (c) and BCL11B (d) loci. ETV6 tracks show CUT&Tag of ETV6-FKBP12F36V-HA in A673 ETV6-dTAG cells at 24 hours. FLI1 tracks show ChIP-seq for EWS/FLI performed at 6 hours, H3K27ac tracks show ChIP-seq for H3K27ac at 6 hours, and ATAC tracks show ATAC-seq at 72 hours. FLI1 (EW8) tracks show ChIP-seq for EWS/FLI at 6 hours in EW8 ETV6-dTAG cells. GGAA tracks indicate locations of tandem GGAA motif repeats.
Extended Data Fig. 6
Extended Data Fig. 6. ETV6 competes with EWS/FLI for binding in clinically relevant Ewing sarcoma models.
a and b. Western blot of cells from the newly derived Ewing sarcoma cell lines, PEDS0009 (a) and PEDS0010 (b), transduced with CRISPR/Cas9 constructs. Represents one independent experiment. c. (Left) Western blot of cells from the Ewing sarcoma patient-derived xenograft, ES-PDX-001, transduced with CRISPR/Cas9 constructs. (Right) Line graphs depicting mean cell viability ±SEM in vitro (n = 6 biological replicates). Knockout of ETV6 and EWS/FLI reduced cell growth compared to sgChr2.2 control (2-way ANOVA, Tukey’s multiple comparisons, p-adj = <0.0001). d. Heatmaps showing 3-kilobase (kb) windows centered at 3,309 consensus ETV6 binding sites, sub-plotted by overlap within 2.5 kb of transcription start sites (TSS). Shown are ETV6 peaks detected in sgChr2.2 control and ETV6-knockout PEDS0009 cells profiled by CUT&RUN. e. Scatter plots of log2 fold-change in EWS/FLI binding in EW8 ETV6-dTAG cells following 72 hours of treatment with DMSO or dTAGV-1 (y-axis) and in control and ETV6-knockout PEDS0009 cells profiled by FLI1 CUT&RUN (x-axis). Pearson correlation value (R) is shown. f. Heatmaps of FLI1 CUT&RUN performed in control and ETV6-knockout PEDS0009 cells. Loci shown were defined in Fig. 2g as regions that exhibited increased EWS/FLI binding upon ETV6 loss in EW8 ETV6-dTAG cells. g. Stacked column plot showing varying lengths of tandem 5′-GGAA-3′ motif repeats occurring at genomic regions exhibiting significantly (CSAW; p < 0.05) increased (FLI1 Up) or decreased (FLI1 Down) EWS/FLI occupancy in PEDS0009 cells upon ETV6 knockout. FLI1 Up regions were more likely than FLI1 Down regions to contain GGAA repeats of 2, 3, or 4 (Fisher Exact test, p = 5.186e-11). Source data
Extended Data Fig. 7
Extended Data Fig. 7. Knock-out of the ETV6-repressed gene, SOX11, rescues the phenotype of ETV6 loss.
a. Top 100 significantly enriched MSigDB c5 Gene Ontology gene set categories in ETV6-repressed genes (24-hour RNA-seq, A673 ETV6-dTAG, parentheses show gene set number; full list in Supplementary Table 19). b. Line graphs depicting mean viability ±SEM (n = 8 biological replicates) in A673 (left) and EW8 (right) cells exogenously expressing wild-type SOX11 (SOX11 WT, red), DBD-deleted mutant SOX11 (SOX11 DBD, gray), or empty pLX_TRC307 vector control (307 C, black). Wild-type SOX11 expression reduced viability compared to control (2-way ANOVA, Dunnett’s multiple comparisons, p-adj<0.0001). Western blots show SOX11 and Vinculin loading control. c. RNA-seq log2(TPM + 1) ±SEM of SOX11 expression in A673 ETV6-dTAG cells (left) (n = 3 biological replicates) and in CRISPR/Cas9-perturbed parental A673 cells (right) (controls n = 2 biological replicates; ETV6-knockout n = 3 biological replicates). d. Western blot of CRISPR/Cas9-perturbed A673 cells. e. Mean viability ±SEM (n = 6 biological replicates) of A673 cells shown in d in vitro. ETV6 knockout (red open and closed circles) reduced viability compared to control (black circles) (2-way ANOVA, Tukey’s multiple comparisons, p-adj<0.0001). Simultaneous ETV6 and SOX11 knockout (blue star) did not reduce viability compared to SOX11 knockout alone (gray square and circle) (sgSOX11 + sgETV6 vs. sgSOX11+sgLacZ, not significant ‘ns’ p-adj=0.7343) and exhibited greater viability than ETV6 knockout alone (p-adj<0.0001). f. Mean methylcellulose colony number ±SEM (n = 3 biological replicates) formed by A673 cells shown in d and e. ETV6 knockout reduced colony number compared to control (2-way ANOVA, Tukey’s multiple comparisons, sgLacZ+sgETV6 vs. sgLacZ+sgChr2.2 p-adj<0.0001, sgChr2.2 + sgETV6 vs. sgLacZ+sgChr2.2 p-adj=0.0011). Simultaneous ETV6 and SOX11 knockout did not reduce colony number compared to SOX11 knockout alone (sgSOX11 + sgLacZ vs. sgSOX11 + sgETV6, ns, p-adj=0.9984) and increased colonies compared to ETV6 knock-out alone (sgSOX11 + sgETV6 vs. sgLacZ+sgETV6 p-adj<0.0001; vs. sgChr2.2 + sgETV6 p-adj=0.0007). g. Western blot of rhabdomyosarcoma RD cells expressing doxycycline-inducible HA-tagged GFP, wild-type EWS/FLI, or DNA binding-incompetent R340N mutant EWS/FLI, in combination with CRISPR/Cas9 perturbation. One independent experiment. Source data

Comment in

  • Oncogenic role for an EWS-FLI1 suppressor.
    Apfelbaum AA, Lawlor ER. Apfelbaum AA, et al. Nat Cell Biol. 2023 Feb;25(2):214-216. doi: 10.1038/s41556-022-01067-8. Nat Cell Biol. 2023. PMID: 36658218 No abstract available.

Similar articles

Cited by

References

    1. Tsherniak A, et al. Defining a cancer dependency map. Cell. 2017;170:564–576.e16. doi: 10.1016/j.cell.2017.06.010. - DOI - PMC - PubMed
    1. Filbin M, Monje M. Developmental origins and emerging therapeutic opportunities for childhood cancer. Nat. Med. 2019;25:367–376. doi: 10.1038/s41591-019-0383-9. - DOI - PMC - PubMed
    1. Panditharatna E, Filbin MG. The growing role of epigenetics in childhood cancers. Curr. Opin. Pediatr. 2020;32:67–75. doi: 10.1097/MOP.0000000000000867. - DOI - PubMed
    1. Lawrence MS, et al. Mutational heterogeneity in cancer and the search for new cancer-associated genes. Nature. 2013;499:214–218. doi: 10.1038/nature12213. - DOI - PMC - PubMed
    1. Gröbner SN, et al. The landscape of genomic alterations across childhood cancers. Nature. 2018;555:321–327. doi: 10.1038/nature25480. - DOI - PubMed

Publication types

MeSH terms

Substances