. 2023 Feb;25(2):246-257.
doi: 10.1038/s41556-022-01071-y. Epub 2023 Jan 19.

Mitochondria regulate intracellular coenzyme Q transport and ferroptotic resistance via STARD7

Affiliations

Mitochondria regulate intracellular coenzyme Q transport and ferroptotic resistance via STARD7

Soni Deshwal et al. Nat Cell Biol. 2023 Feb.

Abstract

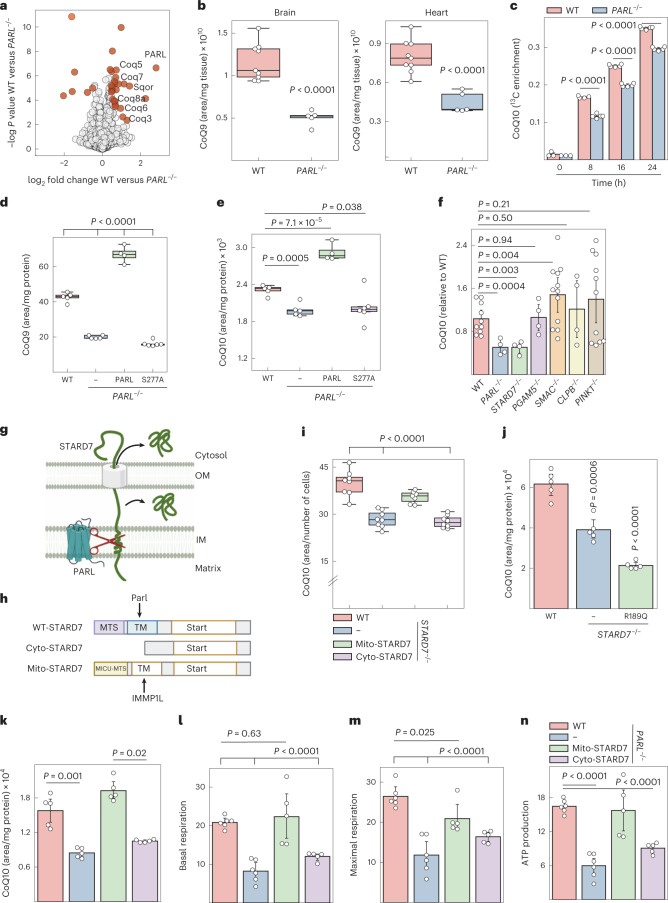
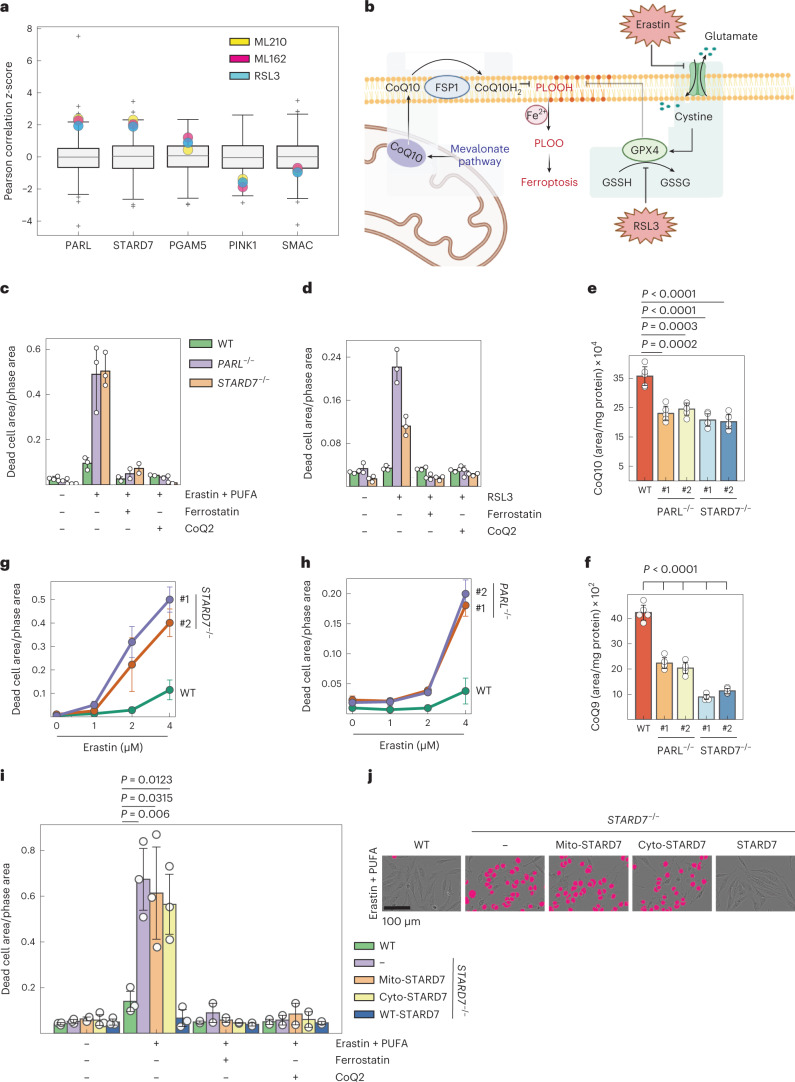
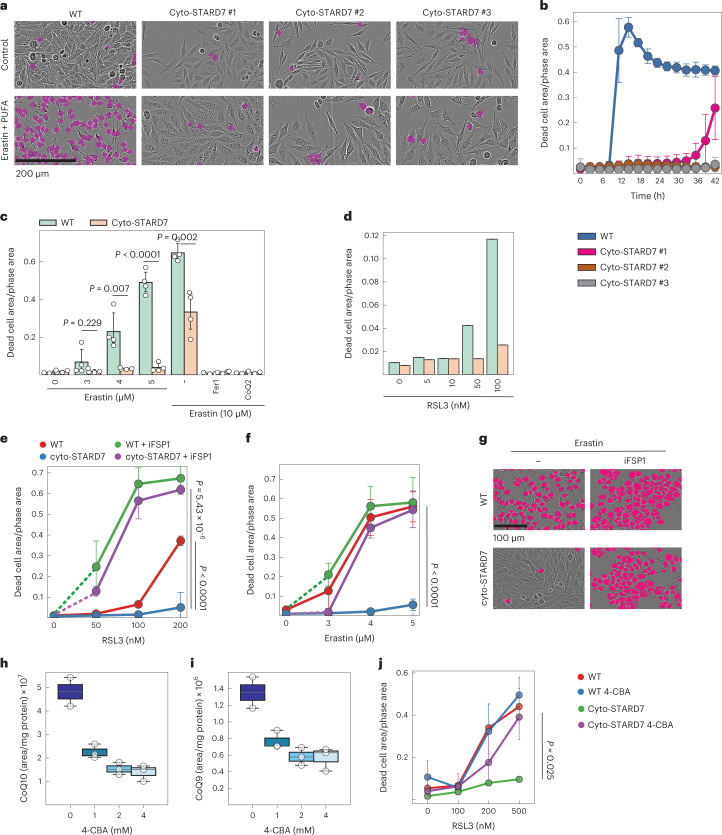
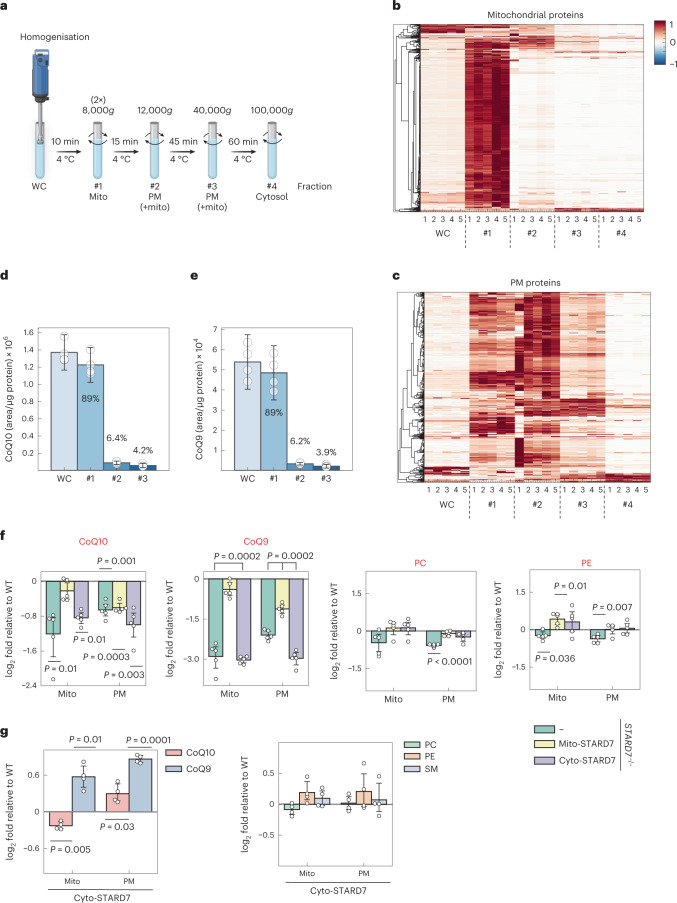
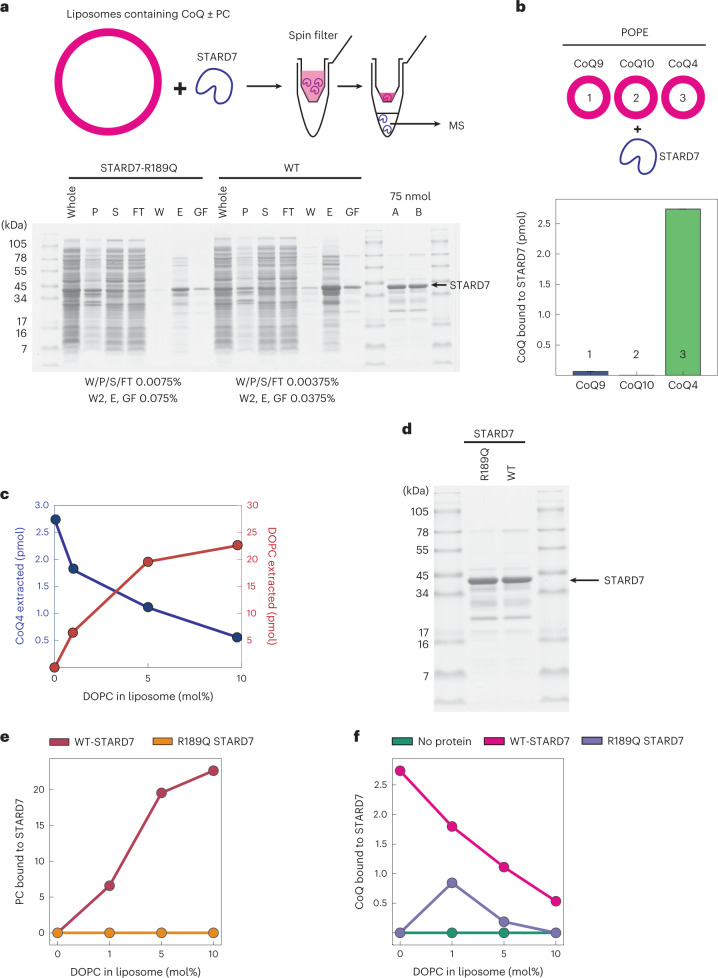
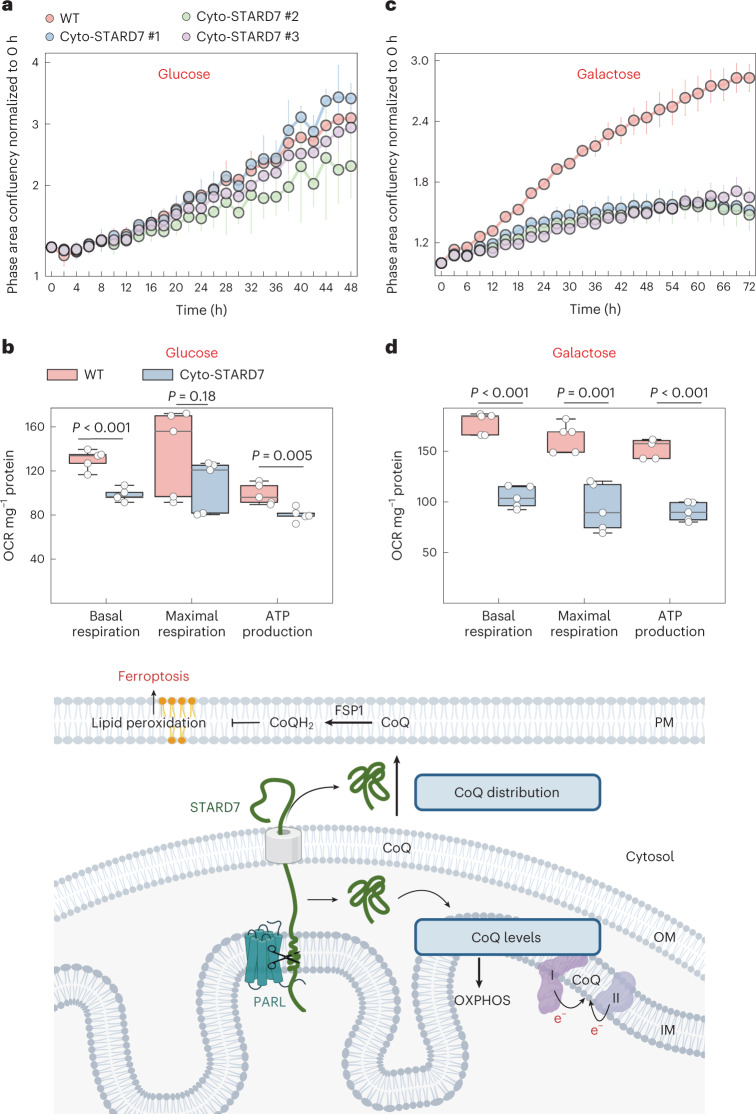
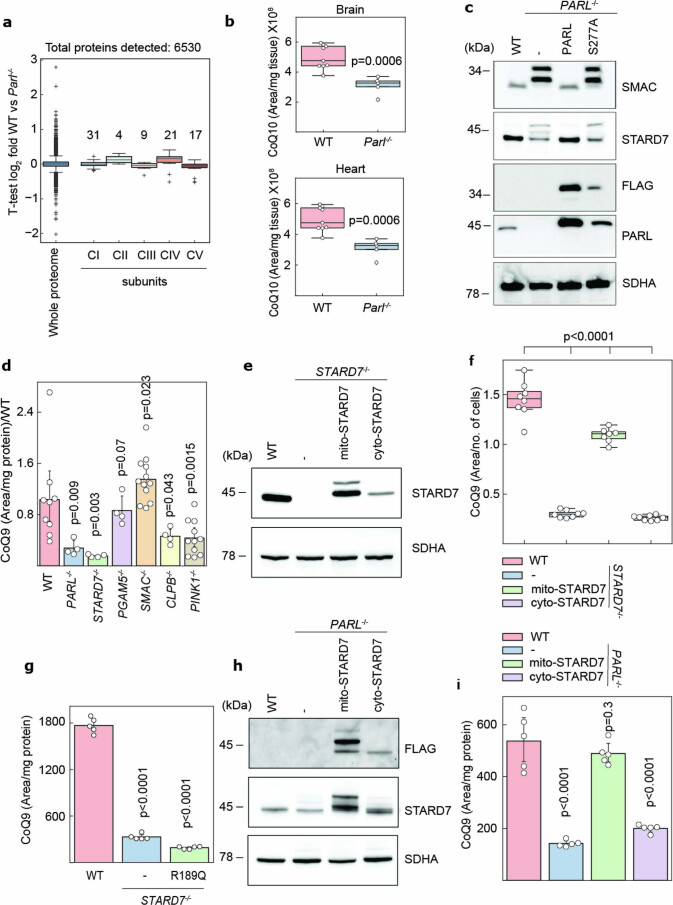
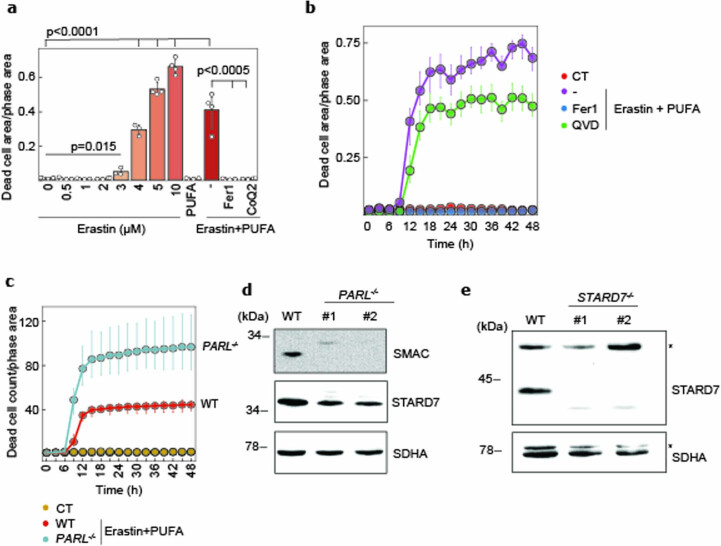
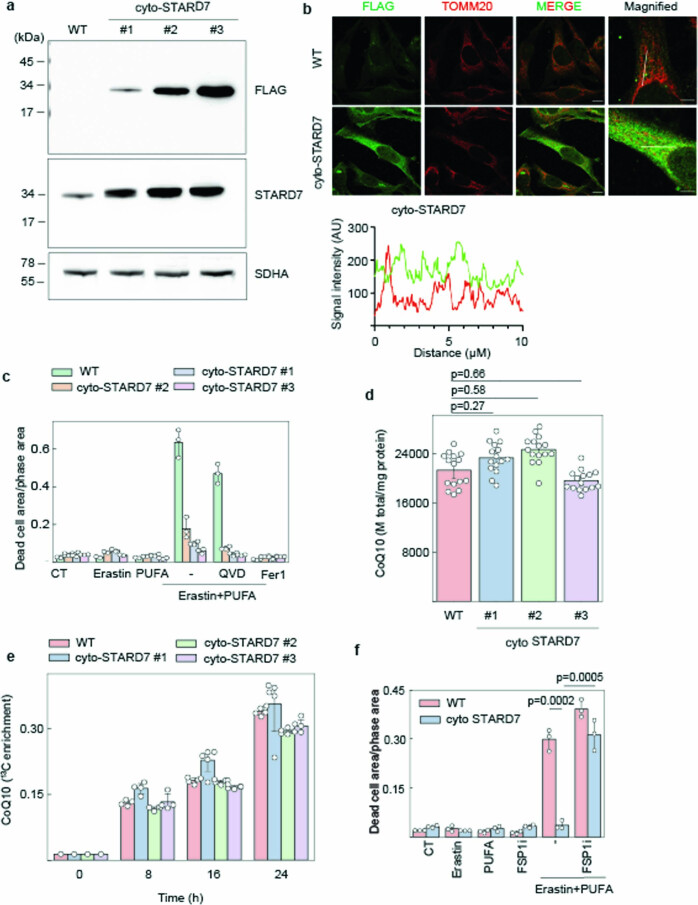
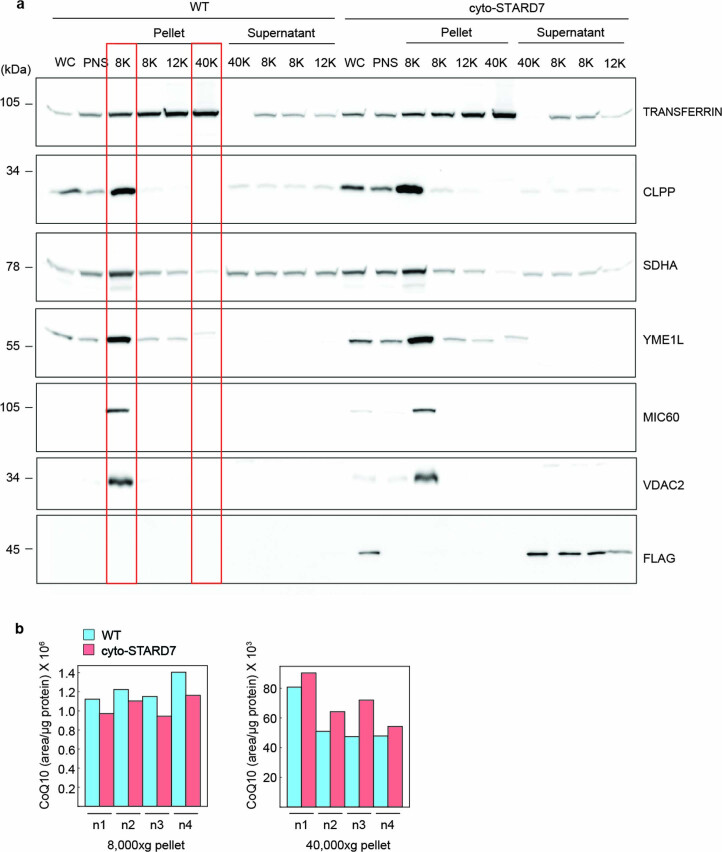
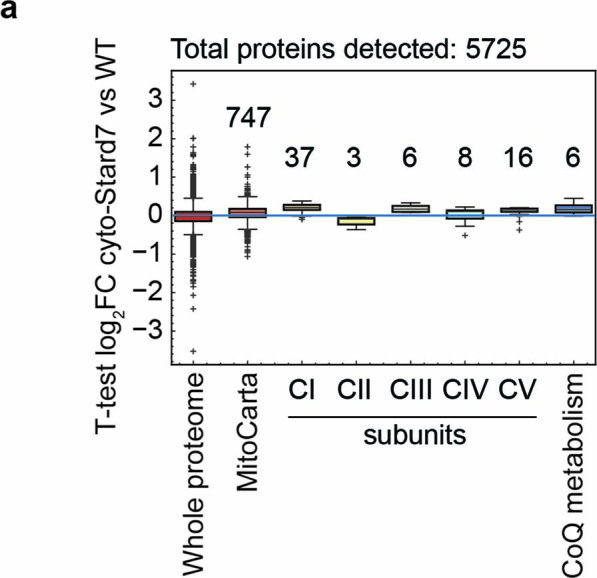
Coenzyme Q (or ubiquinone) is a redox-active lipid that serves as universal electron carrier in the mitochondrial respiratory chain and antioxidant in the plasma membrane limiting lipid peroxidation and ferroptosis. Mechanisms allowing cellular coenzyme Q distribution after synthesis within mitochondria are not understood. Here we identify the cytosolic lipid transfer protein STARD7 as a critical factor of intracellular coenzyme Q transport and suppressor of ferroptosis. Dual localization of STARD7 to the intermembrane space of mitochondria and the cytosol upon cleavage by the rhomboid protease PARL ensures the synthesis of coenzyme Q in mitochondria and its transport to the plasma membrane. While mitochondrial STARD7 preserves coenzyme Q synthesis, oxidative phosphorylation function and cristae morphogenesis, cytosolic STARD7 is required for the transport of coenzyme Q to the plasma membrane and protects against ferroptosis. A coenzyme Q variant competes with phosphatidylcholine for binding to purified STARD7 in vitro. Overexpression of cytosolic STARD7 increases ferroptotic resistance of the cells, but limits coenzyme Q abundance in mitochondria and respiratory cell growth. Our findings thus demonstrate the need to coordinate coenzyme Q synthesis and cellular distribution by PARL-mediated STARD7 processing and identify PARL and STARD7 as promising targets to interfere with ferroptosis.


Conflict of interest statement

The authors declare no competing interests.

Figures

Fig. 1
Fig. 1. PARL regulates CoQ levels via STARD7 processing.
a, Volcano plot of WT and Parl/ brain proteomes of 5-week-old male mice. Proteins significantly altered between WT and PARL−/− cells are highlighted in red. b, CoQ9 levels were determined by MS in brain and heart homogenates of 5-week-old male WT and PARL/ (n = 9 WT and n = 5 PARL/ animals) mice. c, CoQ synthesis traced with 13C6 glucose in WT and PARL/ HeLa cells. d,e, Total CoQ levels in WT and PARL/ HeLa cells complemented with either PARL or PARLS277A. f, CoQ abundance in HeLa cells lacking the indicated PARL substrate proteins (n = 10 WT, n = 4 STARD7−/−, PARL/, PGAM5−/−, CLPB/, n = 12 SMAC/, n = 11 PINK1/ biologically independent samples). g, PARL cleavage of STARD7 during mitochondrial import allows localization of STARD7 to both IMS and cytosol (image created with BioRender.com). OM, mitochondrial outer membrane. h, Domain structure of STARD7 and variants accumulating exclusively in the IMS (mito-STARD7) and the cytosol (cyto-STARD7). The mitochondrial targeting sequence (MTS) derived from MICU1 (amino acids 1–60) is cleaved off by IMMP1L protease, generating identical mature STARD7 in the IMS. cyto-STARD7 lacks the MTS (amino acids 1–76) of STARD7 (image created with BioRender.com). TM: transmembrane domain i,j, CoQ levels determined by MS in STARD7−/− cells expressing mito-STARD7 or cyto-STARD7 (n = 8 WT, STARD7/ and STARD7/ complemented with cyto-STARD7, n = 7 STARD7/ complemented with mito-STARD7 biologically independent samples) (i) or mito-STARD7R189Q deficient in PC binding (j). kn, CoQ abundance (k), basal respiration (l), maximal respiration (m) and ATP production (n) in WT and PARL/ cells expressing either mito-STARD7 or cyto-STARD7. Data were analysed by Instant Clue software and are represented by 95% confidence (bf,in) interval for the mean. In a,ce,jk, n = 5 biologically independent samples. In ln, n = 6 WT, PARL/ and n = 5 PARL/ complemented with mito- and cyto-STARD7 biologically independent samples. In bf,in, the P values were calculated using a two-tailed Student’s t-test for unpaired comparisons. In b,d,e,i, The central band of each box is the 50% quantile, and the box defines the 25% (lower) and 75% (higher) quantile. The whiskers represent the minimum and maximum value in the data. Source numerical data are available in source data. Source data
Fig. 2
Fig. 2. PARL and STARD7 preserve cells against ferroptosis.
a, Correlation of high expression of PARL and STARD7 with the resistance of cancer cell lines to the GPX4 inhibitors ML210, ML162 and RSL3. Data were mined from CTRP and show z-scores of Pearson’s correlation coefficients. The central band of each box is the 50% quantile, and the box defines the 25% (lower) and 75% (higher) quantile. The whiskers represent the minimum and maximum value in the data, and outliers are indicated by a plus sign (greater distance than 1.8 times interquantile range away from the median). b, Scheme illustrating FSP1-CoQ- and GPX4-dependent oxidative defence pathways as two independent mechanisms protecting against lipid peroxidation and ferroptosis (image created with BioRender.com). c,d, Ferroptosis was induced in WT, PARL−/− and STARD7/ HeLa cells with either erastin (3 µM) + PUFA (arachidonic acid 20:4, 40 µM) (n = 3 biologically independent experiments) (c) or RSL3 (200 nM) (d) in the presence of ferrostatin-1 (Fer1, 1 µM) and CoQ2 (1 µM) as indicated, and cell death was monitored after 24 h (n = 2). e,f, Total CoQ10/9 levels in WT, PARL/ and STARD7/ HCT116 cells. #1 and #2 represent two different clones of indicated genotype. g,h, Increased ferroptotic vulnerability of two different clones of PARL−/− and STARD7/ HCT116 cells compared with WT upon treatment with indicated concentrations of erastin for 24 h. i, Cell death in WT, STARD7/ and in STARD7/ cells expressing mito-STARD7, cyto-STARD7 or STARD7 after 9 h in the presence of the indicated compounds. j, Representative images from i showing dead cells in magenta and living cells with phase contrast after 9 h. In ci, data were analysed by Instant Clue software and are represented by 95% confidence interval of the mean. n = 3 (d,i), n = 5 (e,f) and n = 4 (g,h) biologically independent experiments. In ci, the P values were calculated using a two-tailed Student’s t-test for unpaired comparisons. Source numerical data are available in source data. Source data
Fig. 3
Fig. 3. Cyto-STARD7 suppresses ferroptosis via CoQ-FSP1 pathway.
a,b, Ferroptosis was induced in WT and three different clones of cyto-STARD7 overexpressing cells with erastin (3 µM) in the presence of PUFA (arachidonic acid 20:4, 40 µM), and cell death was monitored. Representative images from b after 18 h (a) and kinetics of cell death (b) are shown. No cell death was observed in WT and cyto-STARD7 overexpressing cells treated with DMSO. c,d, Cell death measured in WT and cyto-STARD7-overexpressing cells with different ferroptosis inducers, including erastin (c) and GPX4 inhibitor RSL3 (d) after 24 h. Ferrostatin-1 (Fer1, 1 µM) and CoQ2 (1 µM) were used to inhibit ferroptosis. eg, Ferroptosis was induced by blocking either only GPX4 arm via RSL3 (e and g) or erastin (f) or both GPX4 and FSP1-CoQ arm via combination of erastin/GPX4 and FSP1 inhibitor iFSP1 (5 µM) in WT and cyto-STARD7-overexpressing cells. In g, representative images from f show dead cells in magenta and alive cells in phase contrast after 24 h of treatment. h,i, CoQ10/9 levels were measured in HeLa cells treated with either DMSO (n = 2) or indicated concentrations of coenzyme Q2 (CoQ2, polyprenyltransferase) inhibitor 4-CBA for 48 h (n = 3). The central band of each box is the 50% quantile, and the box defines the 25% (lower) and 75% (upper) quantile. The whiskers represent the minimum and maximum value in the data. Source numerical data are available in source data. j, To inhibit CoQ synthesis, WT and cyto-STARD7-overexpressing cells were treated with 4-CBA (2 mM). After 24 h of treatment, ferroptosis was induced by indicated concentrations of RSL3, and cell death was measured at 24 h. In b, c, e, f and hj, data were analysed by Instant Clue software and are represented by 95% confidence interval of the mean. In d, data were analysed by Instant Clue software and are represented by the average of n = 2 biologically independent experiments. n = 3 (b, e and f) and n = 4 (c and j) biologically independent experiments. In c, e, f and j, the P values were calculated using a two-tailed Student’s t-test for unpaired comparisons. Source data
Fig. 4
Fig. 4. Cyto-STARD7 is required for CoQ export from the mitochondria.
a, Scheme showing the fractionation protocol for HeLa cells to isolate mitochondria and PM fractions with differential centrifugations (image created with BioRender.com). b,c, Heat maps showing the distribution of mitochondrial (b) and plasma membrane (c) proteins in different fractions of cells determined by MS. #1, 8,000g pellet; #2, 12,000g pellet; #3, 40,000g pellet and #4, 100,000g pellet. n = 5 biologically independent experiments. d,e, Total levels of CoQ10/9 measured in indicated fractions of HeLa cells. CoQ distribution within the cell is indicated in per cent in each fraction. f,g, Differences in the abundance of CoQ10, CoQ9, PC, PE (f,g) and sphingomyelin (SM) (g) in mitochondrial and plasma membrane fractions relative to WT in STARD7/ cells and STARD7/ cells complemented with either mito-STARD7 or cyto-STARD7 (f) and in WT cells overexpressing cyto-STARD7 (g). In dg, data were analysed by Instant Clue software and are represented by 95% confidence interval of the mean. n = 4 (d,e,g) and n = 5 (f) biologically independent experiments. In dg, the P values were calculated using a two-tailed Student’s t-test for unpaired comparisons (d,e) and two-tailed one-sample t-test for unpaired comparison (f and g). Source numerical data are available in source data. Source data
Fig. 5
Fig. 5. STARD7 can extract CoQ4 from liposomes in vitro.
a, Scheme showing in vitro experiments, where liposomes containing different chain lengths of CoQ in the presence or absence of DOPC were incubated with STARD7 purified from E. coli. Top: after passing through a spin filter, lysate was analysed by MS. Purification of STARD7-his and its mutant variant (R189Q) is shown. C-terminally hexahistidine-tagged mature form of STARD7 and its mutant variant were expressed in T7 express E. coli cells. After mechanical lysis, the lysate was subjected to Ni-NTA affinity purification followed by gel filtration. P, pellet after lysis; S, supernatant after lysis; FT, flow-through fraction; W, wash fraction; E, peak fraction eluted from HisTrap column; GF, peak fraction after gel filtration in HighLoad Superdex 200 pg column. Bottom: 75 nmol of each final sample was checked. b, CoQ extracted by STARD7 from liposomes containing either CoQ9 (1) or CoQ10 (2) or CoQ4 (3) in the absence of DOPC was measured by MS. Background signals in the absence of protein were subtracted. c, CoQ4 (pMol) and PC (pMol) extracted by STARD7. d, STARD7 and STARD7R189Q proteins purified from E. coli. e,f, PC (e) and CoQ (f) extracted by STARD7 or STARD7R189Q from liposomes containing increasing concentration of DOPC. Source numerical data are available in source data. Source data
Fig. 6
Fig. 6. Overexpression of cyto-STARD7 impairs cell growth and mitochondrial oxygen consumption under respiring conditions.
ad, Growth rate (a and c) and OCR (b and d) of WT and cyto-STARD7-overexpressing cells in the presence of glucose (25 mM) (a and c) or galactose (10 mM) (b and d). In ad, data are represented by 95% confidence interval of the mean and the P values were calculated using a two-tailed Student’s t-test for unpaired comparisons where indicated. n = 5 (a, b and d) and n = 4 (c) biologically independent experiments. In b and d, the central band of each box is the 50% quantile, and the box defines the 25% (lower) and 75% (higher) quantile. The whiskers represent the minimum and maximum value in the data. Model illustrating the role of mito-STARD7 and cyto-STARD7 in CoQ biosynthesis and distribution, respectively. OM, mitochondrial outer membrane. Source numerical data are available in source data (image created with BioRender.com). Source data
Extended Data Fig. 1
Extended Data Fig. 1. PARL mediated STARD7 cleavage is required for maintaining CoQ levels.
a, Quantification of subunits of OXPHOS complexes I, II, III and IV and of the F1FO ATP synthase (complex V), detected by mass spectrometry of 5-week-old male wild-type and PARL−/− brain tissues. Numbers of subunits detected for each complex are noted in the graph (n = 5 male mice). b, CoQ9 levels measured by mass spectrometry in brain and heart of 5-week-old male WT and PARL−/− mice (n = 9 WT and n = 5 PARL/ animals). c, Immunoblot analysis of WT cells, PARL/ cells and PARL/ cells expressing PARL or PARLS277A. d, CoQ9 abundance in HeLa cells lacking the indicated PARL substrate proteins (n = 10 WT, n = 4 STARD7−/−, PARL/, PGAM5−/−, CLPB/, n = 12 SMAC/, n = 11 PINK1/ biologically independent samples). e, Immunoblot analysis of STARD7/ cells expressing mito-STARD7 or cyto-STARD7. f,g, CoQ9 levels measured in WT cells, STARD7/ cells, and in STARD7/ cells complemented with mito-STARD7 or cyto-STARD7 (n = 8 WT, STARD7/ and STARD7/ complemented with cyto-STARD7, n = 7 STARD7/ complemented with mito-STARD7 biologically independent samples) (f) or mito-STARD7R189Q (g). h, Immunoblot analysis of PARL/ cells expressing mito-STARD7 or cyto-STARD7. i, CoQ9 abundance in WT cells, PARL/ cells and PARL/ cells expressing mito-STARD7 or cyto-STARD7. g,i, n = 5 biologically independent samples. c,e,h, Representative immunoblots of n = 2 independent experiments. a−b,f, The central band of each box is the 50% quantile, and the box defines the 25% (lower) and 75% (higher) quantile. The whiskers represent the minimum and maximum value in the data and outliers are indicated by a + sign (greater distance than 1.8 times inter quantile range away from the median). b,d,f,g,i, Data is represented by 95% confidence interval of the mean and the P values were calculated using a two-tailed Student’s t-test for unpaired comparisons where indicated. Source data
Extended Data Fig. 2
Extended Data Fig. 2. PARL and STARD7 protect cells against ferroptosis.
a,b, |Cell death measurement after 24 h (a) or kinetics (b) in WT cells treated with indicated concentrations of erastin (a) or combination of erastin (3 µM) and PUFA (arachidonic acid 20:4, 40 µM) (a,b), in the presence of ferroptosis inhibitors Fer1 (1 µM) or CoQ2 (1 µM) and apoptosis inhibitor QVD (1 µM) as indicated. WT cells treated with DMSO were used as control (CT). c, Cell death kinetics in WT and PARL−/− cells treated with erastin (3 µM) and PUFA (40 µM). d,e, Immunoblot analysis of WT, PARL/ (d) and STARD7/ (e) human colorectal cancer HCT116 cells. #1 and #2 represent two different monoclonal cell lines of the indicated genotype. a, n = 4 and bc, n = 3 biological independent experiments. de, Representative immunoblots of n = 2 independent experiments. ac, Data is represented by 95% confidence interval of the mean and the P values (a) were calculated using a two-tailed Student’s t-test for unpaired comparisons. Source data
Extended Data Fig. 3
Extended Data Fig. 3. Cytosolic STARD7 is a suppressor of ferroptosis.
a, Immunoblot analysis of WT cells and WT cells overexpressing FLAG-tagged cyto-STARD7. #1, #2 and #3 represent different monoclonal cell lines selected from a polyclonal population. b, Localization of cyto-STARD7 in WT and cyto-STARD7 overexpressing cells was determined by immunofluorescence in HeLa cells. Cells are stained with antibodies against FLAG (green) to detect overexpressed STARD7 and TOMM20 (red) to detect mitochondria. Immunofluorescence images were taken via confocal microscopy with 1,000x magnification. A merge of both, as well as a magnified images are shown. Scale bars are 10 µm (magnified image). Graph shows the signal intensity plots of STARD7 (green) and TOMM20 (red) through line segment analysis (white line) in magnified image, n = 2 independent experiments. c, Cell death measured in WT and cyto-STARD7 overexpressing monoclonal cell lines treated either with erastin (3 µM) (n = 3) or PUFA (arachidonic acid 20:4, 40 µM) (n = 2), or combination of erastin and PUFA (n = 3) in the presence of the ferroptosis inhibitor Fer1 (1 µM) or the apoptosis inhibitor QVD (1 µM) as indicated (n = 3). d,e, Total CoQ levels (n = 15 independent biological samples) (d) and CoQ synthesis (e) measured in WT and cyto-STARD7 overexpressing cells incubated with 13C6 glucose for the indicated time points. f, Ferroptosis was induced in WT and cyto-STARD7 overexpressing cells by either inhibiting GPX4 arm via erastin (1 µM) and PUFA (40 µM) or by inhibiting both GPX4 and CoQ-FSP1 arm via combination of erastin+PUFA and iFSP1 (1 µM). Cell death was measured after 24 h. a, n = 2 and f, n = 3 independent experiments and e, n = 5 (with one blank at 0 h from each genotype) biologically independent samples. cf, Data is represented by 95% confidence interval of the mean and the P values were calculated using a two-tailed Student’s t-test for unpaired comparisons where indicated. Source data
Extended Data Fig. 4
Extended Data Fig. 4. Cytosolic STARD7 is required for CoQ transport from the mitochondria to the plasma membrane.
a, Immunoblot analysis of cellular fractions obtained by differential centrifugation of lysates of WT and cyto-STARD7 overexpressing cells. The highlighted fractions 8 K and 40 K represent mitochondrial fraction and plasma membrane (PM) fractions, respectively, and were used to measure CoQ and other lipids. WC, whole cell; PNS, post-nuclear supernatant, n = 2 independent biological experiments. b, Raw data representation of 4 independent fractionation experiments from Fig. 4g showing CoQ10 levels measured by mass spectrometry in 8,000xg (8 K) and 40,000xg (40 K) pellet. Source data
Extended Data Fig. 5
Extended Data Fig. 5. Overexpression of STARD7 limits respiratory cell growth.
a, Proteome analysis of all the detected OXPHOS subunits, including complex I, II, III, IV and V, and CoQ biosynthetic machinery in WT and cyto-STARD7 overexpressing cells. Number of subunits detected for each OXPHOS complex and CoQ biosynthetic machinery are noted in the graph. The central band of each box is the 50% quantile, and the box defines the 25% (lower) and 75% (higher) quantile. The whiskers represent the minimum and maximum value in the data and outliers are indicated by a + sign (greater distance than 1.8 times inter quantile range away from the median). Data represents the boxplots from n = 5 independent biological samples. Source data

Comment in

References

    1. Stefely JA, Pagliarini DJ. Biochemistry of mitochondrial coenzyme Q biosynthesis. Trends Biochem. Sci. 2017;42:824–843. doi: 10.1016/j.tibs.2017.06.008. - DOI - PMC - PubMed
    1. Martinez-Reyes I, et al. Mitochondrial ubiquinol oxidation is necessary for tumour growth. Nature. 2020;585:288–292. doi: 10.1038/s41586-020-2475-6. - DOI - PMC - PubMed
    1. Jonassen T, Larsen PL, Clarke CF. A dietary source of coenzyme Q is essential for growth of long-lived Caenorhabditis elegans clk-1 mutants. Proc. Natl Acad. Sci. USA. 2001;98:421–426. doi: 10.1073/pnas.98.2.421. - DOI - PMC - PubMed
    1. Luna-Sanchez M, et al. CoQ deficiency causes disruption of mitochondrial sulfide oxidation, a new pathomechanism associated with this syndrome. EMBO Mol. Med. 2017;9:78–95. doi: 10.15252/emmm.201606345. - DOI - PMC - PubMed
    1. Hernandez-Camacho JD, et al. Coenzyme Q10 supplementation in aging and disease. Front. Physiol. 2018;9:44. doi: 10.3389/fphys.2018.00044. - DOI - PMC - PubMed

Publication types

LinkOut - more resources