. 2023 Feb;24(2):255-266.
doi: 10.1038/s41590-022-01398-6. Epub 2023 Jan 19.

YTHDF2 orchestrates tumor-associated macrophage reprogramming and controls antitumor immunity through CD8+ T cells

Affiliations

YTHDF2 orchestrates tumor-associated macrophage reprogramming and controls antitumor immunity through CD8+ T cells

Shoubao Ma et al. Nat Immunol. 2023 Feb.

Abstract

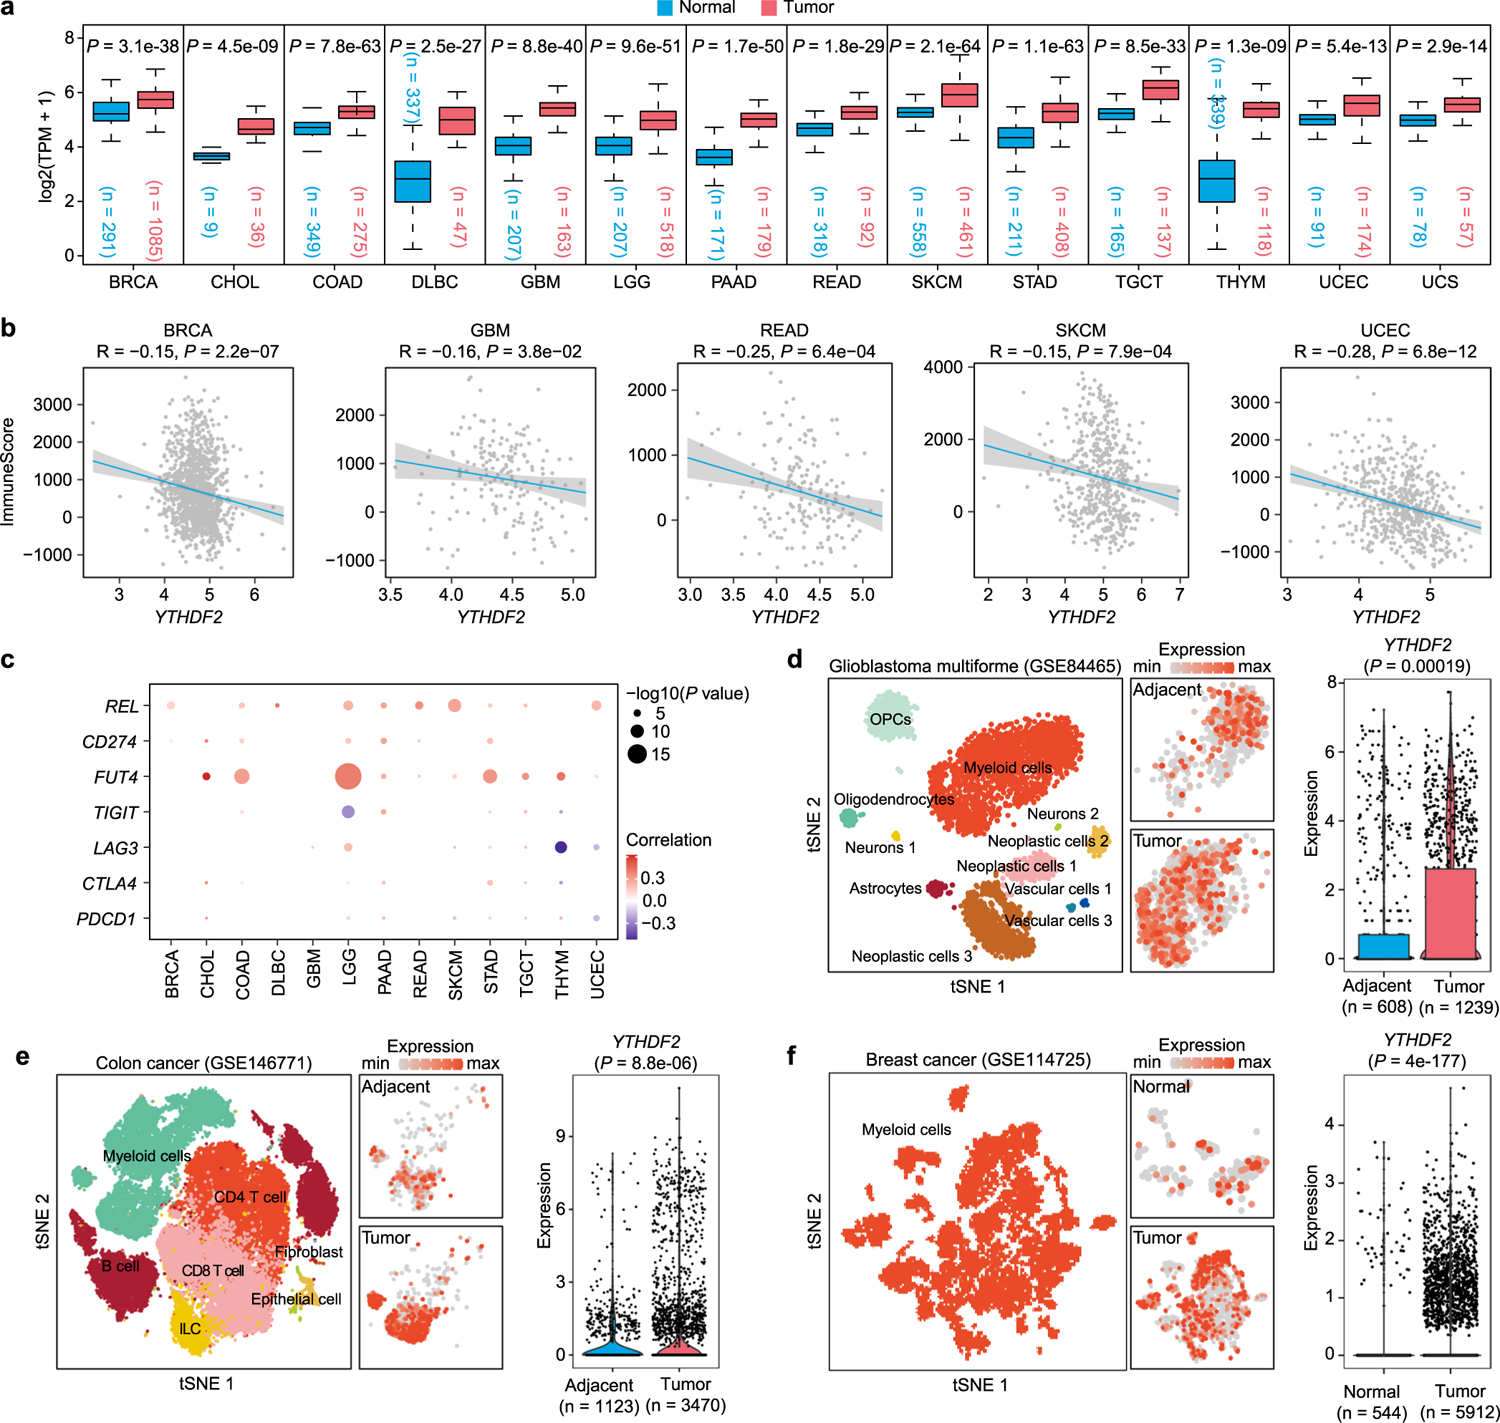
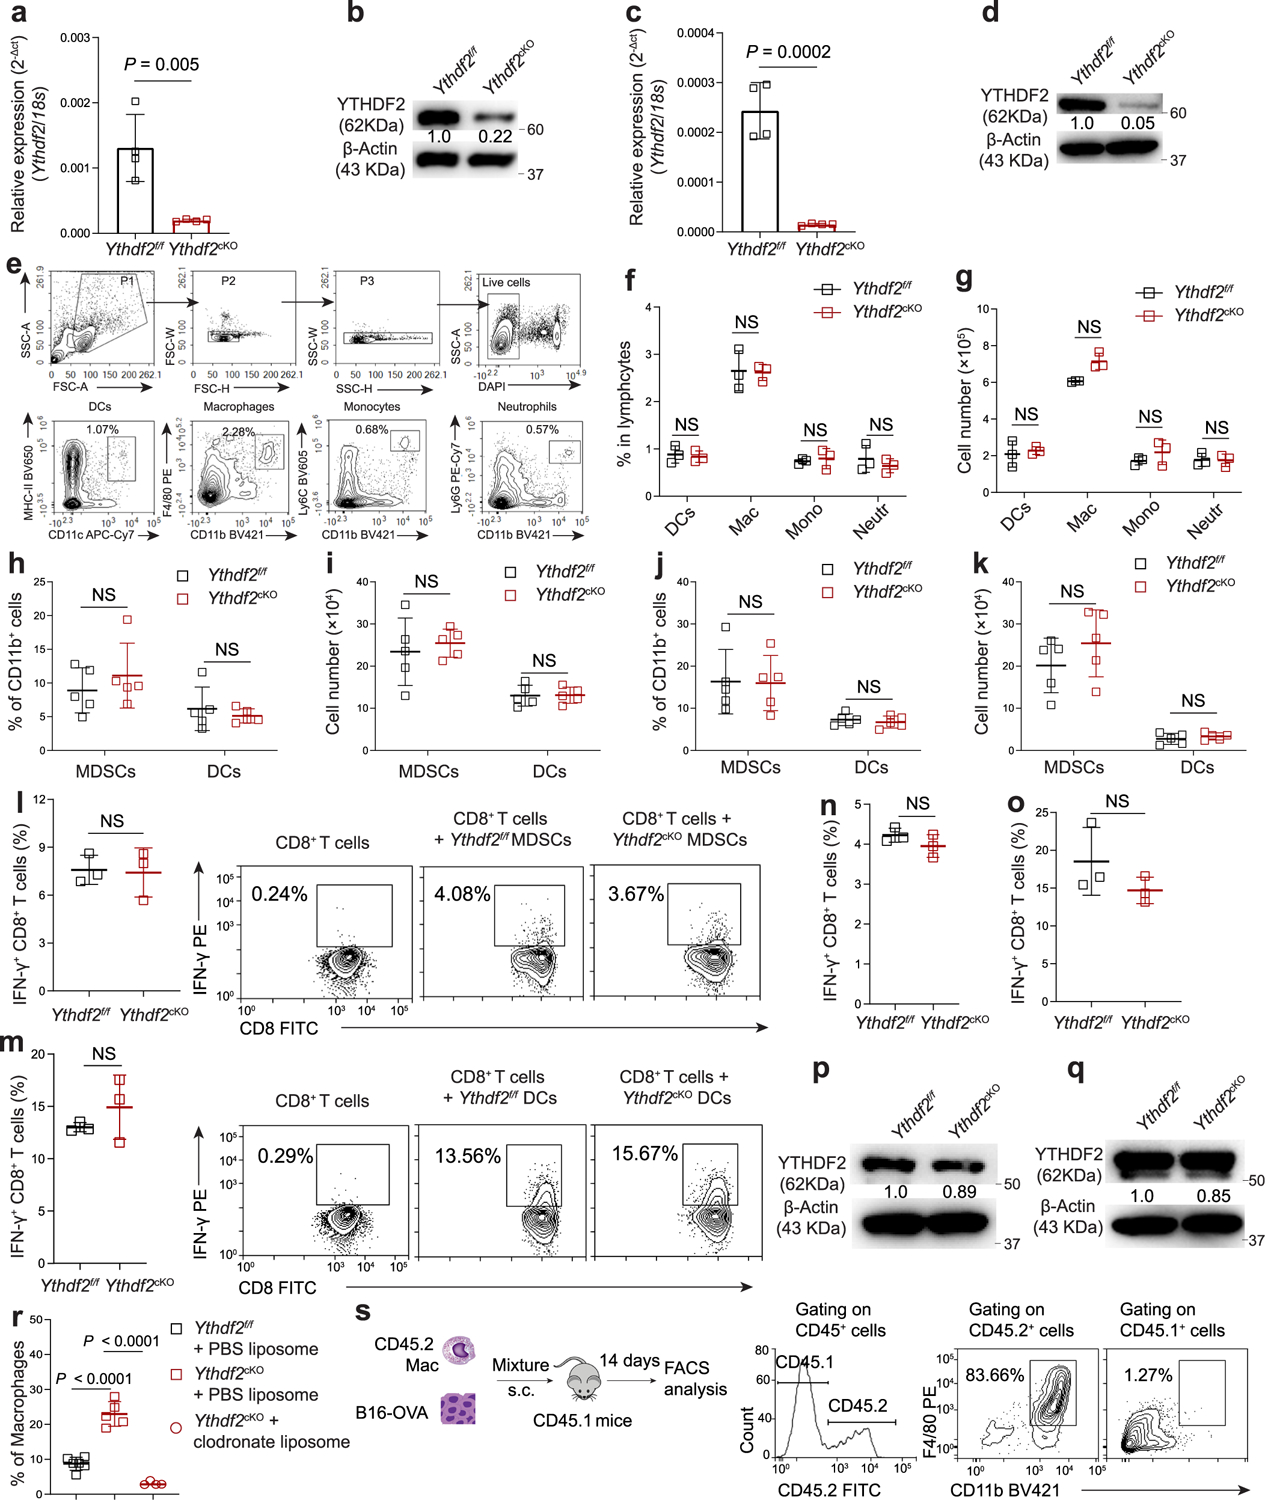
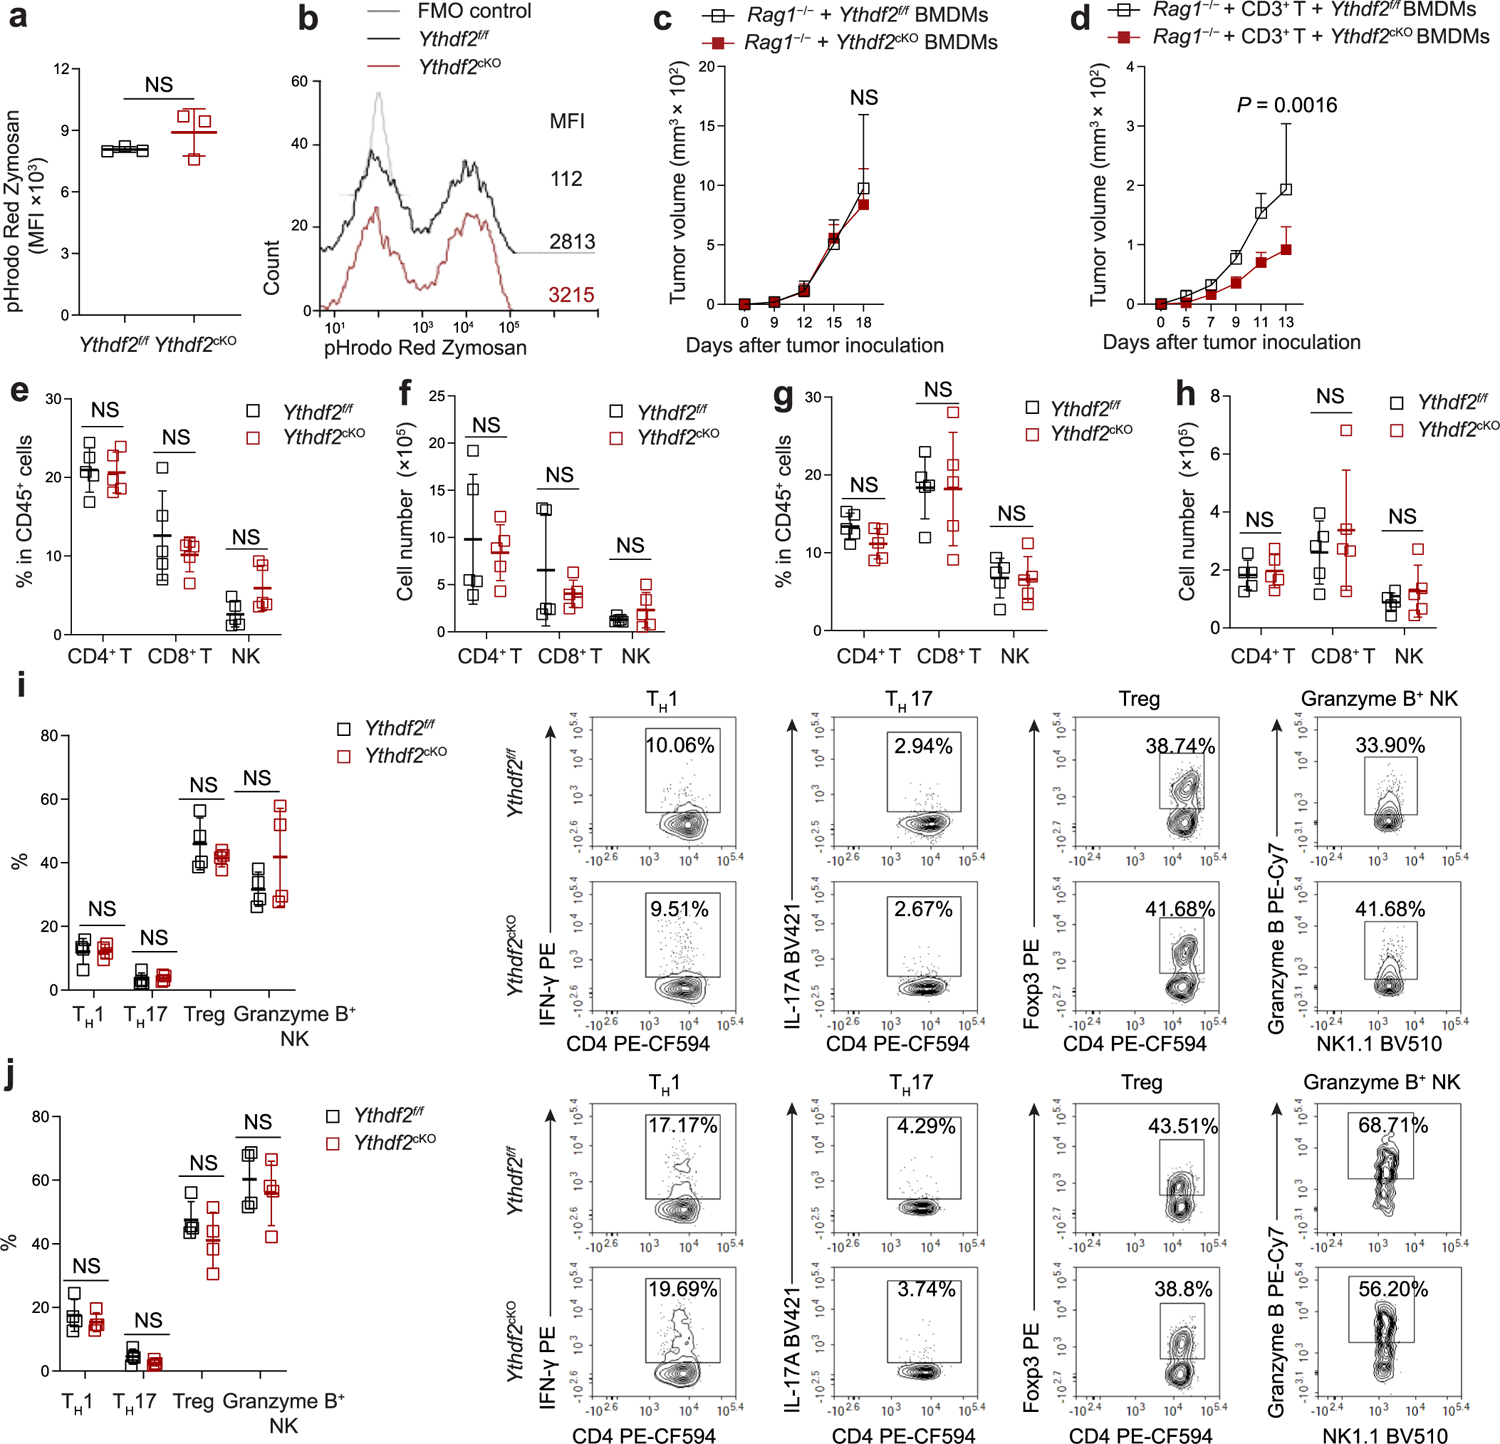
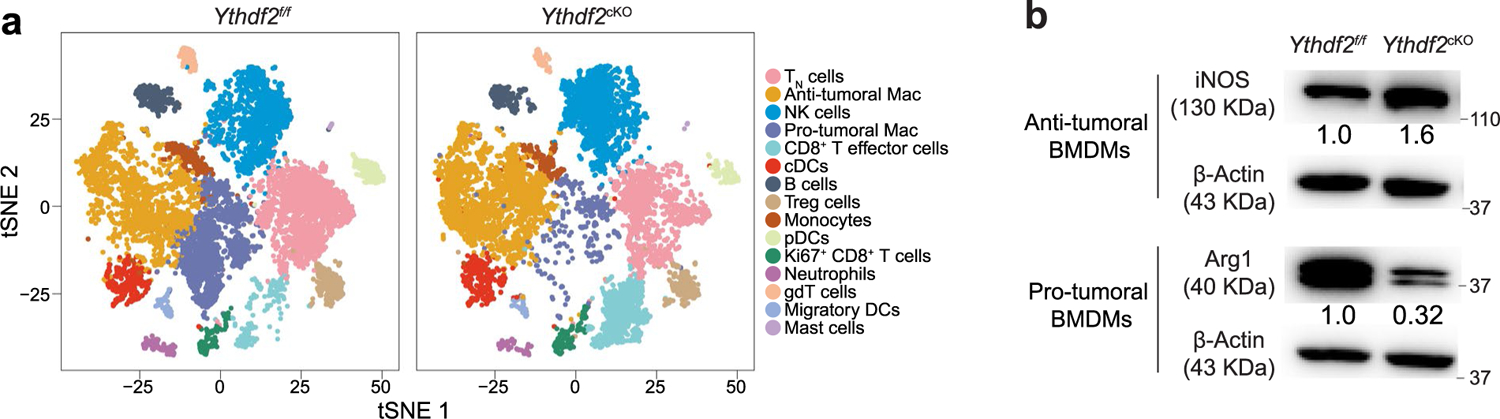
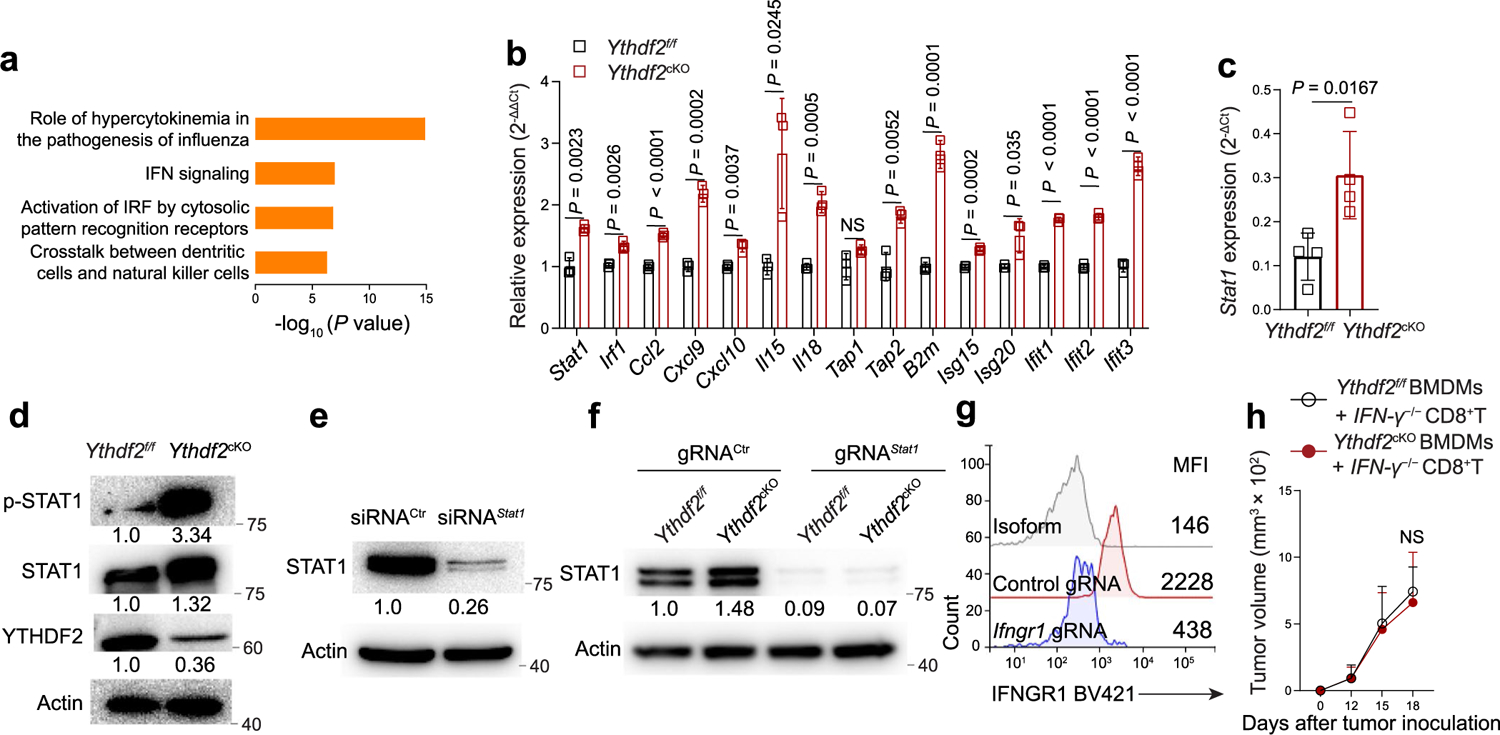
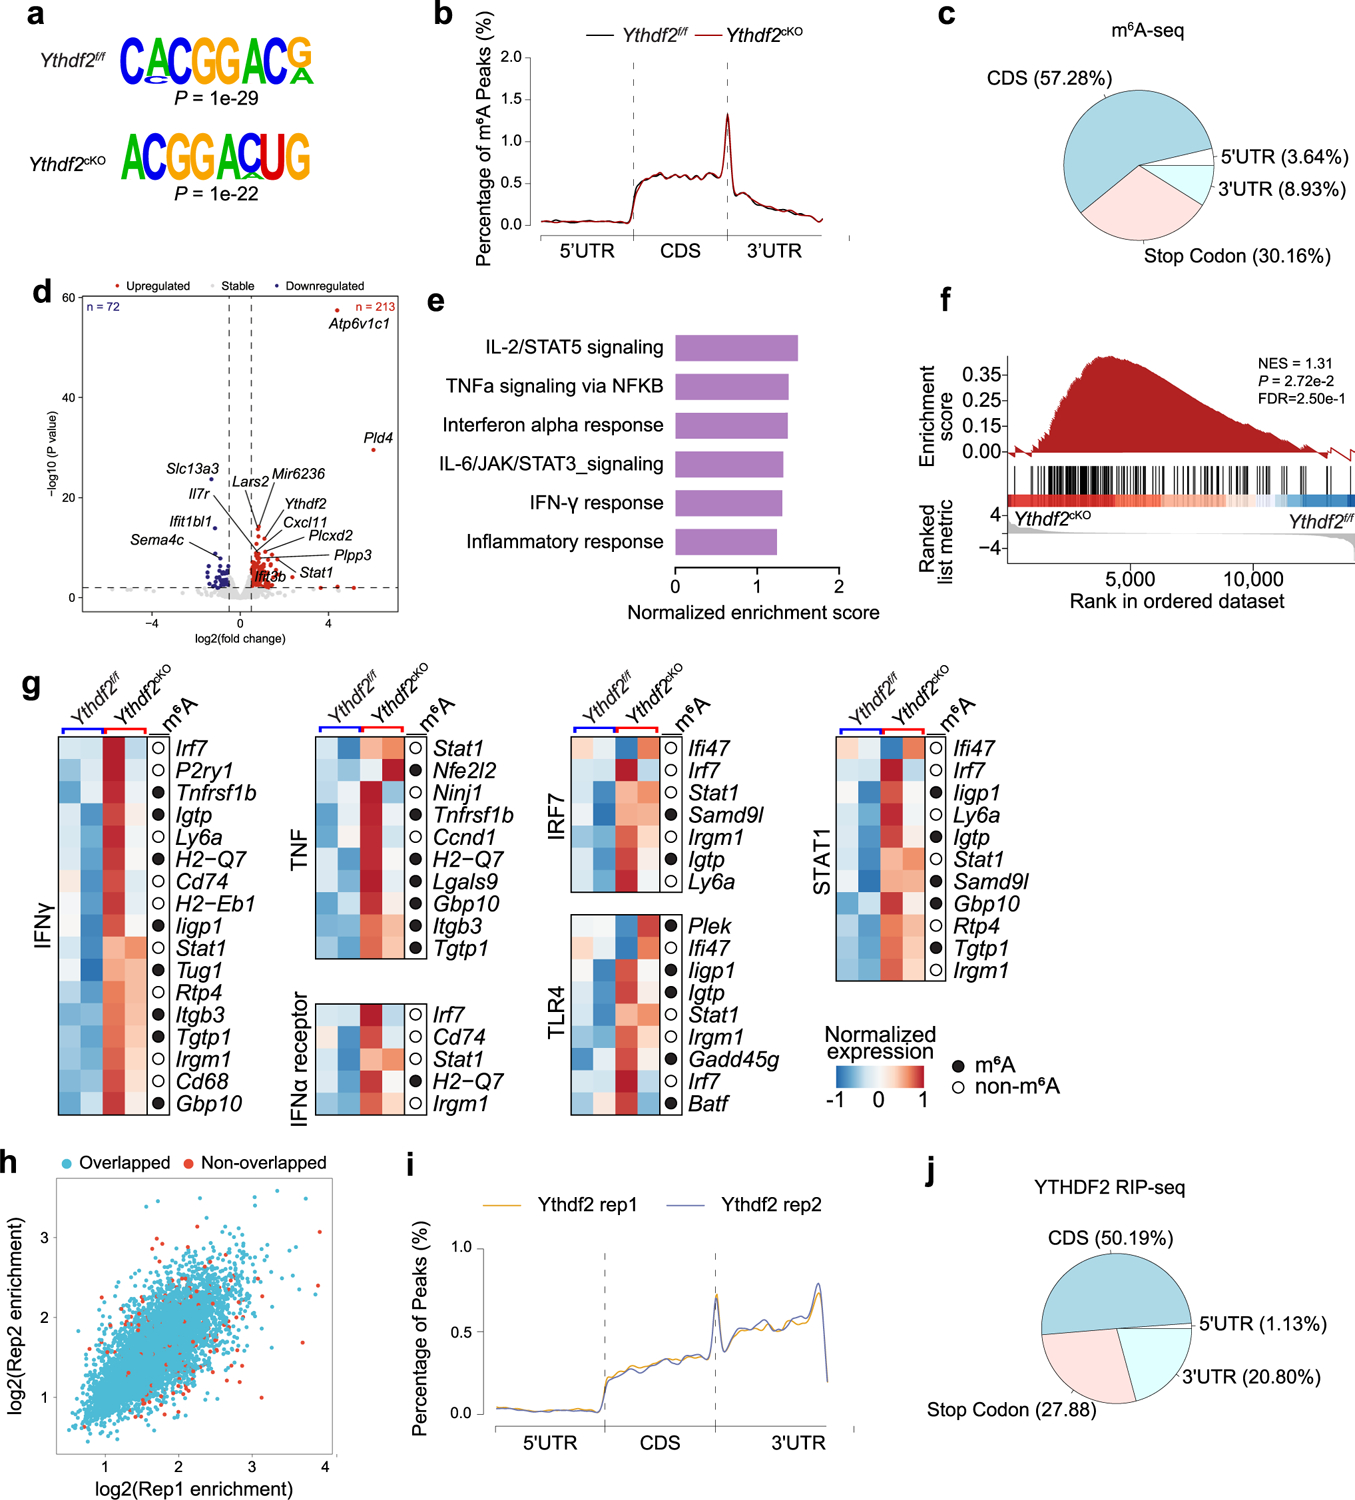
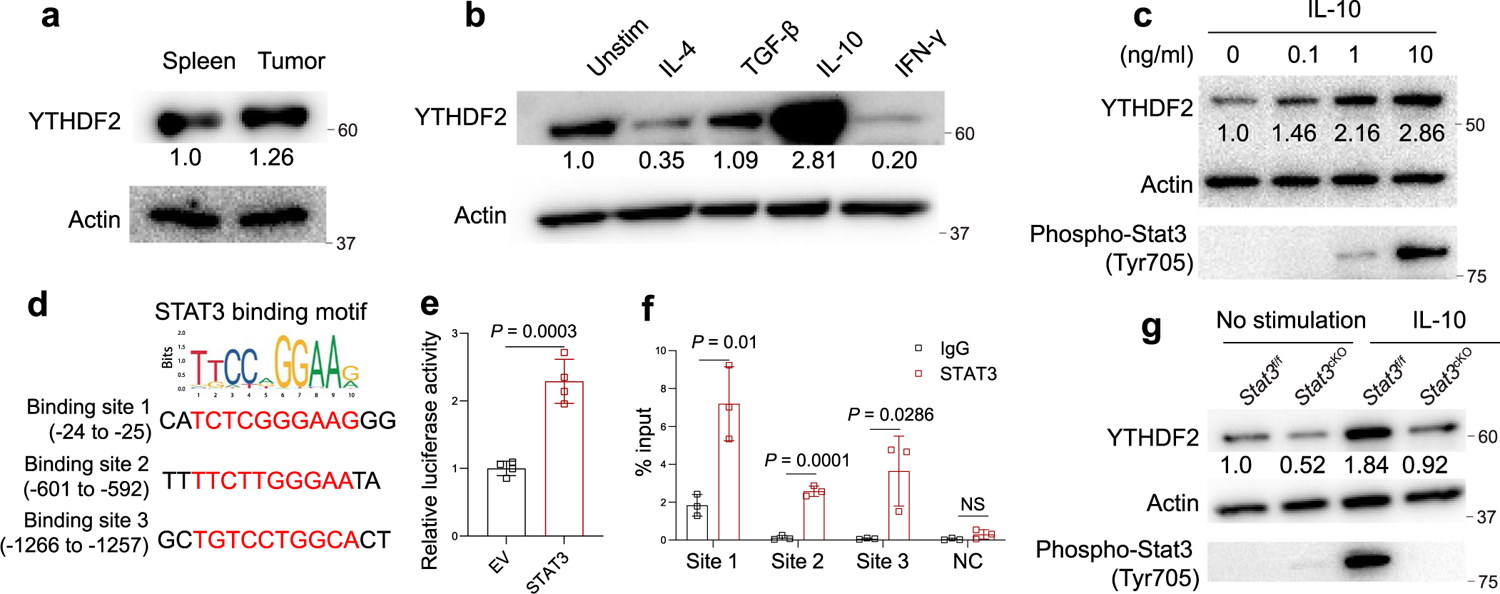
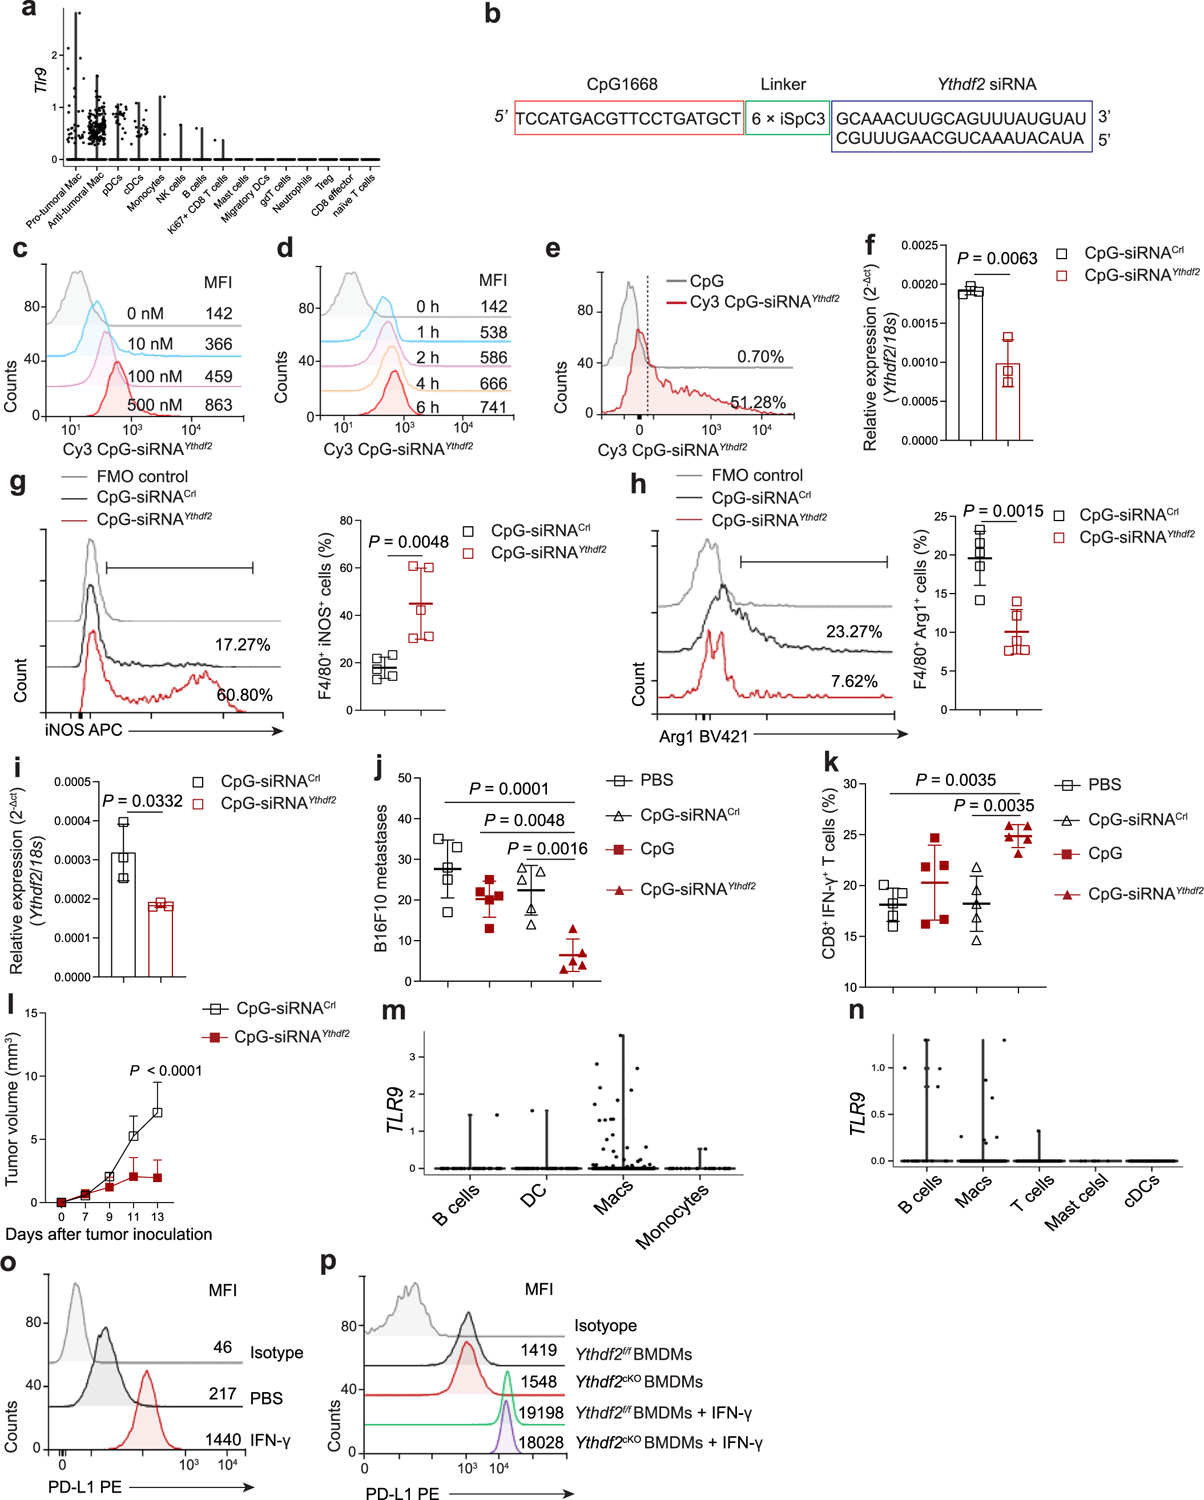
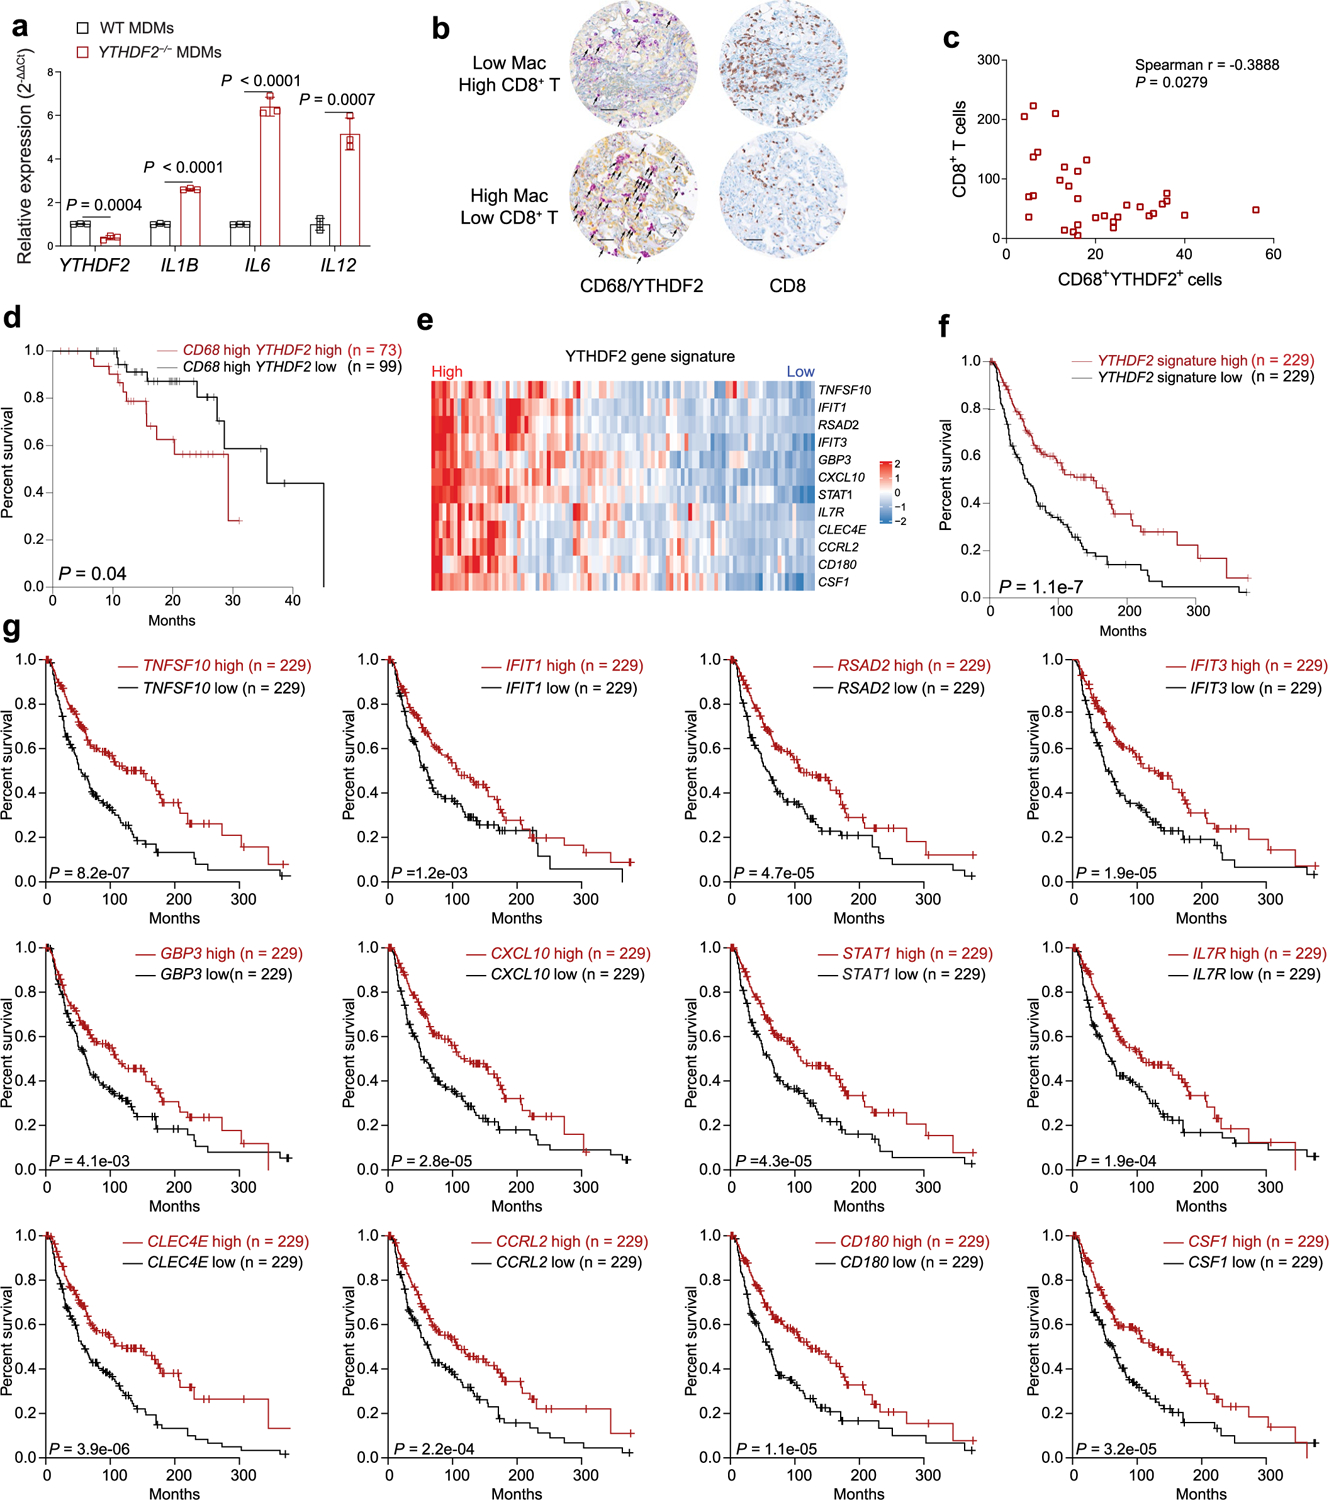
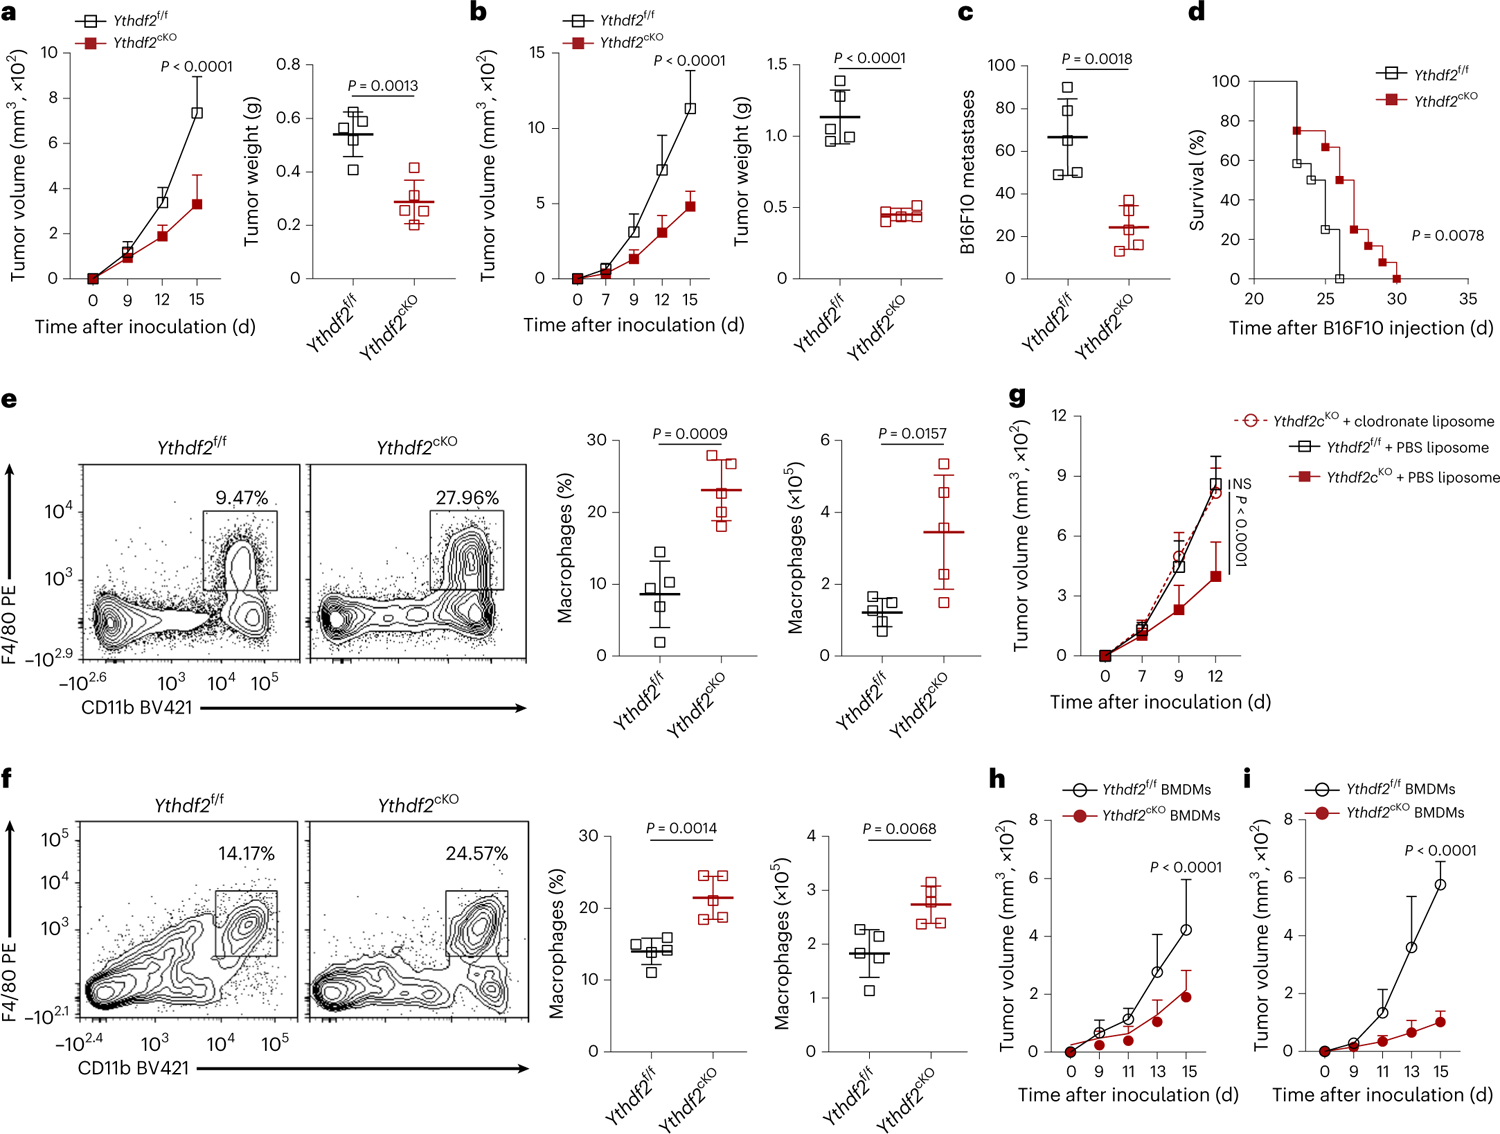
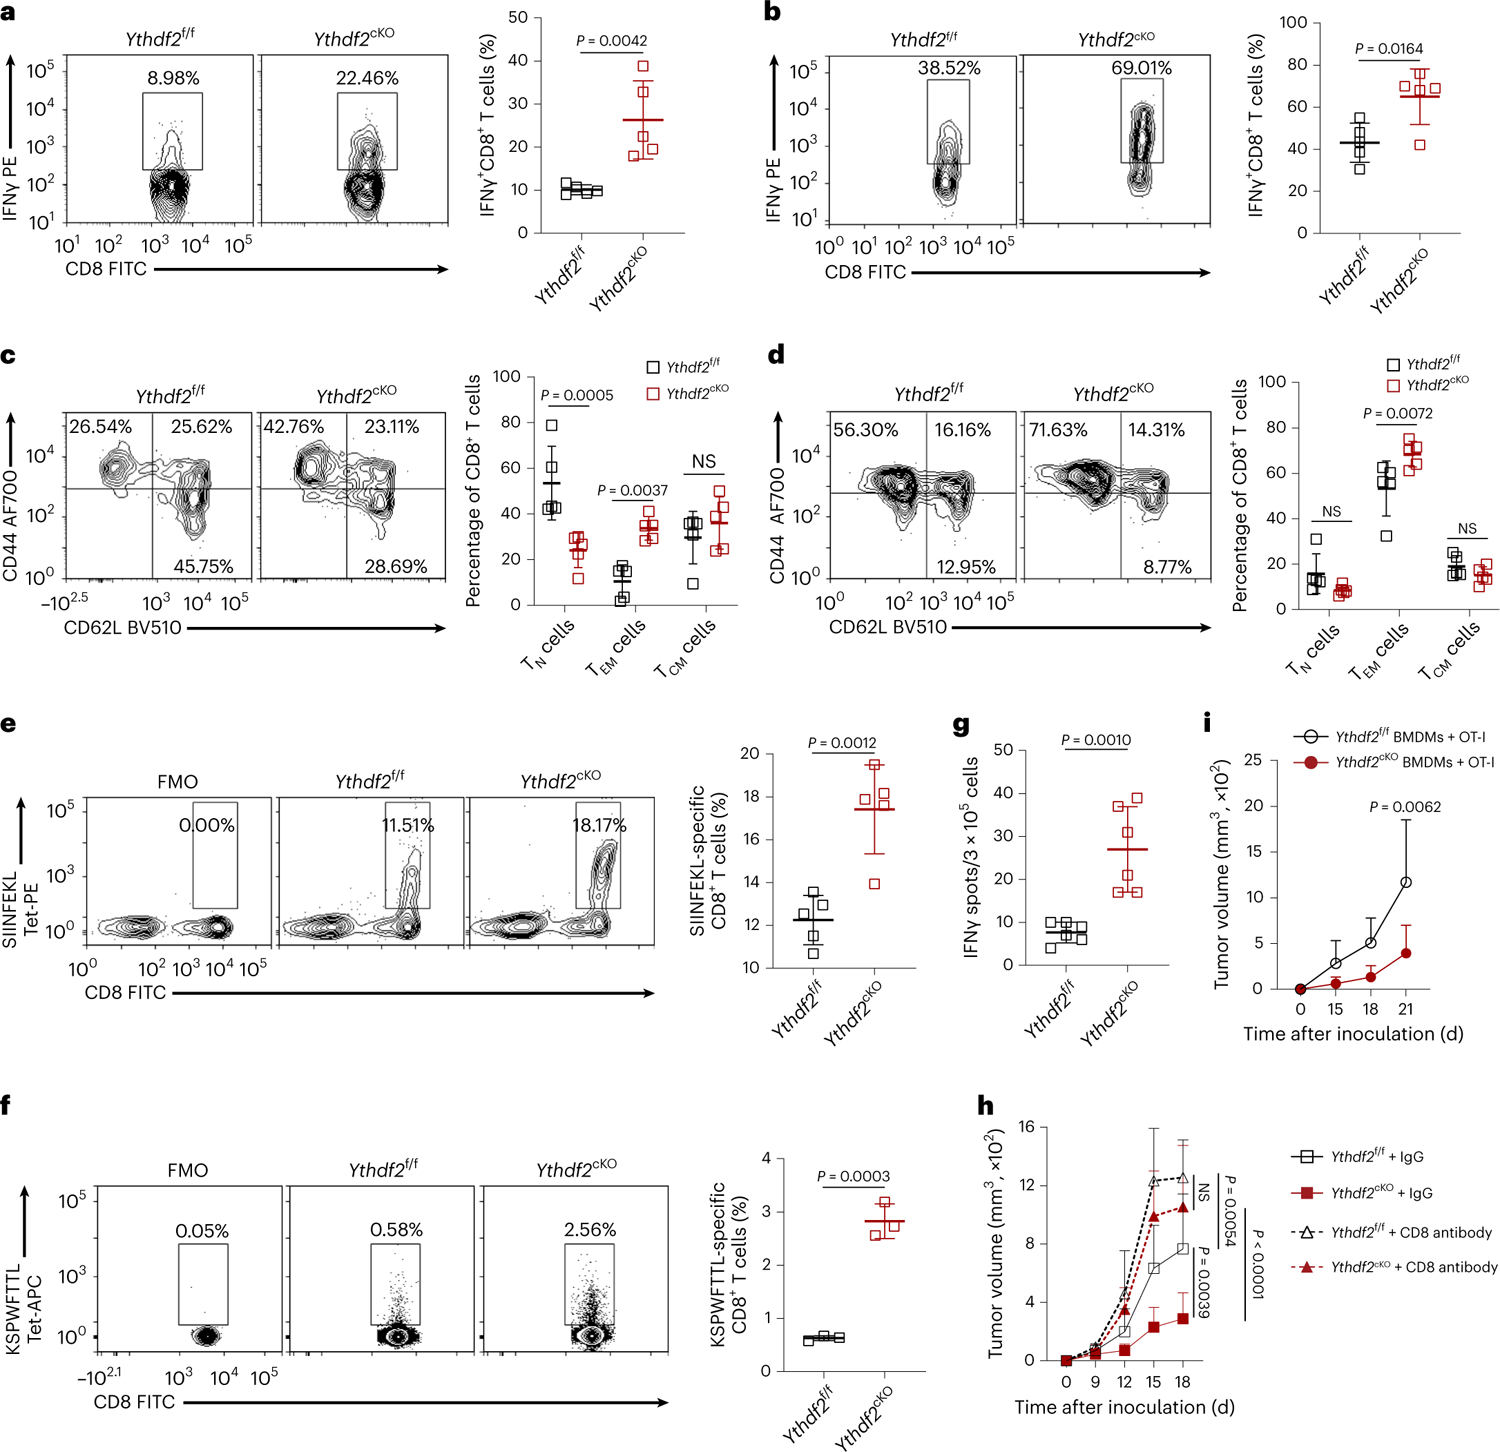
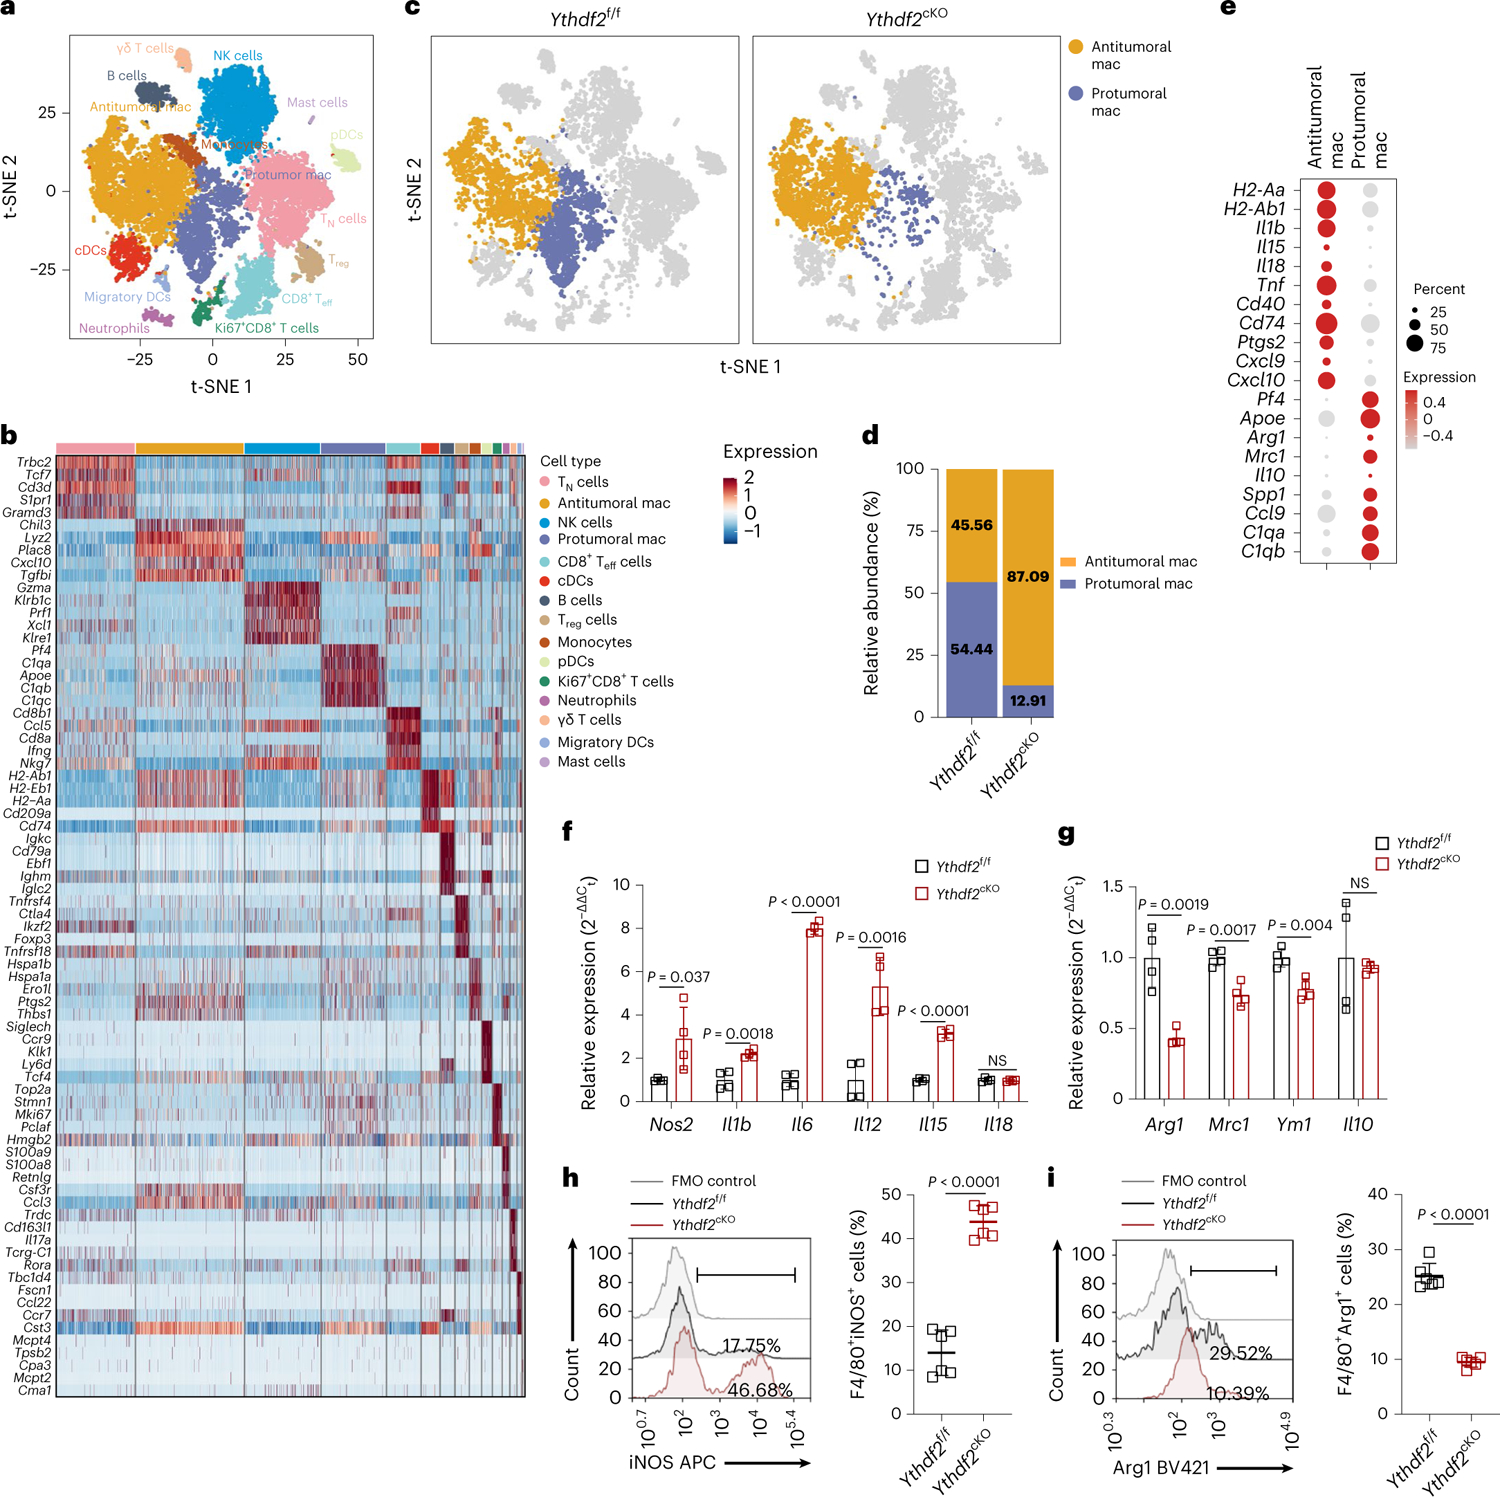
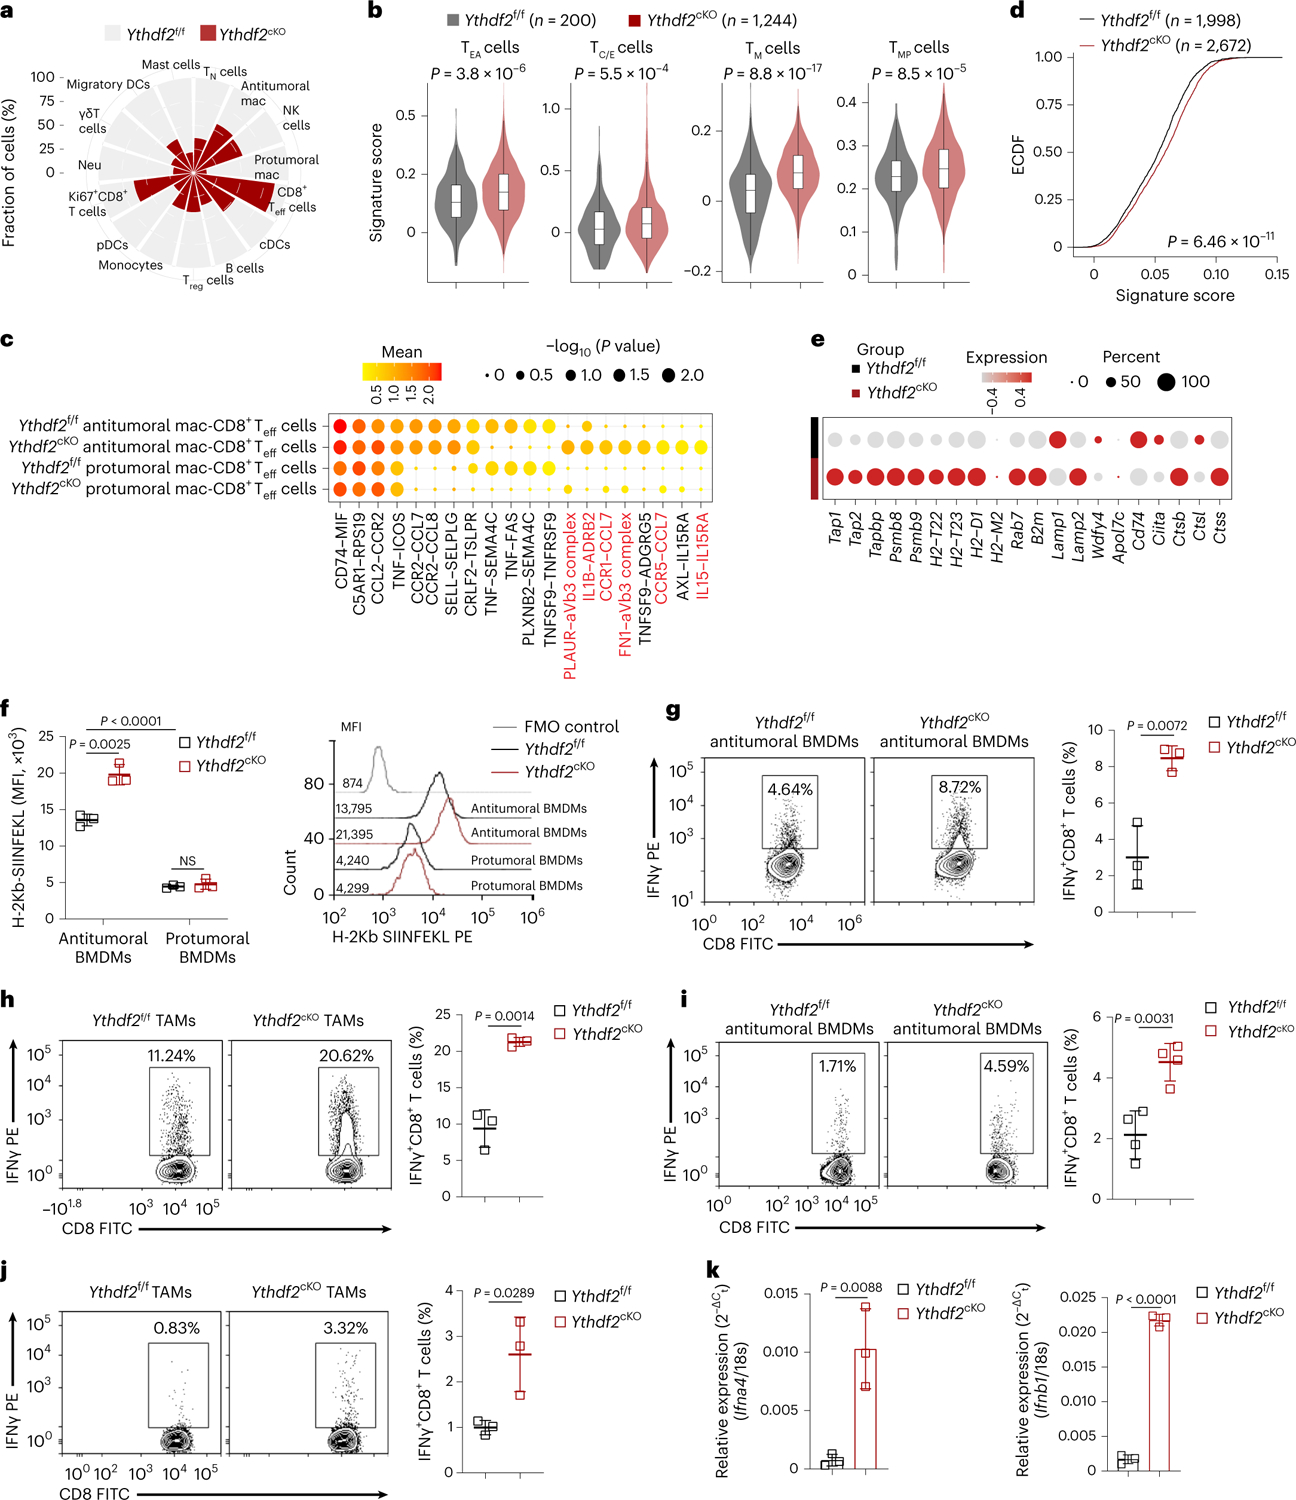
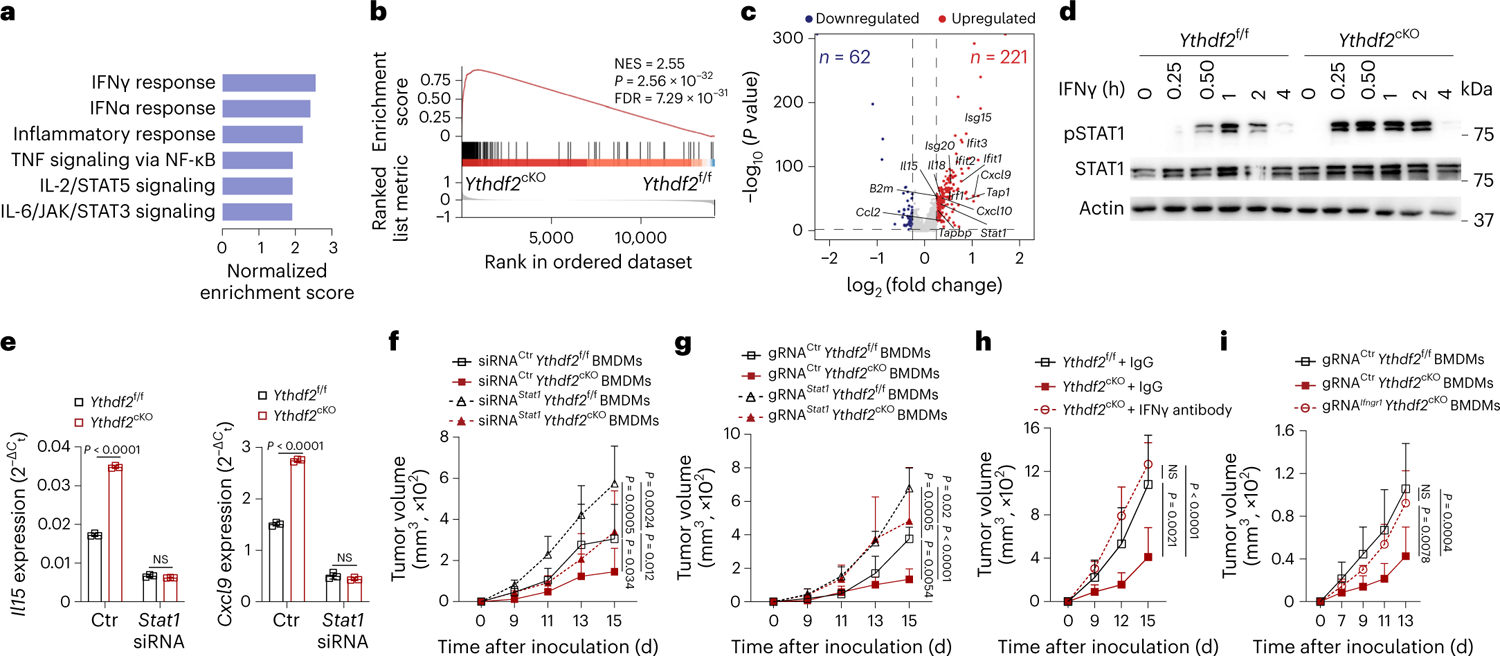
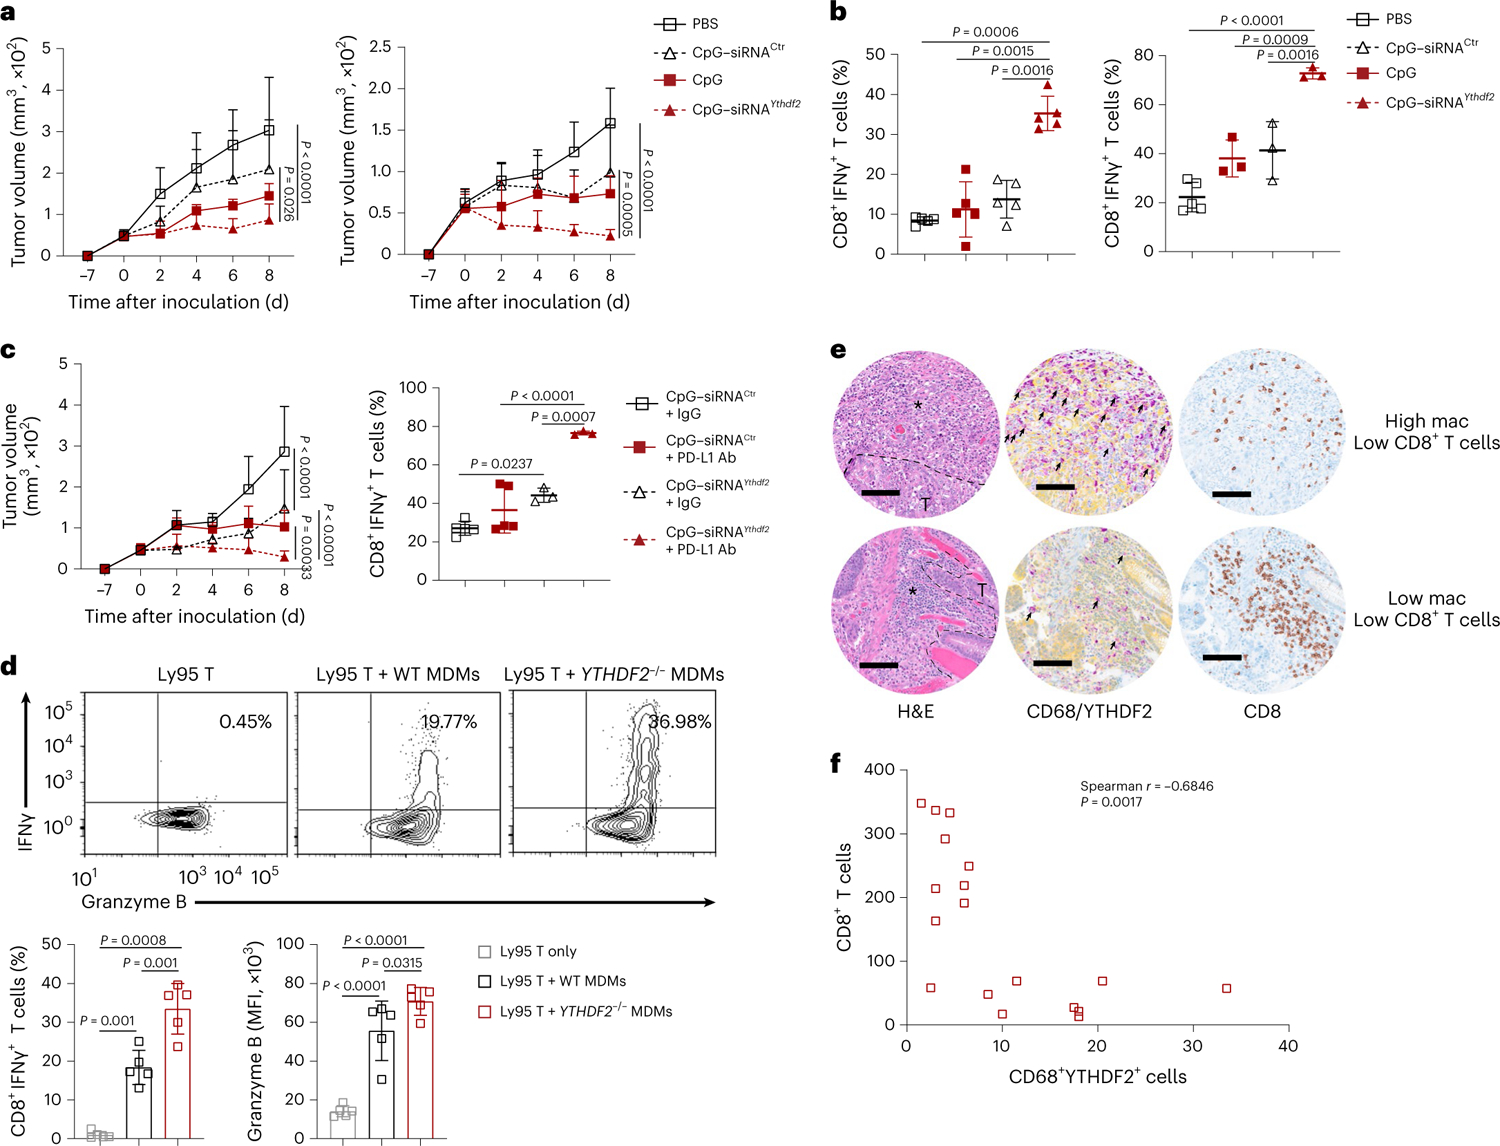
Despite tumor-associated macrophages (TAMs) playing a key role in shaping the tumor microenvironment (TME), the mechanisms by which TAMs influence the TME and contribute to cancer progression remain unclear. Here, we show that the N6-methyladenosine reader YTHDF2 regulates the antitumor functions of TAMs. YTHDF2 deficiency in TAMs suppressed tumor growth by reprogramming TAMs toward an antitumoral phenotype and increasing their antigen cross-presentation ability, which in turn enhanced CD8+ T cell-mediated antitumor immunity. YTHDF2 deficiency facilitated the reprogramming of TAMs by targeting interferon-γ-STAT1 signaling. The expression of YTHDF2 in TAMs was regulated by interleukin-10-STAT3 signaling. Selectively targeting YTHDF2 in TAMs using a Toll-like receptor 9 agonist-conjugated small interfering RNA reprogrammed TAMs toward an antitumoral phenotype, restrained tumor growth and enhanced the efficacy of PD-L1 antibody therapy. Collectively, our findings describe the role of YTHDF2 in orchestrating TAMs and suggest that YTHDF2 inhibition is an effective approach to enhance cancer immunotherapy.


Conflict of interest statement

Competing interests

The authors declare no competing interests.

Figures

Extended Data Fig. 1 |
Extended Data Fig. 1 |. TCGA database and public single-cell RNA-seq data analysis to determine expression pattern of YTHDF2 in cancers and tumor-infiltrating myeloid cells.
a, Boxplots showing the YTHDF2 expression in multiple types of cancers and corresponding normal tissues from RNA-seq results of the TCGA database. Red and blue boxes indicate the tumor group and normal group, respectively. The horizontal line indicates the median value; the box represents the first and third quartiles. Data were analyzed by two-sided unpaired wilcoxon test. b, Scatter plots showing an inverse Spearman’s correlation betweenYTHDF2 expression and immune scores calculated by the ESTIMATE algorithm from the TCGA database. Data are shown as a fitted line with 95% confidence level and were analyzed by linear model. c, The bubble plots showing the positive correlation of YTHDF2 expression with immune-related markers in each type of cancer. d-f, YTHDF2 expression in tumor-infiltrating myeloid cells and corresponding normal tissues from single-cell RNA-seq datasets of GBM (d), COAD (e), and BRCA (f). P values were calculated by two-sided unpaired wilcoxon test. Abbreviation for TCGA cancer types: BRCA, Breast invasive carcinoma; CHOL, Cholangiocarcinoma; COAD, Colon adenocarcinoma; DLBC, Lymphoid neoplasm diffuse large B-cell lymphoma; GBM, Glioblastoma multiforme; LGG, Brain lower grade glioma; PAAD, Pancreatic adenocarcinoma; READ, Rectum adenocarcinoma; SKCM, Skin cutaneous melanoma; STAD, Stomach adenocarcinoma; TGCT, Testicular germ cell tumors; THYM, Thymoma; UCEC, Uterine corpus endometrial carcinoma; UCS, Uterine carcinosarcoma.
Extended Data Fig. 2 |
Extended Data Fig. 2 |. YTHDF2 deficiency in myeloid cells does not affect the percentages, absolute numbers, or functions of tumor-infiltrating MDSCs and DCs.
a, b, qPCR (a) (n = 4) and immunoblotting (b) showing the expression of YTHDF2 in splenicCD3CD19CD49bCD11b+ myeloid cells from Ythdf2f/f and Ythdf2cKO mice. c, d, qPCR (c) (n = 4) and immunoblotting (d) showing the expression of YTHDF2 in bone marrow-derived macrophages (BMDMs) from Ythdf2f/f and Ythdf2cKO mice. e-g, Gating strategy (e), percentages (f), and absolute numbers (g) of CD11c+MHC-II+ DCs, CD11b+F4/80+ macrophages, CD11b+Ly6c+ monocytes, and CD11b+Ly6G+ neutrophils in the spleen of Ythdf2f/f and Ythdf2cKO (n = 3). h-k, Percentages (h, j) and absolute numbers (i, k) of tumor-infiltrating CD11b+Gr-1+ MDSCs and CD11b+CD11c+MHC-II+ DCs from Ythdf2f/f and Ythdf2cKO mice on day 14 post-B16-OVA (h, i) or MC38 (j, k) tumor inoculation (n = 5). l, Percentages and representative plots of IFN-γ-producing OT-I CD8+ T cells co-cultured with purified tumor-infiltrated CD11b+Gr-1+ MDSCs from B16-OVA bearing Ythdf2f/f and Ythdf2cKO mice in the presence of SIINFEKEL (n = 3). m, Percentages and representative plots of IFN-γ-producing OT-I CD8+ T cells co-cultured with purified tumor-infiltrated CD11b+CD11c+MHC-II+ DCs from B16-OVA-bearing Ythdf2f/f and Ythdf2cKO mice in the presence of SIINFEKEL (n = 3). n, o, Percentages of IFN-γ-producing OT-I CD8+ T cells co-cultured with purified tumor-infiltrated MDSCs (n) or DCs (o) from B16-OVA-bearing Ythdf2f/f and Ythdf2cKO mice in the presence of ovalbumin protein (n = 3). p, q, Immunoblotting showing the expression of YTHDF2 in BMDCs (p) or splenic DCs (q) from Ythdf2f/f and Ythdf2cKO mice. r, Percentages of tumor-infiltrating CD11b+F4/80+ macrophages after injection with clodronate liposomes or PBS liposomes in B16-OVA-bearing Ythdf2f/f and Ythdf2cKO mice (Ythdf2f/f + PBS liposome, n = 6; Ythdf2cKO + PBS liposome, n = 5; Ythdf2cKO + clodronate liposome, n = 4). s, Schematic diagram showing s.c. co-injection of B16-OVA cells with BMDMs from CD45.2 mice into CD45.1 mice and representative plots of the macrophages in the tumor tissues on day 14 post-B16-OVA tumor inoculation. Data are shown as mean ± SD and were analyzed with an unpaired two-tailed t-test (a-o) or one-way ANOVA with the Holm-Šídák post-test (r). Data in a, b, c, d, f-r are representative of at least two independent experiments. NS, not significant.
Extended Data Fig. 3 |
Extended Data Fig. 3 |. YTHDF2 deficiency in myeloid cells does not affect phagocytosis by macrophages and CD4+ T and NK cells in the tumor microenvironment.
a, b, Median fluorescence intensity (MFI, a) and representative histogram (b) of pHrodo red zymosan bioparticles uptake by anti-tumoral BMDMs from Ythdf2f/f and Ythdf2cKO mice (n = 3). c, B16-OVA tumor growth on day 18 post-B16-OVA tumor inoculation in Rag1−/− mice s.c. transplanted with BMDMs from Ythdf2f/f and Ythdf2cKO mice (n = 3). d, B16-OVA tumor growth on day 13 post-B16-OVA tumor inoculation in Rag1−/− mice that were i.v. injected with CD3+ T cells and s.c. transplanted with BMDMs from Ythdf2f/f and Ythdf2cKO mice (n = 5). e-h, Percentages (e, g) and absolute numbers (f, h) of tumor-infiltrating CD4+ T cells, CD8+ T cells, and CD3NK1.1+ NK cells from Ythdf2f/f and Ythdf2cKO mice on day 14 post-B16-OVA tumor cell implantation (e, f) or MC38 (g, h) tumor inoculation (n = 5). i, j, Percentages and representative plots of tumor-infiltrating CD4+ IFN-γ+ TH1 cells, CD4+ IL-17A+ TH17 cells, CD4+ Foxp3+ Treg cells, and granzyme B-producing NK cells from Ythdf2f/f and Ythdf2cKO mice on day 14 post B16-OVA (i) or MC38 (j) tumor inoculation (n = 4). Data are shown as mean ± SD and were analyzed with an unpaired two-tailed t-test (a, e-j) or two-way ANOVA with mixed-effects model and adjusted by the Holm-Šídák post-test (c, d). Data in a-j are representative of at least two independent experiments. NS, not significant.
Extended Data Fig. 4 |
Extended Data Fig. 4 |. scRNA-seq of CD45+ tumor-infiltrating immune cells.
a, A t-distributed stochastic neighbor embedding (t-SNE) plot from scRNA-seq showing 15 cell clusters of CD45+ tumor-infiltrating immune cells that were sorted from B16-OVA tumor-bearing Ythdf2f/f and Ythdf2cKO mice on day 14 post B16-OVA tumor inoculation. b, Immunoblotting showing expression of iNOS in anti-tumoral BMDMs and expression of Arg1 in pro-tumoral BMDMs from Ythdf2f/f and Ythdf2cKO mice. The numbers below a lane indicate expression of target proteins normalized to expression of β-actin. Data in b are representative of at least two independent experiments.
Extended Data Fig. 5 |
Extended Data Fig. 5 |. YTHDF2 deficiency improves macrophage anti-tumoral polarization by targeting IFN-γ-STAT1 signaling.
a, Ingenuity pathway analysis showing the top four pathways enriched in Ythdf2cKO anti-tumoral macrophages compared to Ythdf2f/f anti-tumoral macrophages. P values were determined by hypergeometric test and adjusted for multiple testing using the Benjamini–Hochberg method. b, qPCR showing the expression of IFN-γ response genes in BMDMs from Ythdf2f/f and Ythdf2cKO mice that were treated with IFN-γ (100 ng/ml) for 6 h (n = 3). c, qPCR showing the expression of Stat1 in CD11b+F4/80+ TAMs isolated from tumor tissues of B16-OVA tumor-bearing Ythdf2f/f and Ythdf2cKO on day 14 post B16-OVA tumor inoculation (n = 4). d, Immunoblotting showing the expression of phosphor (p)-STAT1 and STAT1 in CD11b+F4/80+ TAMs isolated from tumor tissues of B16-OVA tumor-bearing Ythdf2f/f and Ythdf2cKO mice on day 14 post-B16-OVA tumor inoculation. e, Immunoblotting showing the expression of STAT1 in BMDMs transfected with Stat1 siRNA or control siRNA. f, Immunoblotting showing the expression of STAT1 in BMDMs nucleofected with Stat1 gRNA or control gRNA. g, Representative histogram of the expression of IFNGR1 in BMDMs nucleofected with Ifngr1 gRNA or control gRNA. h, B16-OVA tumor growth on day 18 post-tumor inoculation in Rag1−/− mice s.c. implanted with BMDMs from Ythdf2f/f and Ythdf2cKO mice together with i.v. injection of CD8+ T cells from IFN-γ−/− mice (n = 4). Data are shown as mean ± SD and were analyzed with an unpaired two-tailed t-test (b, c) or two-way ANOVA with mixed-effects model and adjusted by the Holm-Šídák post-test (h). The numbers below a lane indicate relative expression levels of target proteins normalized to the expression of β-actin. Data in b-h are representative of at least two independent experiments. NS, not significant.
Extended Data Fig. 6 |
Extended Data Fig. 6 |. Transcriptome-wide identification of YTHDF2-binding targets in macrophages using m6A-RIP and YTHDF2 RIP.
a, HOMER motif discovery tool showing the m6A motif in BMDMs from both Ythdf2f/f and Ythdf2cKO mice. b, Density distribution of m6A peaks across the length of mRNA. c, Pie chart depicting the fraction of m6A peaks in four transcript segments. d, Volcano plot showing the differentially expressed genes in anti-tumoral macrophages from Ythdf2cKO mice compared with those from Ythdf2f/f mice from RNA-seq. DEGs with absolute log-transformed fold change > 0.25 and adjusted P < 0.05 (determined by two-sided Wilcoxon rank sum test and adjusted using Bonferroni correction) were defined as significant. e, GSEA results showing the top six pathways enriched in Ythdf2cKO anti-tumoral macrophages compared to Ythdf2f/f anti-tumoral macrophages. The P values were calculated by a permutation test. f, GSEA results showing enrichment of IFN-γ response sets in Ythdf2cKO anti-tumoral macrophages compared to Ythdf2f/f anti-tumoral macrophages. g, Heatmaps showing the relative expression of representative genes in Ifng, Tnf, Ifna, Irf7, Tlr4, and Stat1 signaling pathways in BMDMs from Ythdf2f/f and Ythdf2cKO mice from RNA-seq data (n = 2). Transcript methylation is depicted by filled (m6A-modified) or unfilled (non-m6A-modified) circles. h, Scatterplot showing the overlap of high confidence YTHDF2-binding peaks between replicate 1 and replicate 2 in YTHDF2 RIP-seq. i, Density distribution of YTHDF2-binding peaks across the length of mRNA. j, Pie chart depicting the fraction of YTHDF2-binding peaks in four transcript segments.
Extended Data Fig. 7 |
Extended Data Fig. 7 |. YTHDF2 is positively regulated by IL-10–STAT3 signaling in TAMs.
a, Immunoblotting showing the expression of YTHDF2 in CD11b+F4/80+ macrophages isolated from spleen or tumor tissues of B16-OVA tumor-bearing C57BL/6 mice on day 14-post B16-OVA tumor inoculation. b, Immunoblotting showing the expression of YTHDF2 in BMDMs stimulated without or with IL-4, TGF-β, IL-10, or IFN-γ for 24 h. c, Immunoblotting showing the expression of YTHDF2 and phospho-Stat3 in BMDMs stimulated with different doses of IL-10 for 24 h. d, Binding sites for STAT3 in the promoter regions of Ythdf2 (predicted from http://jaspar.genereg.net). e, Luciferase reporter assay showing the luciferase activity of Ythdf2 in BMDMs transfected with STAT3 expressing plasmid or empty vector (n = 3). f, ChIP-qPCR showing the binding of STAT3 to the Ythdf2 promoter in IL-10 (10 ng/ml)–treated BMDMs (n = 3). g, Immunoblotting showing the expression of YTHDF2 and phospho-Stat3 in BMDMs from Stat3f/fand Stat3cKO mice stimulated without or with IL-10 (10 ng/ml). Data are shown as mean ± SD and were analyzed with an unpaired two-tailed t-test (e, f). The numbers below a lane indicate the expression of YTHDF2 normalized to the expression of β-actin. Data in a, b, c, e, f, and g are representative of at least two independent experiments. NS, not significant.
Extended Data Fig. 8 |
Extended Data Fig. 8 |. TLR9 expression and CpG-Ythdf2 siRNA design as well as its uptake by macrophages associated with anti-tumor effect in vivo.
a, Violin plot showing the Tlr9 expression across 15 cell clusters from scRNA-seq data in this study. b, Sequence of the CpG-linked mouse Ythdf2 siRNA conjugate (CpG–siRNAYthdf2). c, d, Representative histograms showing the expression of Cy3-CpG-siRNAYthdf2 in wild-type BMDMs incubated with various doses of Cy3-CpG-siRNAYthdf2 (c) or with 100 nM Cy3-labeled CpG-Ythdf2 siRNA for the indicated times (d). e, Representative histograms showing the uptake of Cy3-CpG-siRNAYthdf2 by CD11b+F4/80+ TAMs isolated from tumor tissues of B16-OVA-bearing wild-type mice that received intratumoral (i.t.) injection of CpG-siRNAYthdf2. f, qPCR showing the mRNA expression of mRNA Ythdf2 in CD11b+F4/80+ TAMs sorted from tumor tissues of B16-OVA-bearing mice i.t. injected with CpG-siRNAYthdf2 or CpG-siRNACtrl (n = 3). g, h, Representative dot plots and percentages of CD11b+F4/80+iNOS+ anti-tumoral macrophages (g) or h, CD11b+F4/80+Arg1+ pro-tumoral macrophages (h) in tumor tissues from B16-OVA-bearing mice that received i.t. injection of CpG-siRNAYthdf2 or CpG-siRNACtrl (n = 5). i, qPCR showing the mRNA expression of Ythdf2 in CD11b+F4/80+ TAMs isolated from lung tissues of B16-F10-bearing mice that received i.v. injected of CpG-siRNAYthdf2 or CpG-siRNACtrl (n = 3). j, k, Metastatic nodules (j) and percentages of tumor-infiltrating IFN-γ producing CD8+ T cells (k) in the lung of B16F10-bearing mice that received i.v. injection of CpG-siRNAYthdf2, CpG-siRNACtrl, CpG, or PBS (n = 5). l, B16-OVA tumor growth on day 13 post-tumor inoculation in Batf3−/− mice treated with CpG-siRNAYthdf2 or CpG-siRNACtrl (n = 5). m, n, Violin plots showing the TLR9 expression across cell clusters in scRNA-seq datasets of patients with glioblastoma (m) or kidney cancer (n). o, p, Representative histograms showing expression levels of PD-L1 in B16-OVA cells (o) or BMDMs (p) after treatment with IFN-γ for 24 h. Median fluorescence intensity (MFI) is shown. Data are shown as mean ± SD and were analyzed with an unpaired two-tailed t-test (f-i) or one-way ANOVA with the Holm-Šídák post-test (j, k) or two-way ANOVA with the mixed-effects model and adjusted by Holm-Šídák post-test (l). Data in c-l, o, and p are representative of at least two independent experiments.
Extended Data Fig. 9 |
Extended Data Fig. 9 |. The relationship between YTHDF2 expression in TAMs and overall survival in patients with skin cutaneous melanoma.
a, qPCR showing the mRNA expression of YTHDF2, IL1B, IL6, and IL12 in human MDMs transfected with YTHDF2 siRNA (YTHDF2−/− MDMs) or control siRNA (WT MDMs). Data are shown as mean ± SD and were analyzed by unpaired two-tailed t-test. b, Immunohistochemical staining of YTHDF2 (yellow) plus CD68 (purple) or CD8 (brown) in tumor tissues from patients with lung cancer. A representative specimen of YTHDF2+CD68+ (double positive) with a high (top panel) or low (bottom panel) number of cells is shown (f). Scale bars = 100 μm. Black arrows mark YTHDF2+CD68+ cells. c, Correlations between YTHDF2+CD68+ cells and CD8+ T cells. Data are analyzed by Spearman correlation (n = 32). d, Kaplan–Meier analysis showing the correlation of the expression of YTHDF2 in tumor infiltrated CD68+ macrophages with overall survival in patients with skin cutaneous melanoma (SKCM) from TCGA dataset. P values were calculated using the log-rank test. e, Heatmap of the ordered, z-transformed expression values for YTHDF2 target genes in patients with SKCM from TCGA dataset. f, Correlation of a YTHDF2 target gene signature with overall survival of patients with SKCM comparing high and low quartiles. P values were calculated using the log-rank test. g, Kaplan–Meier analysis showing the correlation of each of the 12 identified YTHDF2 target genes with overall survival of patients with SKCM comparing high and low expression with a 50% cutoff. P values were calculated using the log-rank test. Data in a are representative of at least two independent experiments.
Extended Data Fig. 10 |
Extended Data Fig. 10 |. A working model for how reduction in YTHDF2 reprograms tumor-associated macrophages and elicits potent anti-tumor immunity.
TAMs traffic into the TME and respond to IL-10, which upregulates YTHDF2 by IL-10–STAT3 signaling. Ablation of YTHDF2 in TAMs or knock-down of YTHDF2 by CpG-siRNAYthdf2 enhances the stability of STAT1, reprograms TAMs to induce anti-tumoral polarization, thereby facilitating CD8+ T cell anti-tumor response, and eventually suppressing tumor growth.
Fig. 1 |
Fig. 1 |. YTHDF2 deficiency in macrophages suppresses tumor growth.
a,b, B16-OVA (a) or MC38 (b) tumor growth and tumor weight on day 15 after tumor inoculation in Ythdf2f/f and Ythdf2cKO mice (n = 5 per group). c,d, B16F10 lung metastases (c; n = 5) on day 14 after i.v. injection of B16F10 melanoma cells and mouse survival (d; n = 12) in Ythdf2f/f and Ythdf2cKO mice. e,f, Representative plots, percentages and absolute numbers of TAMs from Ythdf2f/f and Ythdf2cKO mice on day 14 after B16-OVA (e) or MC38 (f) tumor inoculation (n = 5). g, B16-OVA tumor growth in Ythdf2f/f and Ythdf2cKO mice treated with clodronate liposomes or PBS liposomes (Ythdf2f/f + PBS liposome, n = 6; Ythdf2cKO + PBS liposome, n = 5; Ythdf2cKO + clodronate liposome, n = 4). h,i, B16-OVA (h; n = 6) or MC38 (i; n = 4) tumor growth on day 15 after tumor inoculation in immunocompetent CD45.1 recipient mice transplanted with Ythdf2f/f or Ythdf2cKO BMDMs. Data are shown as mean ± s.d. and were analyzed by two-way ANOVA with a mixed-effects model followed by a Holm–Šídák post test (a left, b left, g, h and i) or unpaired two-tailed t-test (a right, b right, c, e and f) or Kaplan–Meier survival analysis and log-rank test (d). Data in ah are representative of at least two independent experiments; NS, not significant.
Fig. 2 |
Fig. 2 |. YTHDF2 deficiency enhances CD8+ T cell-mediated antitumor immunity.
a,b, Representative plots and percentages of tumor-infiltrating IFNγ-producing CD8+ T cells from Ythdf2f/f and Ythdf2cKOmice on day 14 after B16-OVA (a) or MC38 (b) tumor inoculation (n = 5). c,d, Representative plots and percentages of tumor-infiltrating effector memory (TEM), central memory (TCM) and naive (TN) CD8+ T cells from Ythdf2f/f and Ythdf2cKO mice on day 14 after B16-OVA (c) or MC38 (d) tumor inoculation (n = 5). e,f, Representative plots and percentages of SIINFEKL-specific CD8+ T cells (e) or KSPWFTTL-specific CD8+ T cells (f) from Ythdf2f/f and Ythdf2cKO mice on day 14 after B16-OVA (e) or MC38 (f) tumor inoculation (n = 5). g, IFNγ-producing CD8+ T cells in the draining lymph nodes from Ythdf2f/f and Ythdf2cKO mice on day 14 after B16-OVA tumor inoculation. Cytokine levels are expressed as the number of spot-forming cells out of 3 × 10⁵ draining lymph nodes cells (n = 6). h, B16-OVA tumor growth on day 18 after tumor inoculation in Ythdf2f/f and Ythdf2cKO mice treated with IgG or CD8 antibody (Ab; Ythdf2f/f + IgG, n = 6; Ythdf2cKO + IgG, n = 6; Ythdf2f/f + CD8 Ab, n = 5; Ythdf2cKO + CD8 Ab, n = 5). i, B16-OVA tumor growth on day 21 after tumor inoculation in Rag1−/− mice s.c. implanted with BMDMs from Ythdf2f/f and Ythdf2cKO mice together with i.v. injection of CD8+ T cells from OT-I mice (Ythdf2f/f BMDMs + OT-I, n = 4; Ythdf2cKO BMDMs + OT-I, n = 5). Data are shown as mean ± s.d. and were analyzed by two-way ANOVA with a mixed-effects model and adjusted by Holm–Šídák post test (h and i) or unpaired two-tailed t-test (ag). Data in ai are representative of at least two independent experiments.
Fig. 3 |
Fig. 3 |. YTHDF2 deficiency reprograms TAMs by promoting polarization of antitumoral macrophages.
a, A t-SNE plot from scRNA-seq data showing 15 cell clusters of CD45+ tumor-infiltrating immune cells sorted from B16-OVA-bearing Ythdf2f/f and Ythdf2cKO mice on day 14 after B16-OVA tumor inoculation; mac, macrophages; pDC, plasmacytoid DC. b, Gene expression heatmap for 15 assigned cell clusters from the scRNA-seq data, as in a. Each column group is one cell, and each row represents one gene. Five representative marker genes of each cluster are labeled. c,d, t-SNE plots (c) and the proportions (d) of antitumoral and protumoral macrophages from scRNA-seq data, as in a. e, Dot plots showing the expression of representative marker genes of antitumoral and protumoral macrophages, as in a. Dot size indicates the percentage of cells expressing the indicated gene, and color intensity represents the relative gene expression level. f,g, qPCR showing mRNA expression of antitumoral macrophage-related genes (f; Nos2, Il1b, Il6, Il12, Il15 and Il18; n = 4) or protumoral macrophage-related genes (g; Arg1, Mrc1, Ym1 and Il10; n = 4) in CD11b+F4/80+ TAMs isolated from tumors of B16-OVA-bearing Ythdf2f/f and Ythdf2cKO mice. h,i, Representative histograms and percentages of CD11b+F4/80+iNOS+ antitumoral macrophages (h; n = 6) or CD11b+F4/80+Arg1+ protumoral macrophages (i; n = 6) in tumors from B16-OVA-bearing Ythdf2f/f and Ythdf2cKO mice. Data are shown as mean ± s.d. and were analyzed with an unpaired two-tailed t-test (fi). Data in fi are representative of at least two independent experiments.
Fig. 4 |
Fig. 4 |. YTHDF2 deficiency enhances antigen cross-presentation ability of antitumoral macrophages.
a, Rose diagram showing the proportions of 15 cell types in Ythdf2f/f and Ythdf2cKO mice. b, Violin plots showing the enrichment of signatures of early activated (TEA), cytokine/effector (TC/E), memory (TM) and memory precursor (TMP) CD8+ T cells in scRNA-seq data from CD45+ tumor-infiltrating immune cells sorted from Ythdf2f/f and Ythdf2cKO mice on day 14 after B16-OVA tumor inoculation. The horizontal line indicates the median value, and the box represents the first and third quartiles. P values were calculated by two-sided Wilcoxon rank-sum test. c, Dot plots showing mean strength of selected ligand–receptor pairs of antitumoral and CD8+ Teff cells. Dot size indicates the mean strength level, and color shows the P values calculated by the permutation test. d, Empirical cumulative distribution function (ECDF) plot of enrichment score for the MHC class I gene signature in antitumoral macrophages from Ythdf2f/f and Ythdf2cKO mice in scRNA-seq. Data were analyzed by two-sided unpaired Wilcoxon test. e, Dot plots showing expression features of selected genes from the MHC class I presentation signature in antitumoral macrophages from Ythdf2f/f and Ythdf2cKO mice in scRNA-seq. Dot size indicates the percentage of cells expressing the indicated gene, and color intensity represents the relative gene expression level. f, Representative histograms and percentages of H-2Kb SIINFEKL-positive antitumoral or protumoral macrophages in tumor tissues from Ythdf2f/f and Ythdf2cKO mice on day 14 after B16-OVA tumor inoculation (n = 3). gj, Representative plots and percentages of IFNγ-producing OT-I CD8+ T cells cocultured with the SIINFEKEL peptide (g and i) or the OVA protein (h and j)-loaded antitumoral BMDMs (g, n = 3; h, n = 4) or CD11b+F4/80+ TAMs isolated from B16-OVA tumor-bearing mice on day 14 after B16-OVA tumor inoculation (i, n = 3; j, n = 3). k, qPCR showing the expression of Ifng4 and Ifnb1 from CD11b+F4/80+ macrophages isolated from B16-OVA tumor-bearing Ythdf2f/f and Ythdf2cKO mice on day 14 after B16-OVA tumor inoculation (n = 3). Data are representative of at least three independent experiments, are shown as mean ± s.d. and were analyzed by unpaired two-tailed t-test (fk).
Fig. 5 |
Fig. 5 |. YTHDF2 deficiency drives antitumoral macrophage polarization via IFNγ–STAT1 signaling.
a, Top six enriched pathways in Ythdf2cKO antitumoral macrophages compared to the Ythdf2f/f macrophages from GSEA. b, Enrichment of the IFNγ response in antitumoral macrophages from Ythdf2cKO mice compared to those from Ythdf2f/f mice; NES, normalized enrichment score; FDR, false discovery rate. c, Volcano plot showing the DEGs between antitumoral macrophages from Ythdf2f/f mice and those from Ythdf2cKO mice. DEGs (differentially expressed genes) with an absolute log-transformed fold change of >0.25 and adjusted P value of <0.05 (determined by two-sided Wilcoxon rank-sum test and adjusted using the Bonferroni correction) were defined as significant. d, Immunoblotting assay of STAT1 phosphorylation (pSTAT1) in IFNγ-treated BMDMs from Ythdf2f/f and Ythdf2cKO mice. e, qPCR of Il15 and Cxcl9 mRNA expression in antitumoral macrophages transfected with Stat1 siRNA or control siRNA (n = 3). f, B16-OVA tumor growth on day 15 after tumor inoculation in immunocompetent C57BL/6 mice transplanted with Stat1-knockdown (siRNAStat1) or control (siRNACtr) BMDMs from Ythdf2f/f or Ythdf2cKO mice (n = 5). g, B16-OVA tumor growth on day 15 after tumor inoculation in immunocompetent C57BL/6 mice transplanted with Stat1-knockout (gRNAStat1) or control (gRNACtr) BMDMs from Ythdf2f/f or Ythdf2cKO mice (n = 5); gRNA, guide RNA. h, B16-OVA tumor growth on day 15 after tumor inoculation in Ythdf2f/f and Ythdf2cKO mice treated with IgG or IFNγ antibody (Ythdf2f/f + IgG, n = 5; Ythdf2cKO + IFNγ antibody, n = 5; Ythdf2cKO + IgG, n = 4). i, B16-OVA tumor growth on day 13 after tumor inoculation in immunocompetent C57BL/6 mice transplanted with Ifngr1-knockout BMDMs (gRNAIfngr1) from Ythdf2cKO mice (n = 5) or control (gRNACtr) BMDMs from Ythdf2f/f or Ythdf2cKO mice (n = 5). Data are shown as mean ± s.d. and were analyzed by one-way ANOVA with a Holm–Šídák post test (e) or two-way ANOVA with mixed-effects model followed by a Holm–Šídák post test (fi). Data in di are representative of at least two independent experiments.
Fig. 6 |
Fig. 6 |. YTHDF2 decreases stability of Stat1 mRNA in macrophages.
a, Integrative Genomics Viewer tracks displaying the distribution of m6A peaks and YTHDF2-binding peaks across the Stat1 transcripts. b, Schematic representation of m6A positions and mutations within the Stat1 3′ UTR; Mut, mutant; chr, chromosome. c,d, RIP using either an antibody to m6A (c; n = 3) or to YTHDF2 (d; n = 3) followed by qPCR in antitumoral macrophages showing that the two Stat1 sites in the 3′ UTR region were m6A methylated and enriched in YTHDF2 binding. Rabbit IgG served as a control. Enrichment of the indicated genes was normalized to the input level. e, mRNA half-life (t1/2) of Stat1 transcripts in antitumoral macrophages from Ythdf2f/f and Ythdf2cKO mice. The two slopes for the two groups were compared by t-test under the linear regression model frame taking into account the time by group interaction. f, Relative luciferase activity of firefly luciferase (F-Luc)/Renilla luciferase (R-Luc) of pmirGLO-3′UTR-WT, pmirGLO-3′UTR-Mut-1, pmirGLO-3′UTR-Mut-2 or pmirGLO-3′UTR-Mut-1 plus pmirGLO-3′UTR-Mut-2 in Ythdf2f/f and Ythdf2cKO BMDMs (n = 3). Data are shown as mean ± s.d. and were analyzed by unpaired two-tailed t-test (c, d and f). Data in c, d, e and f are representative of at least two independent experiments.
Fig. 7 |
Fig. 7 |. TLR9-targeted YTHDF2 silencing in TAMs suppresses tumor growth and displays a better effect when combined with anti-PD-L1.
a, B16-OVA (left; n = 5) or MC38 (right; n = 5) tumor growth in mice i.t. injected with CpG–siRNAYthdf2, CpG–siRNACtrl, CpG or PBS 7, 9, 11 and 13 days after tumor inoculation on day −7. Data on day 8 were used for statistical analysis. b, Percentages of tumor-infiltrating IFNγ-producing CD8+ T cells on day 8 in B16-OVA (n = 5) or MC38 tumor models (PBS, n = 5; CpG, n = 3; CpG–siRNACtrl, n = 3; CpG–siRNAYthdf2, n = 3), as described in a. c, B16-OVA tumor growth in mice treated with CpG–siRNAYthdf2, CpG–siRNACtrl or in combination with anti-PD-L1 (left; CpG–siRNACtrl + IgG, n = 5; CpG–siRNAYthdf2 + IgG, n = 5; CpG–siRNACtrl + PD-L1 antibody, n = 6; siRNAYthdf2 + PD-L1 antibody, n = 6) and percentages of tumor-infiltrating IFNγ-producing CD8+ T cells (right; CpG–siRNACtrl + IgG, n = 5; CpG–siRNAYthdf2 + IgG, n = 3; CpG–siRNACtrl + PD-L1 antibody, n = 5; siRNAYthdf2 + PD-L1 antibody, n = 3). CpG–siRNACtrl and CpG–siRNAYthdf2 were treated as in a, while PD-L1 antibody was injected on days −7 and 0. Data on day 8 were used for statistical analysis. d, Representative plots and percentages of IFNγ and granzyme B expression in Ly95 T cells when cocultured with wild-type (WT) or YTHDF2−/− MDMs preloaded with NY-ESO157-C165 peptide (n = 5); MFI, median fluorescence intensity. e, Hematoxylin and eosin (H&E) staining and immunohistochemical staining of YTHDF2 (yellow) plus CD68 (purple) or CD8 (brown) in tumor tissues from individuals with COAD. Dashed lines outline the edge of tumor (T) zones. Asterisks mark the stroma tissues. A representative specimen of YTHDF2+CD68+ (double positive) with a high (top) or low (bottom) number of cells is shown (f); scale bars, 100 μm. Black arrows mark YTHDF2+CD68+ cells. f, Correlations between YTHDF2+CD68+ cells and CD8+ T cells in the stroma area as in e are shown (n = 18). Data are shown as mean ± s.d. and were analyzed by one-way ANOVA with a Holm–Šídák post test (b, c right and d) or two-way ANOVA with mixed-effects model (a and c left) and were adjusted by a Holm–Šídák post test or Spearman correlation (f). Data in a, b, c and d are representative of at least two independent experiments.

Similar articles

Cited by

References

    1. Murciano-Goroff YR, Warner AB & Wolchok JD The future of cancer immunotherapy: microenvironment-targeting combinations. Cell Res. 30, 507–519 (2020). - PMC - PubMed
    1. Schupp J et al. Targeting myeloid cells in the tumor sustaining microenvironment. Cell Immunol. 343, 103713 (2019). - PubMed
    1. Engblom C, Pfirschke C & Pittet MJ The role of myeloid cells in cancer therapies. Nat. Rev. Cancer 16, 447–462 (2016). - PubMed
    1. Ruffell B et al. Macrophage IL-10 blocks CD8+ T cell-dependent responses to chemotherapy by suppressing IL-12 expression in intratumoral dendritic cells. Cancer Cell 26, 623–637 (2014). - PMC - PubMed
    1. Qian BZ & Pollard JW Macrophage diversity enhances tumor progression and metastasis. Cell 141, 39–51 (2010). - PMC - PubMed

Publication types