. 2023 Feb;24(2):309-319.
doi: 10.1038/s41590-022-01395-9. Epub 2023 Jan 19.

Tissue adaptation and clonal segregation of human memory T cells in barrier sites

Affiliations

Tissue adaptation and clonal segregation of human memory T cells in barrier sites

Maya M L Poon et al. Nat Immunol. 2023 Feb.

Abstract

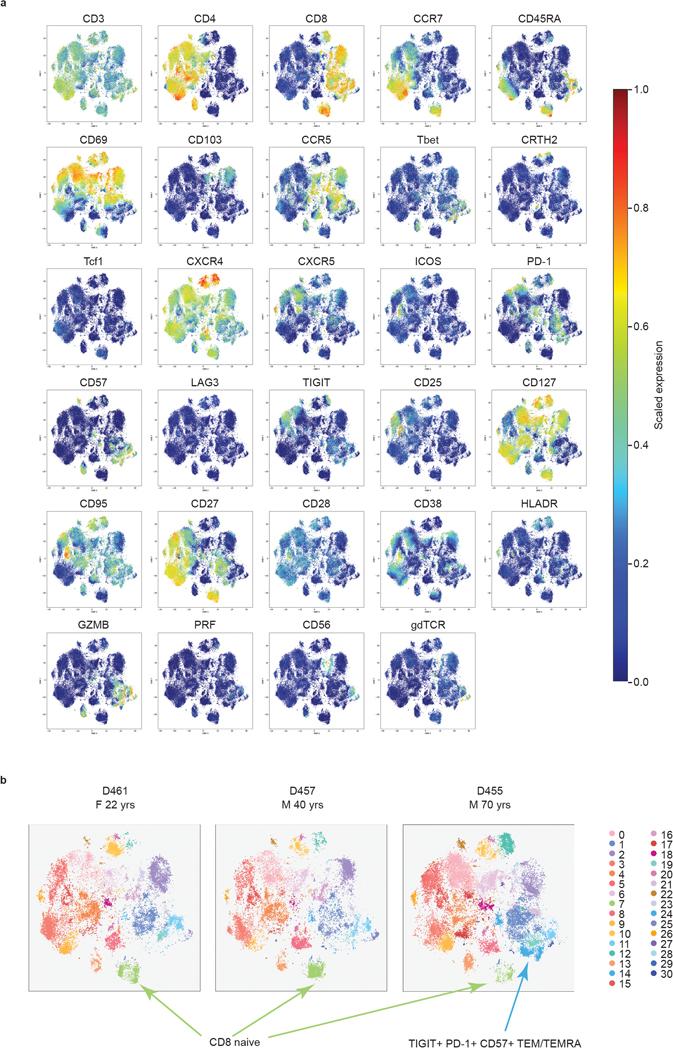
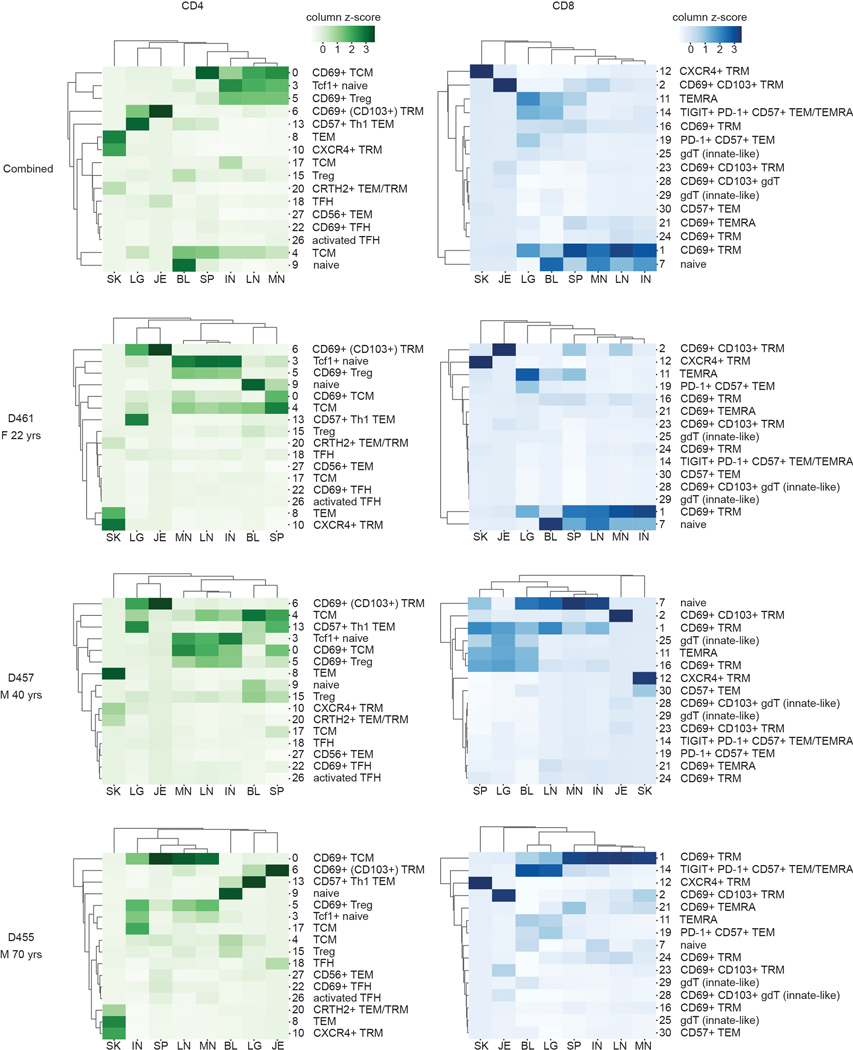
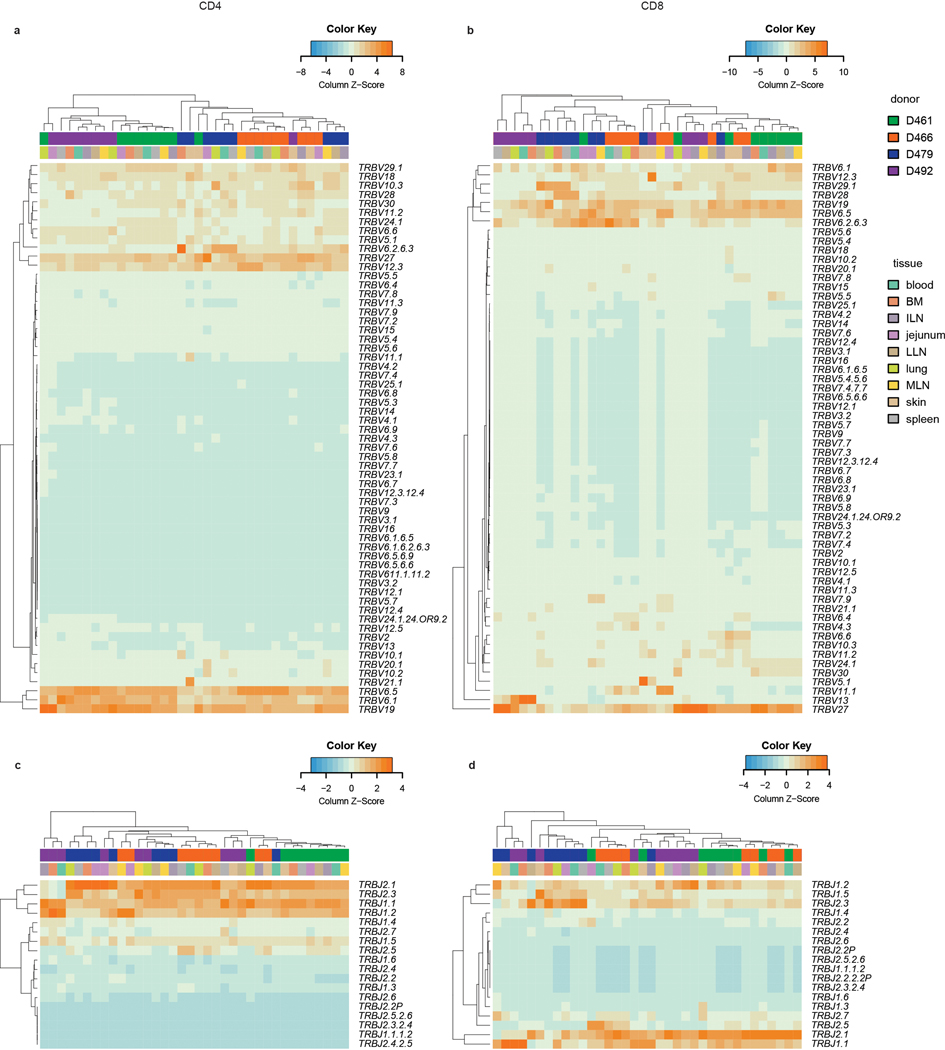
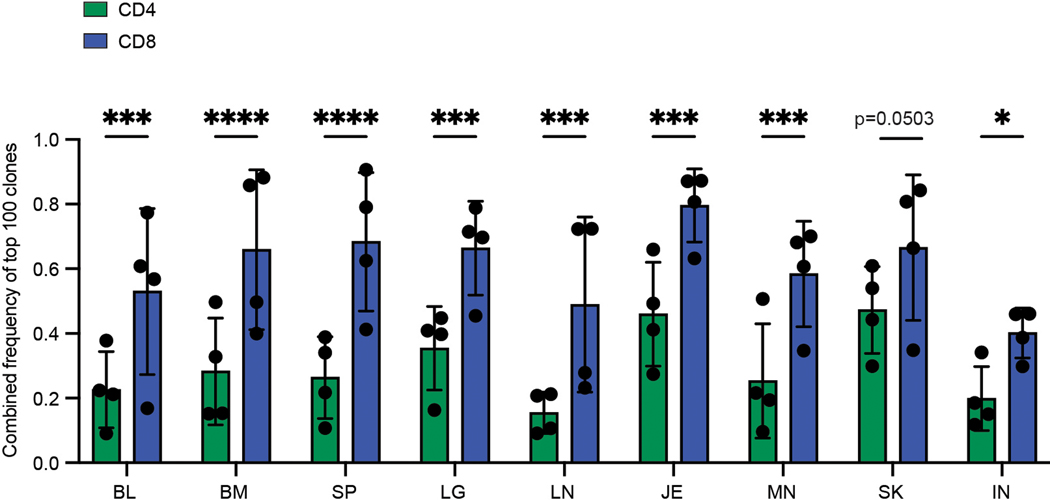
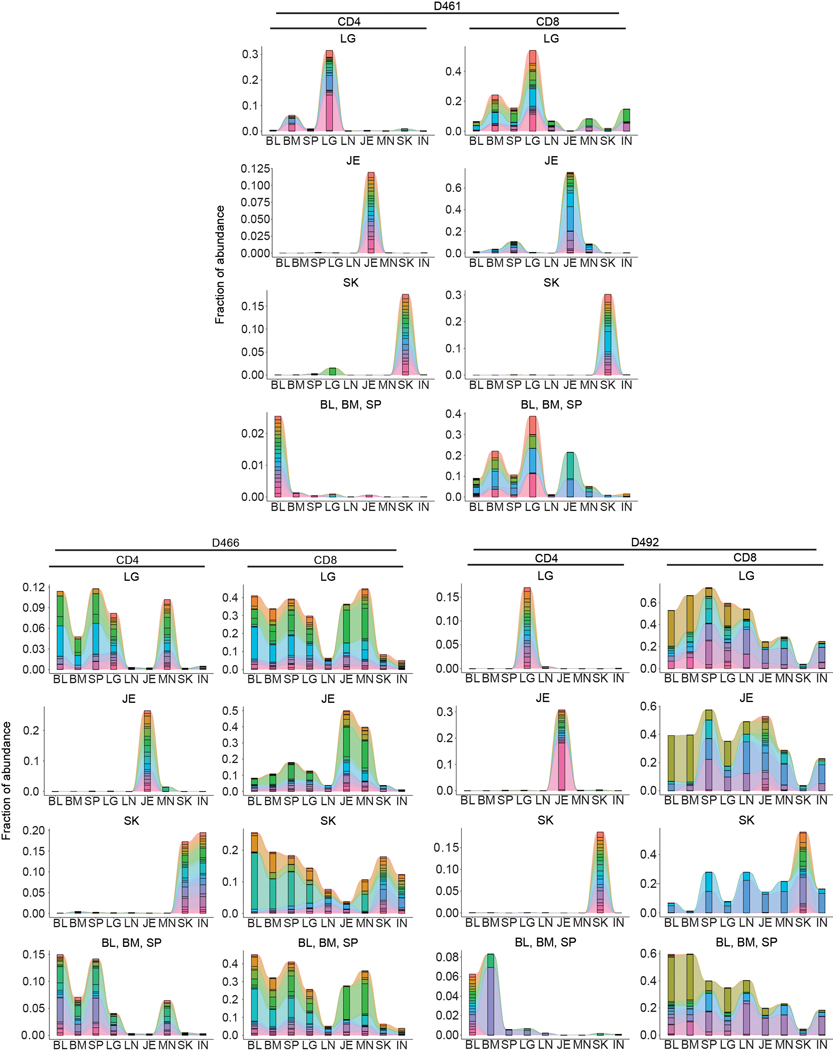
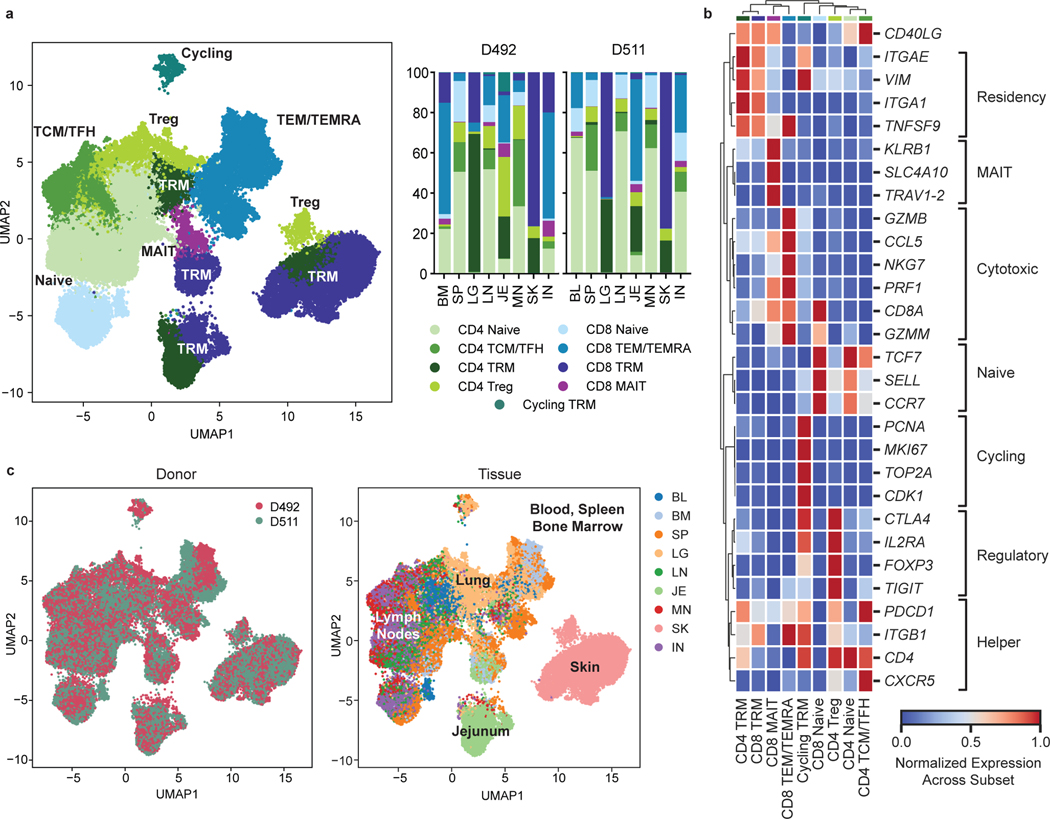
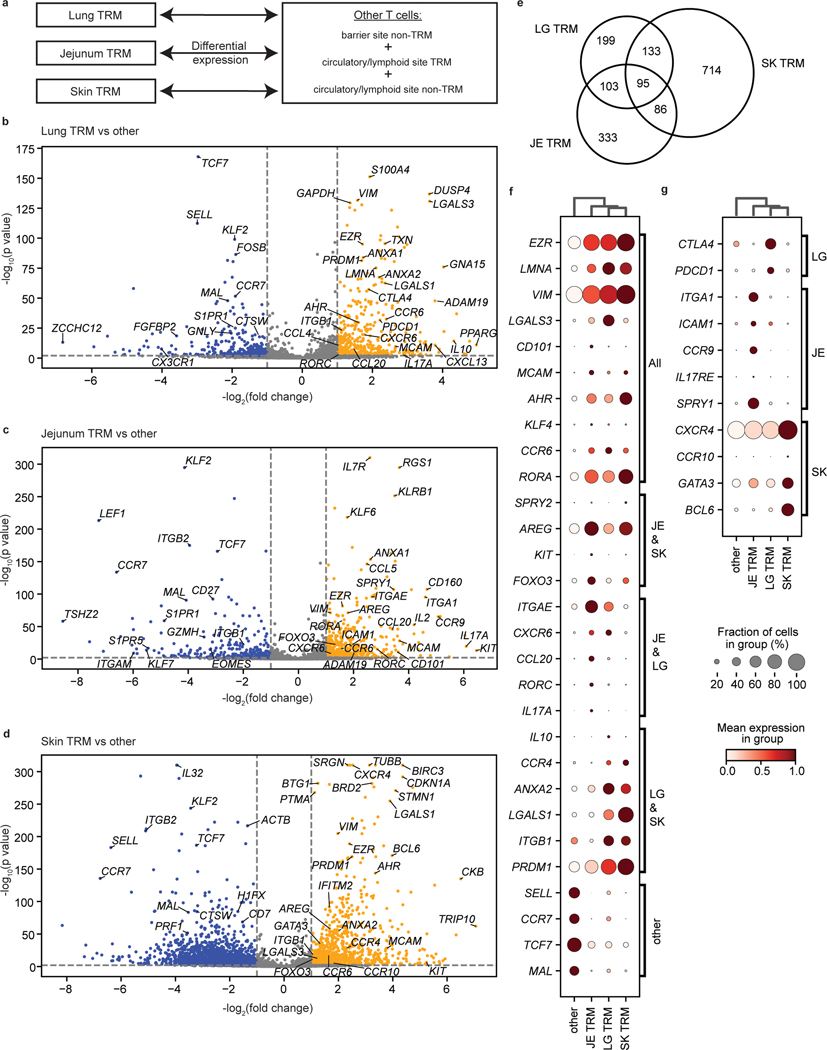
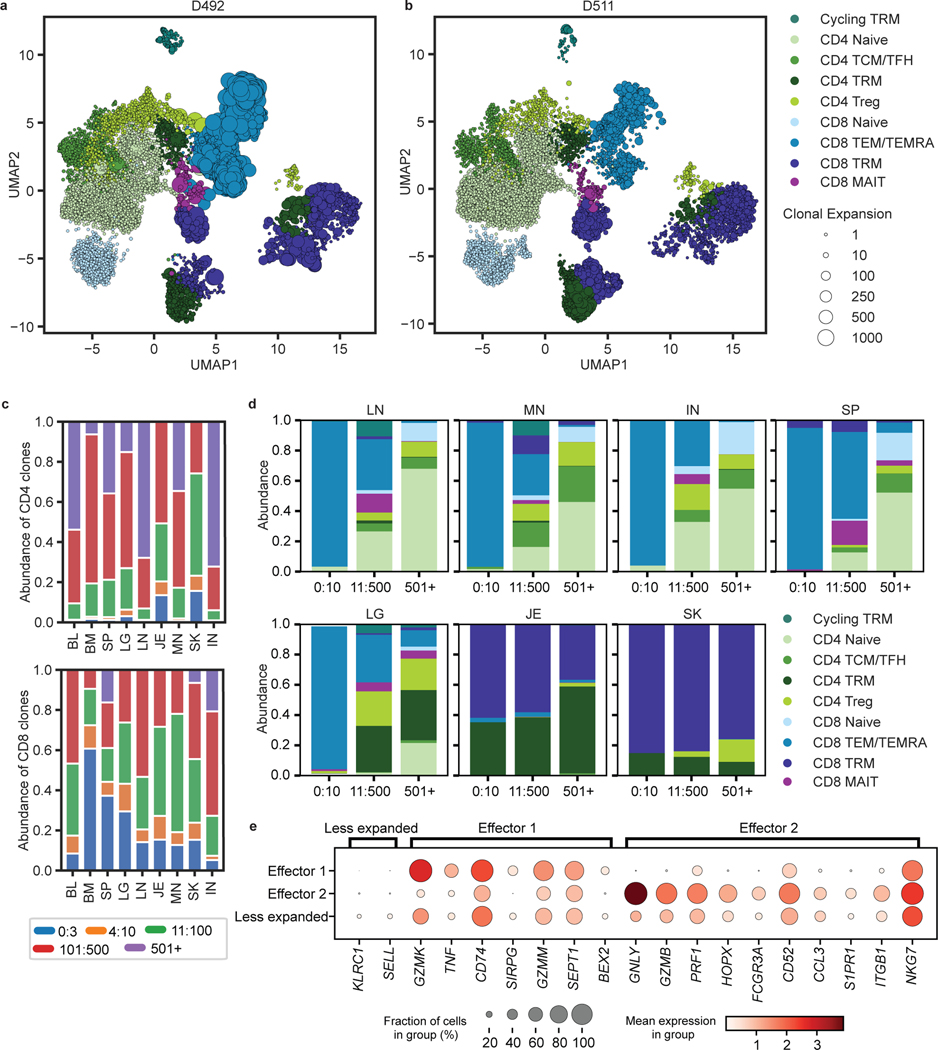
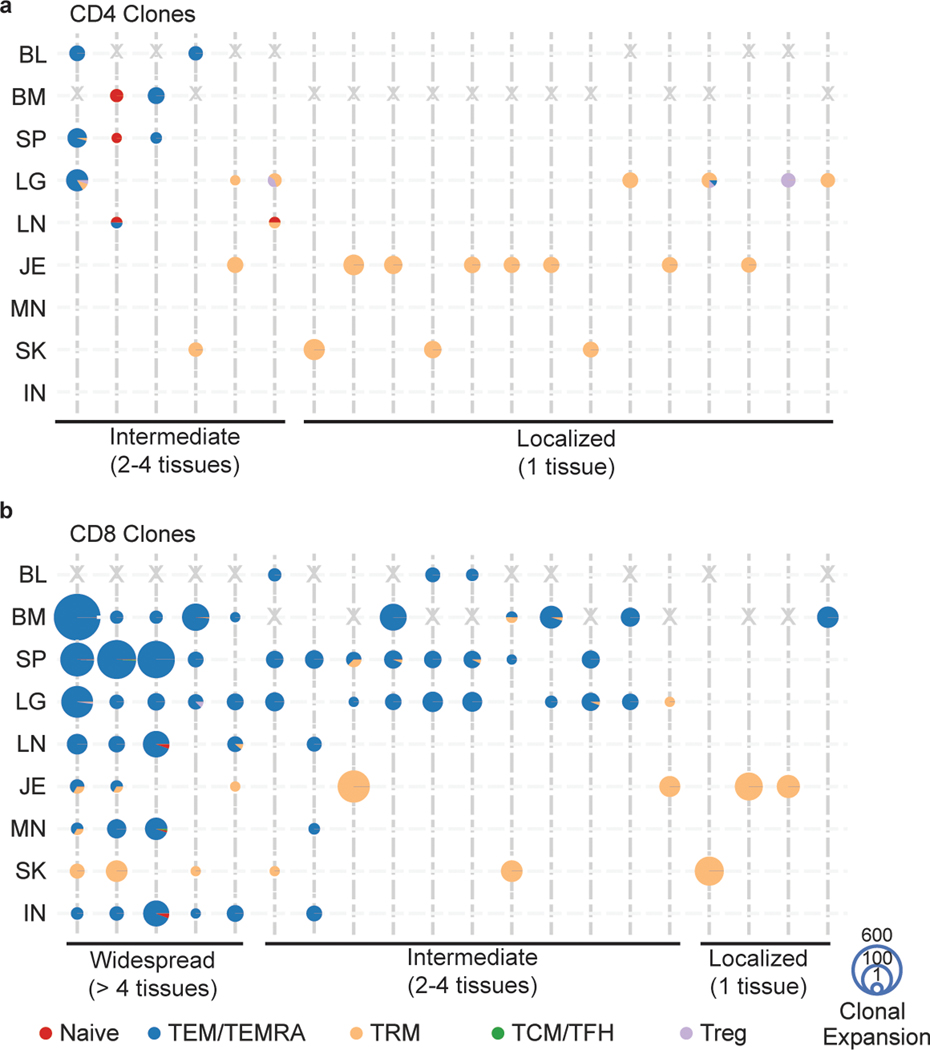
T lymphocytes migrate to barrier sites after exposure to pathogens, providing localized immunity and long-term protection. Here, we obtained blood and tissues from human organ donors to examine T cells across major barrier sites (skin, lung, jejunum), associated lymph nodes, lymphoid organs (spleen, bone marrow), and in circulation. By integrating single-cell protein and transcriptome profiling, we demonstrate that human barrier sites contain tissue-resident memory T (TRM) cells that exhibit site-adapted profiles for residency, homing and function distinct from circulating memory T cells. Incorporating T cell receptor and transcriptome analysis, we show that circulating memory T cells are highly expanded, display extensive overlap between sites and exhibit effector and cytolytic functional profiles, while TRM clones exhibit site-specific expansions and distinct functional capacities. Together, our findings indicate that circulating T cells are more disseminated and differentiated, while TRM cells exhibit tissue-specific adaptation and clonal segregation, suggesting that strategies to promote barrier immunity require tissue targeting.


Figures

Extended Data Fig. 1
Extended Data Fig. 1. T cell subsets across sites as measured by CyTOF
(a) Scaled marker expression by T cells across sites as measured by CyTOF. Expression of the indicated surface and intracellular markers, as measured by CyTOF, used for unsupervised hierarchical clustering of T cells across tissue sites in Figure 1. Color intensity of individual cells denotes scaled expression of the indicated marker. (b) CyTOF analysis of T cells in circulation and in lymphoid and barrier sites shown in a t-SNE plot as in Fig. 1a stratified by individual donors. Arrows indicate clusters that differ between the younger and older donors. TEM, effector memory T cell; TEMRA, terminally-differentiated effector memory T cell.
Extended Data Fig. 2
Extended Data Fig. 2. T cell subset distribution across tissues and between donors.
Heatmaps illustrating frequency of CD4+ (a) and CD8+ (b) T cell subsets present in each tissue site for all three donors combined and for each individual donor. Color intensity of each cell is based on column z-score values. M, male; F, female; TFH, follicular helper T cell; TRM, tissue-resident memory T cell; gdT, gamma-delta T cell; Treg, regulatory T cell; TCM, central memory T cell; TEMRA, terminally-differentiated effector memory T cell; TEM, effector memory T cell; Th1, type-1 helper T cell; BL, blood; IN, inguinal lymph node; JE, jejunum; LG, lung; LN, lung lymph node; MN, mesenteric lymph node; SK, skin; SP, spleen.
Extended Data Fig. 3
Extended Data Fig. 3. TRBV and TRBJ gene usage of CD4+ and CD8+ T cell clones across multiple tissue sites and donors.
Heat maps show TRBV usage by site and donor for CD4+ T cells (a) and CD8+ T cells (b) and TRBJ usage by site and donor for CD4+ T cells (c) and CD8+ T cells (d). Donor and tissue are indicated by color bars above each heatmap. Color intensity of each cell is based on column z-score and indicated by the color key accompanying each heatmap. Each unique clone is counted once per donor.
Extended Data Fig. 4
Extended Data Fig. 4. Clonal expansion of CD4+ and CD8+ T cells across sites.
Combined frequency of top 100 clones among CD4+ and CD8+ T cells from nine tissue sites. The height of each bar represents mean frequencies averaged across four donors. Statistical significance was calculated using two-way ANOVA matching tissue and CD4+/CD8+ subset and comparing each subset with the other subset in that tissue, followed by Tukey’s multiple comparisons test and indicated by ****, p ≤ 0.0001; ***, p ≤ 0.001; *, p ≤ 0.05. Error bars represent standard deviation. (n=4 independent human donors from each site). For raw data and individual p-values, see source data.
Extended Data Fig. 5
Extended Data Fig. 5. Clone tracking plots for individual donors.
Clone tracking plots illustrating overlap of top 20 clones within tissues or tissue grouping across nine tissue sites from donors D461 (top), D466 (bottom left), and D492 (bottom right), as presented in Figure 2. Height of each bar indicates fraction of the top 20 clones within each tissue site. Each color represents a unique clone tracked across all tissue sites.
Extended Data Fig. 6
Extended Data Fig. 6. Scaled gene expression by T cells as measured by scRNA-seq.
UMAP embeddings as in Fig. 3 colored by Leiden clusters (top left), expression of selected gene markers as indicated which were used in annotation of clusters (Rows 1–7), and by MAIT evidence (bottom right plot). Color intensity on the gene expression plots is based on scaled log (normalized count per ten thousand (CP10k)+1) for each marker. MAIT evidence indicates whether scTCR-Seq revealed TRA gene usage, TRB gene usage, CDR3 sequence (junction) aligned to a database of known MAIT clones, a combination of these factors, or none (No MAIT evidence) (see Methods). Events lacking paired scTCR data are not plotted.
Extended Data Fig. 7
Extended Data Fig. 7. Expression of top shared and unique genes in barrier site-specific signatures.
(a, b) Heatmaps depicting top 10–25 and selected differentially expressed protein coding genes (p-value < 0.05, log-fold change > 2) in barrier TRM cells versus nonresident T cells across all tissues of both donors. Statistical significance was calculated using a two-sided Wilcoxon with tie correction, followed by a Benjamini-Hochberg adjustment for multiple comparisons. Genes are grouped by their differential expression being unique to (a) or shared between (b) barrier sites. Intensity represents column-normalized log (normalized count per ten thousand (CP10k)+1). Cells are grouped by their tissue site of origin and cell type: CD4 TRM, CD8 TRM, Cycling TRM, or other (including both all cells from non-barrier sites and non-TRM from barrier sites). TRM, tissue-resident memory T cell; BL, blood; BM, bone marrow; IN, inguinal lymph node; JE, jejunum; LG, lung; LN, lung lymph node; MN, mesenteric lymph node; SK, skin; SP, spleen.
Extended Data Fig. 8
Extended Data Fig. 8. Transcriptional heterogeneity of skin TRM.
(a) UMAP embedding of skin TRM colored by Leiden cluster (top left), or gene expression. Color intensity of individual cells is based on scaled log (normalized count per ten thousand (CP10k)+1) of the indicated markers. (b) Heatmap depicting average expression of genes associated with T cell function upregulated (p-value < 0.05, log-fold change > 0.3) in each Leiden cluster. Intensity represents the mean column-normalized expression for the indicated gene. Statistical significance was calculated using a two-sided Wilcoxon with tie correction, followed by a Benjamini-Hochberg adjustment for multiple comparisons. (c) UMAP embeddings of skin TRM colored by expression of differentially expressed genes, as in (a).
Extended Data Fig. 9
Extended Data Fig. 9. Effector function of expanded vs. unexpanded TEM/TEMRA clones.
(a) Table of expanded TEM/TEMRA clonotypes (>45 clonal cells) with their donor of origin, CDR3 nucleotide sequence for TRA and TRB, clonal expansion, and grouped effector function. (b, c) Dot plots depicting the differential expression of key markers by less expanded vs. expanded TEM/TEMRA cells from D492 (b) and D511 (c), grouped by effector function signatures “Effector 1” and “Effector 2”. The fraction of cells comprising expanded unique clones and collective less expanded clones that expressed any amount of the marker is displayed as dot size, and increased color intensity of the dots indicates higher mean expression level across cells from these groups. For each donor, expanded (>45 clones) TEM/TEMRA populations of the same clone are labeled uniquely, while less expanded (< 5 clones) TEM/TEMRA clones are grouped together.
Extended Data Fig. 10
Extended Data Fig. 10. Clonal connections across tissues and subsets determined by normalizing cell numbers across sites.
To control for cell number differences across tissues for each donor, we picked a random selection of 150 CD4+ and CD8+ T cells for each sample and mapped the clonal connections across tissues and subsets as in Fig. 6 on the top 20 clones. a, b, Tissue distribution, T cell subset, and clonal expansion of CD4+ (a) and CD8+ (b) clones. CD4+ and CD8+ clones were defined by expression of CD4 or CD8A within cells sharing the same clone. Individual clones are represented across vertical lines, and pie charts are used to show the subset makeup of T cells that share that clonotype within each tissue. Size of each pie chart depicts the clonal expansion of each clone within that tissue site. The clones are grouped by their tissue distribution patterns (widespread, intermediate, or localized). Gray X’s mark the spaces where tissues were not sampled for one donor, or samples below the subset threshold (CD8+ MN in one donor only). TEM, effector memory T cell; TEMRA, terminally-differentiated effector memory T cell; TRM, tissue-resident memory T cell; TCM, central memory T cell; TFH, follicular helper T cell; Treg, regulatory T cell; BL, blood; BM, bone marrow; IN, inguinal lymph node; JE, jejunum; LG, lung; LN, lung lymph node; MN, mesenteric lymph node; SK, skin; SP, spleen.
Figure 1:
Figure 1:. Site-specific T cell subset distribution in human barrier and lymphoid tissues.
T cells were isolated from blood, spleen, lung lymph node (LN), inguinal lymph node (IN), mesenteric lymph node (MN), lung, skin, and jejunum from three donors, stained with a 37-marker panel (Supplementary Table 2) and analyzed by cytometry by time-of-flight (CyTOF). a, The full complement of CD4+ and CD8+ T cell subsets from blood and 7 tissue sites of three donors, as defined by marker expression (see Extended Data Fig. 1), represented in a t-distributed stochastic neighbor embedding (t-SNE) plot. Cluster numbers correspond to T cell subsets defined in (b). b, Marker expression by CD4+ (top, green) and CD8+ (bottom, blue) T cell clusters in (a) defined by unsupervised clustering. The color intensity of each cell denotes the column-normalized mean scaled expression of each indicated marker within each cluster. c, Stacked bar chart of the proportion of T cell subsets in each site for each of the three donors. d, Composition of T cell subsets stratified by site compiled from three donors, represented as t-SNE plots. Prominent T cell subsets are highlighted by a dashed ellipse for each site. TFH, follicular helper T cell; TRM, tissue-resident memory T cell; gdT, gamma-delta T cell; Treg, regulatory T cell; TCM, central memory T cell; TEMRA, terminally-differentiated effector memory T cell; TEM, effector memory T cell; Th1, type-1 helper T cell; BL, blood; IN, inguinal lymph node; JE, jejunum; LG, lung; LN, lung lymph node; MN, mesenteric lymph node; SK, skin; SP, spleen.
Figure 2:
Figure 2:. Distinct clonal connections define T cells in barrier sites.
CD4+ and CD8+ T cells were isolated from nine tissue sites four individual donors (D461, D466, D479, D492) for TCRB sequencing. a, Pie charts showing relative clonal abundance for CD4+ (left) and CD8+ (right) T cells from each sample showing the proportion of the repertoire occupied by the top 10, 100, 1000, or 1000+ clones. b, Combined frequency of top 100 clones among CD4+ (left, green) and CD8+ (right, blue) T cells. Bar height represents frequencies averaged across four donors. Statistical significance was calculated using two-way ANOVA matching tissue and CD4+/CD8+ subset and comparing tissues within each subset, followed by Tukey’s multiple comparisons test, and indicated by ****, p ≤ 0.0001; ***, p ≤ 0.001; **, p ≤ 0.01; *, p ≤ 0.05. Error bars represent standard deviation (n=4 independent human donors for each tissue-site). For raw data and individual p-values, see source data. c, Morisita overlap index between pairwise cell populations of CD4+ (left) or CD8+ (right) T cells. Color intensity is based on Morisita overlap index. d, Clone tracking plots illustrating overlap of top 20 clones across sites for representative donor D479. Bar height indicates the fraction of the repertoire occupied by the top 20 clones within each tissue site. Each color represents a unique clone. e, Network representation of CD4+ (left) and CD8+ (right) T cell clones in blood, lymphoid, and barrier sites across the body. The diameter of each circle is proportional to the average frequency of the top 100 clones in that tissue; line thickness is proportional to the Morisita overlap index between populations within the two connecting tissue sites; and specific networks of overlap for groups of tissues are indicated by color. BL, blood; BM, bone marrow; IN, inguinal lymph node; JE, jejunum; LG, lung; LN, lung lymph node; MN, mesenteric lymph node; SK, skin; SP, spleen.
Figure 3:
Figure 3:. Single-cell transcriptome profiling reveals subset and tissue-specific signatures for T cells.
Total (CD3+) T cells were isolated from 9 sites of two donors for 5’single cell RNA sequencing (scRNA-seq, see Methods). a, UMAP embedding of scRNA-seq data based on highly variable genes and integrated across donor, colored by T cell subset (left). The proportion of T cell subsets in each tissue for each donor is depicted in a stacked bar chart (right). b, Clustered heatmap displaying normalized log-transformed expression of selected markers that were used to inform cluster and subset annotation. Marker genes are annotated by functional groups. c, UMAP embedding as in (a) colored by donor (left) or tissue (right) of origin. TCM, central memory T cell; TFH, follicular helper T cell; TRM, tissue-resident memory T cell; Treg, regulatory T cell; TEM, effector memory T cell; TEMRA, terminally-differentiated effector memory T cell; MAIT, mucosal-associated invariant T cell; BL, blood; IN, inguinal lymph node; JE, jejunum; LG, lung; LN, lung lymph node; MN, mesenteric lymph node; SK, skin; SP, spleen.
Figure 4:
Figure 4:. TRM in barrier sites exhibit site-specific gene signatures.
a, Schematic depicting differential expression between barrier site TRM and other T cells. b-d, Volcano plots showing the differential expression of TRM in the indicated barrier site compared to nonresident T cells in all sites and TRM in non-barrier sites. Genes enriched in lung (b), jejunum (c), and skin (d) TRM are shown. Significantly upregulated genes (p < 0.05, lfc > 1) are depicted in yellow, and significantly downregulated genes (p < 0.05, lfc < −1) are depicted in blue. Selected genes of interest were annotated. e, Venn diagram showing the overlap of significantly upregulated genes (p < 0.05, lfc > 1) between jejunum, skin, and lung TRM. f, g, Differential expression of key markers of tissue residency and genes shared between sites (f) or specific to single barrier sites (g). The fraction of cells within the group that expressed any amount of the marker is displayed as dot size, and increased color intensity of the dots indicates higher row-normalized mean expression level across cells from these groups. Cells are grouped as belonging to skin-, jejunum-, or lung-TRM, or other (representing nonresident T cells in all sites and TRM in non-barrier sites). JE, jejunum; LG, lung; SK, skin. Statistical significance was calculated using a two-sided Wilcoxon with tie correction, followed by a Benjamini-Hochberg adjustment for multiple comparisons.
Figure 5:
Figure 5:. Differential clonal expansion associated with T cell subset, tissue, and functional capacity.
a, b, UMAP embedding of scRNA-seq of T cells successfully mapped to TCR clone information, colored by subset, for donor D492 (a) and D511 (b). Clonal expansion, defined by shared CDR3 nucleotide sequence, V and J gene usage, is depicted by marker size. c, Clonal abundance of the top 3, 10, 100, and 500 clones within the CD4+ (top) and CD8+ (bottom) clusters in each tissue site. d, Subset composition of the top 10, 500, and 500+ clones in the indicated tissue sites averaged across both donors. e, Differential expression of key markers by unexpanded vs. expanded TEM/TEMRA cells in both donors shown as a dot plot, grouped by effector function signatures. The fraction of cells within the group that expressed any amount of the marker is displayed as dot size, and increased color intensity of the dots indicates higher mean expression level across cells from these groups. Cells are grouped as belonging to expanded (>45 clones) TEM/TEMRAs displaying distinct effector function labeled “Effector 1” and “Effector 2”, and less expanded (< 5 clones) TEM/TEMRA. BL, blood; BM, bone marrow; IN, inguinal lymph node; JE, jejunum; LG, lung; LN, lung lymph node; MN, mesenteric lymph node; SK, skin; SP, spleen.
Figure 6:
Figure 6:. TEM/TEMRA clones are disseminated while TRM clones exhibit localized expansions.
a, b, Tissue distribution, T cell subset, and clonal expansion of CD4+ (a) and CD8+ (b) clones. CD4+ and CD8+ clones were defined by expression of CD4 or CD8A within cells sharing the same clone. Individual clones are represented across vertical lines, and pie charts are used to show the subset makeup of T cells that share that clonotype within each tissue. Size of each pie chart depicts the clonal expansion of each clone within that tissue site. The top 20 highly expanded CD4+ and CD8+ clones for both donors were selected, and grouped by their tissue distribution (widespread, intermediate, or localized). Gray X’s mark the spaces where tissues were not sampled for one donor. BL, blood; BM, bone marrow; IN, inguinal lymph node; JE, jejunum; LG, lung; LN, lung lymph node; MN, mesenteric lymph node; SK, skin; SP, spleen.

Comment in

References

    1. Masopust D. & Soerens AG Tissue-Resident T Cells and Other Resident Leukocytes. Annu Rev Immunol 37, 521–546 (2019). - PMC - PubMed
    1. Szabo PA, Miron M. & Farber DL Location, location, location: Tissue resident memory T cells in mice and humans. Sci Immunol 4, eaas9673. (2019). - PMC - PubMed
    1. Paik DH & Farber DL Influenza infection fortifies local lymph nodes to promote lung-resident heterosubtypic immunity. J Exp Med 218, e20200218 (2021). - PMC - PubMed
    1. Beura LK, Mitchell JS, Thompson EA, Schenkel JM, Mohammed J, Wijeyesinghe S, Fonseca R, Burbach BJ, Hickman HD, Vezys V, Fife BT & Masopust D. Intravital mucosal imaging of CD8(+) resident memory T cells shows tissue-autonomous recall responses that amplify secondary memory. Nat Immunol 19, 173–182 (2018). - PMC - PubMed
    1. Park SL, Zaid A, Hor JL, Christo SN, Prier JE, Davies B, Alexandre YO, Gregory JL, Russell TA, Gebhardt T, Carbone FR, Tscharke DC, Heath WR, Mueller SN & Mackay LK Local proliferation maintains a stable pool of tissue-resident memory T cells after antiviral recall responses. Nat Immunol 19, 183–191 (2018). - PubMed

METHODS-ONLY REFERENCES

    1. Senda T, Dogra P, Granot T, Furuhashi K, Snyder ME, Carpenter DJ, Szabo PA, Thapa P, Miron M. & Farber DL Microanatomical dissection of human intestinal T-cell immunity reveals site-specific changes in gut-associated lymphoid tissues over life. Mucosal Immunol 12, 378–389 (2019). - PMC - PubMed
    1. Wells SB, Szabo PA & Lam N. Isolation of nucleated cells from bone marrow aspirate. protocols.io (2021). 10.17504/protocols.io.bwrupd6w - DOI
    1. Wells SB & Szabo PA Preparation of single cell suspension from human spleen tissue. protocols.io (2021). 10.17504/protocols.io.bwq4pdyw - DOI
    1. Wells SB, Szabo PA, Ural B. & Poon MML Preparation of Single Cell Suspension from Human Lung Tissue. protocols.io (2021). 10.17504/protocols.io.bwr9pd96 - DOI
    1. Wells SB, Szabo PA, Lam N. & Poon MML Preparation of Single Cell Suspension from Human Lymph Node Tissue. protocols.io (2021). 10.17504/protocols.io.bwsapeae - DOI

Publication types