. 2023 Mar;24(3):531-544.
doi: 10.1038/s41590-022-01413-w. Epub 2023 Jan 19.

An epithelial cell-derived metabolite tunes immunoglobulin A secretion by gut-resident plasma cells

Affiliations

An epithelial cell-derived metabolite tunes immunoglobulin A secretion by gut-resident plasma cells

Simona Ceglia et al. Nat Immunol. 2023 Mar.

Abstract

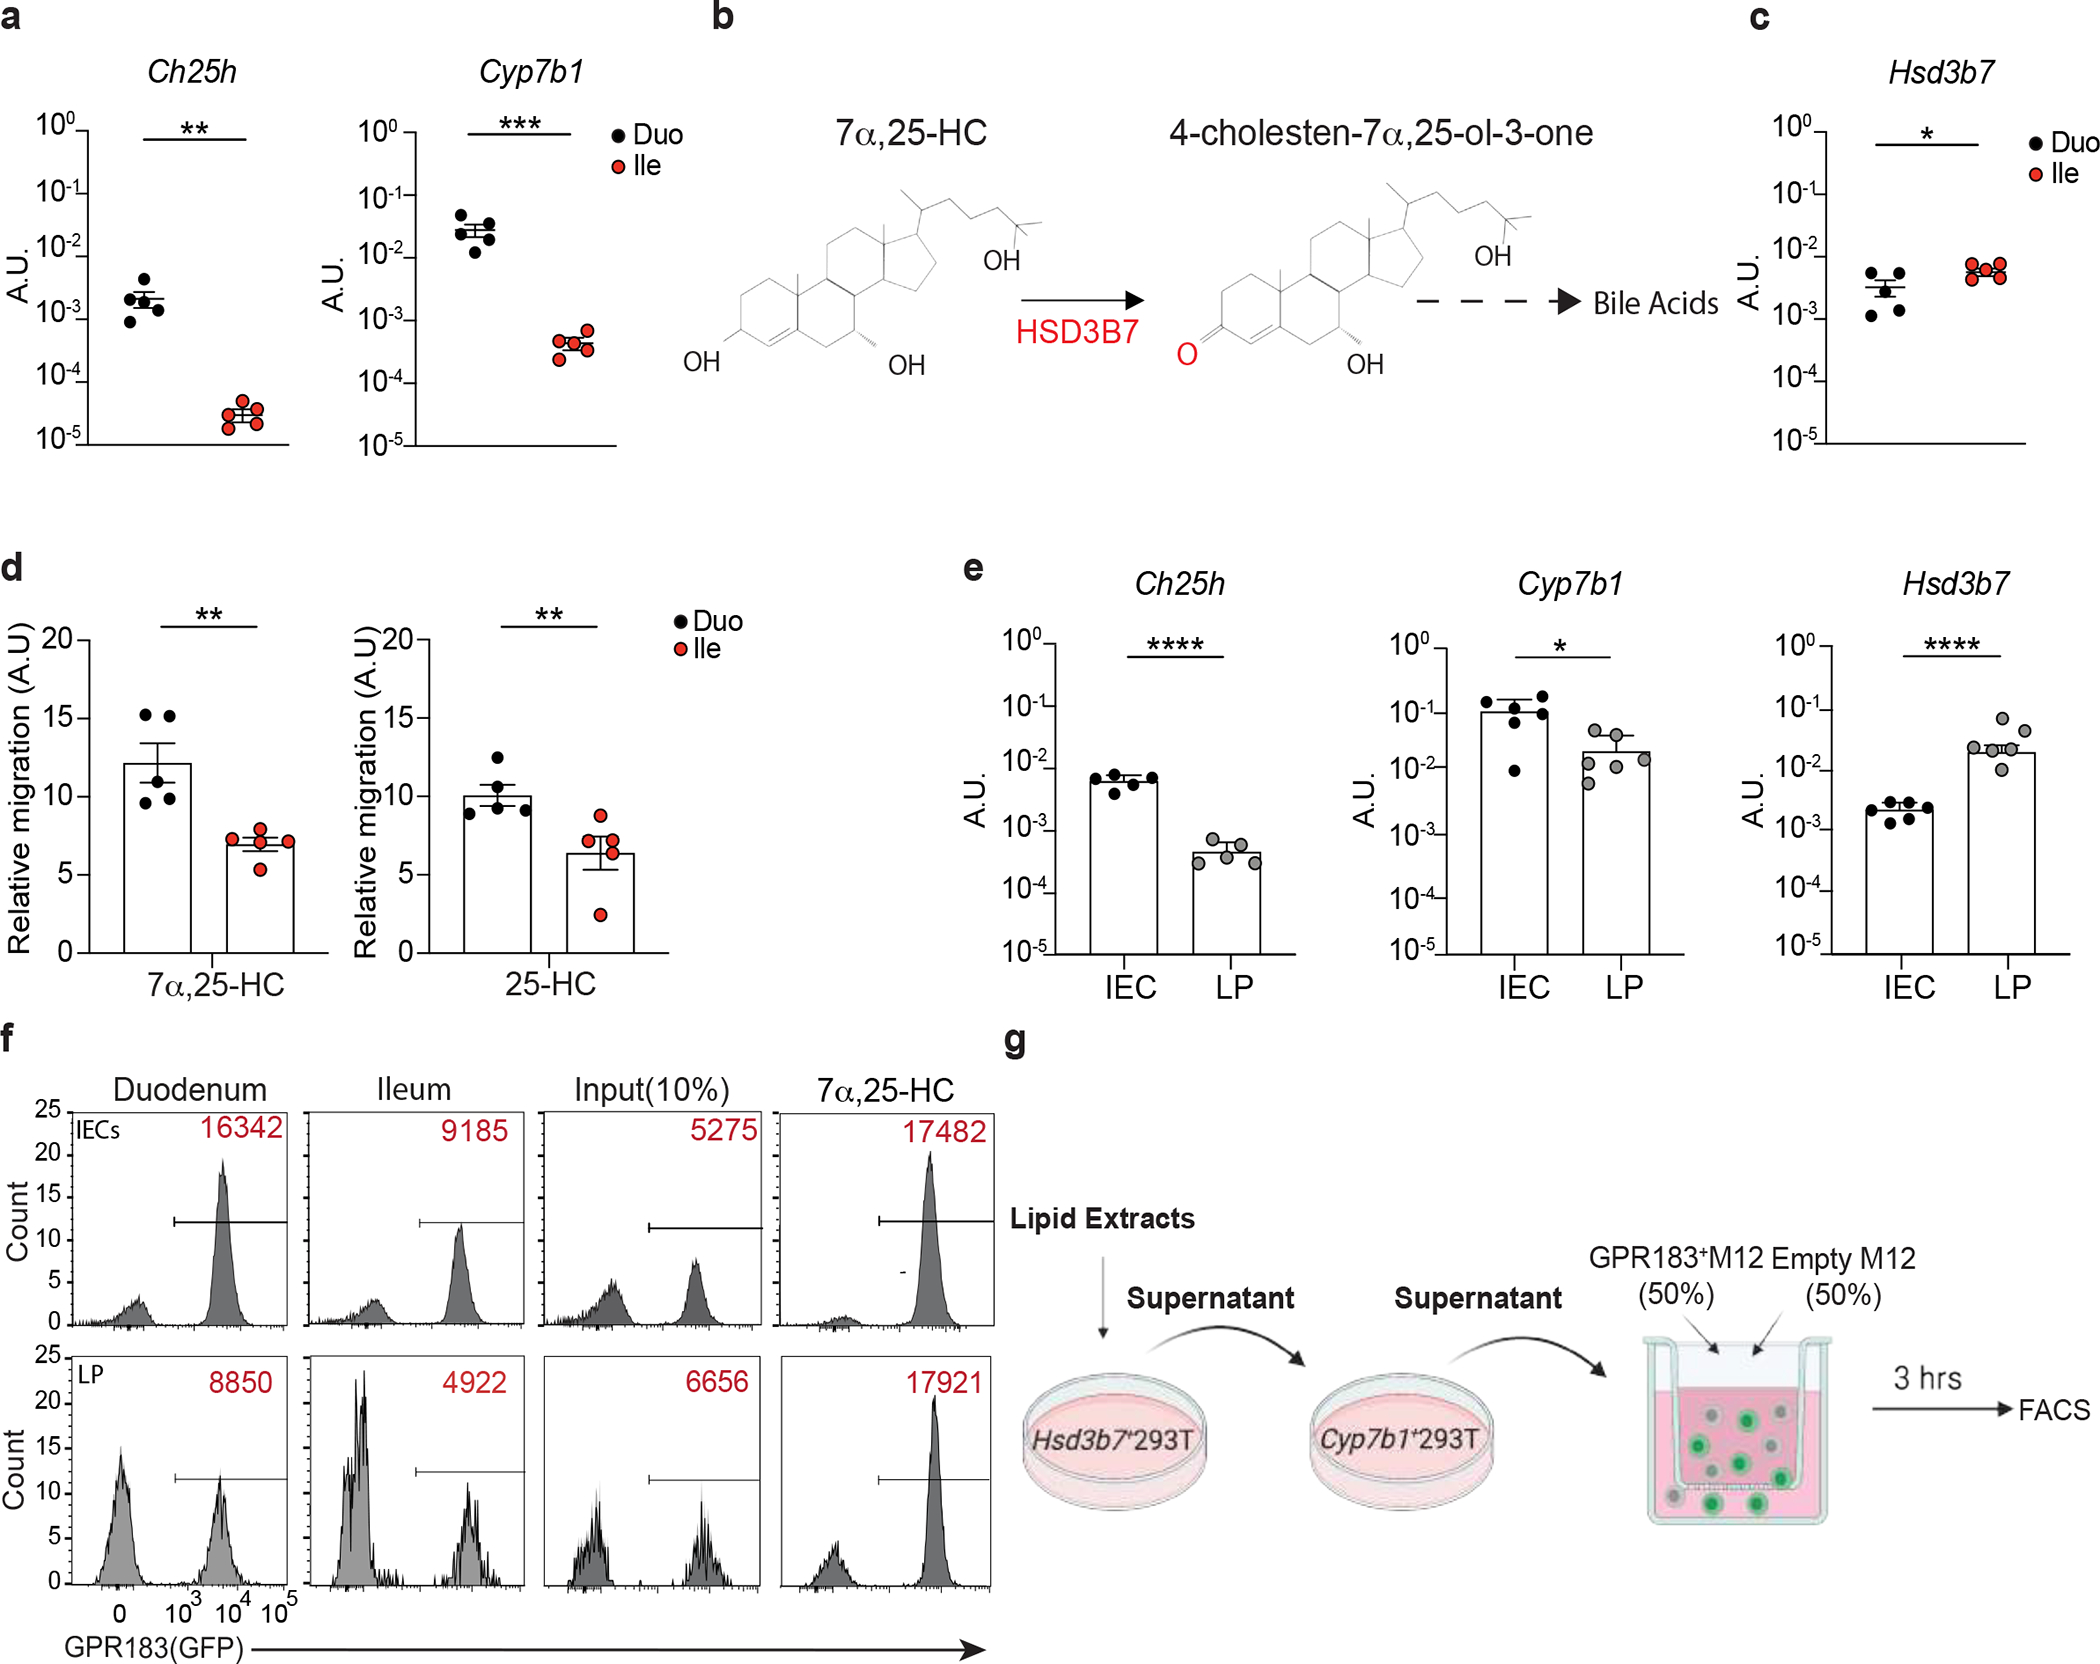
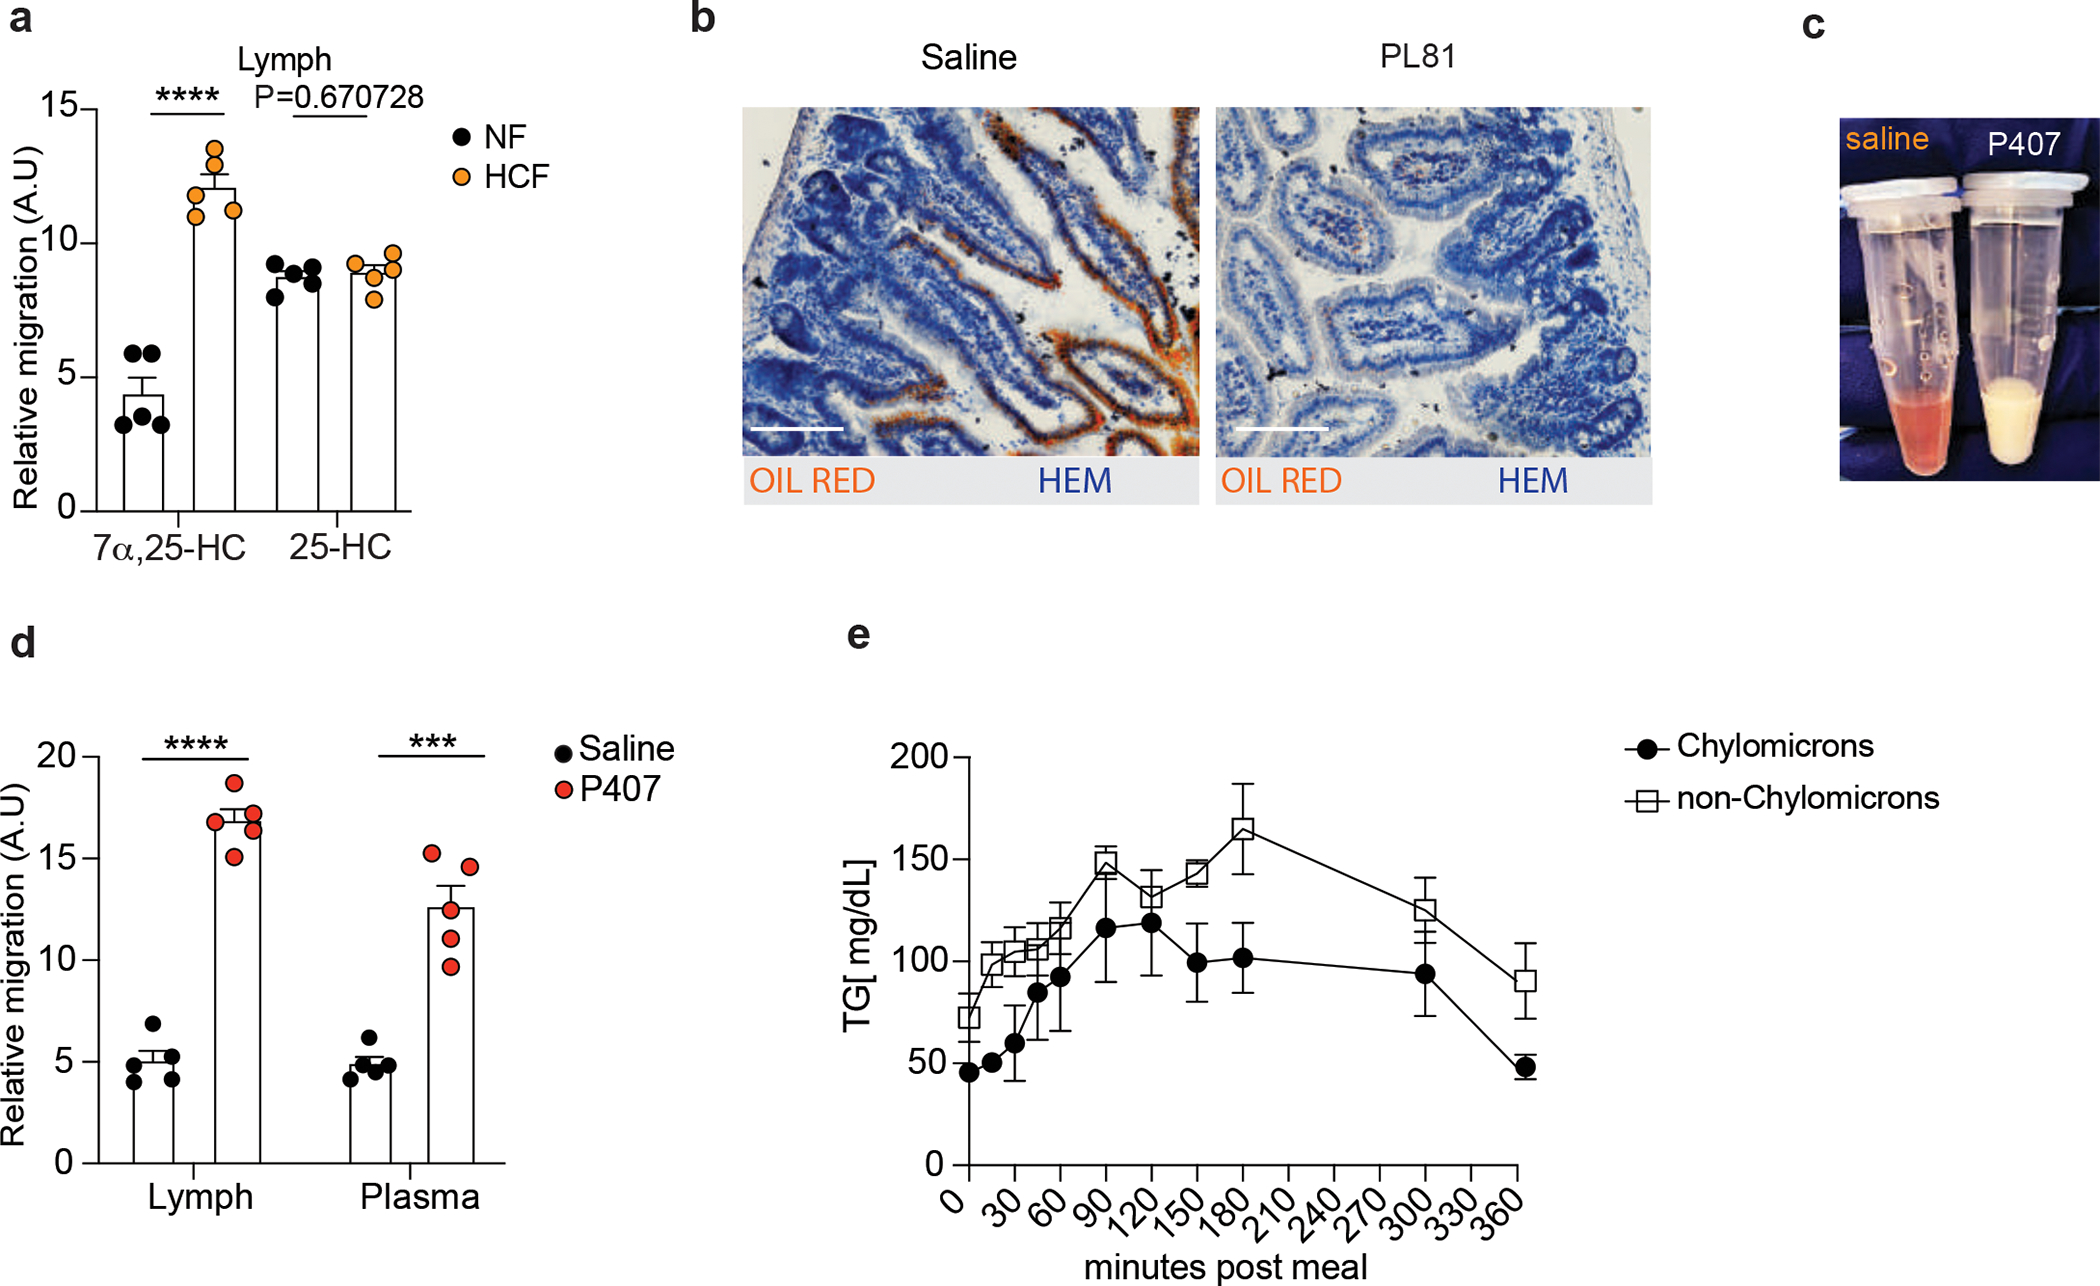
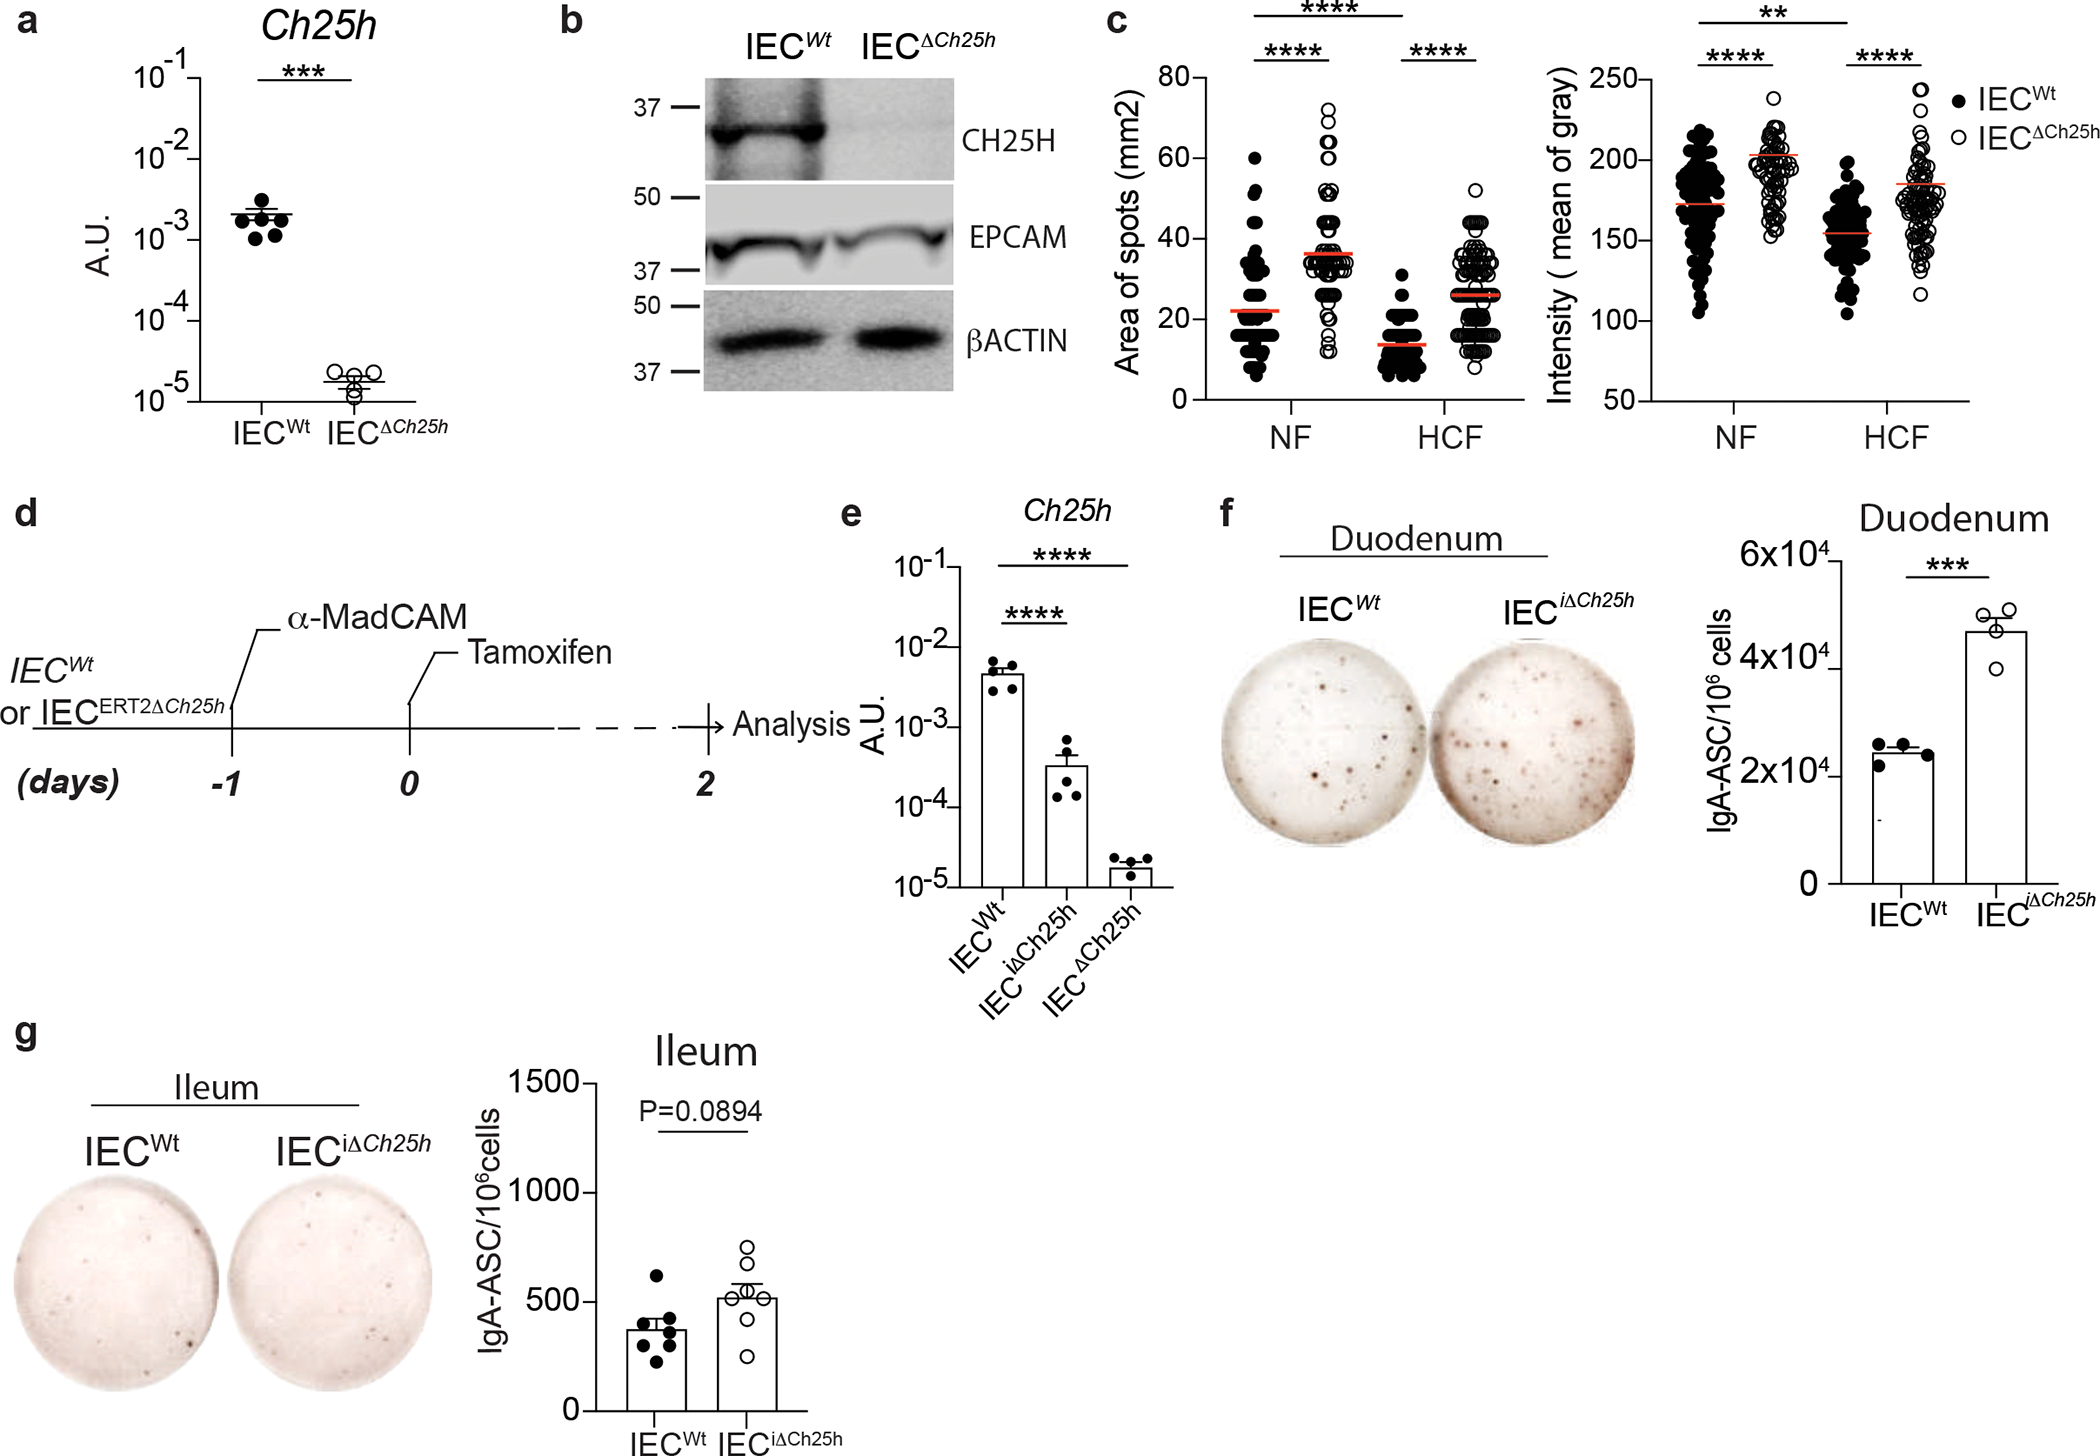
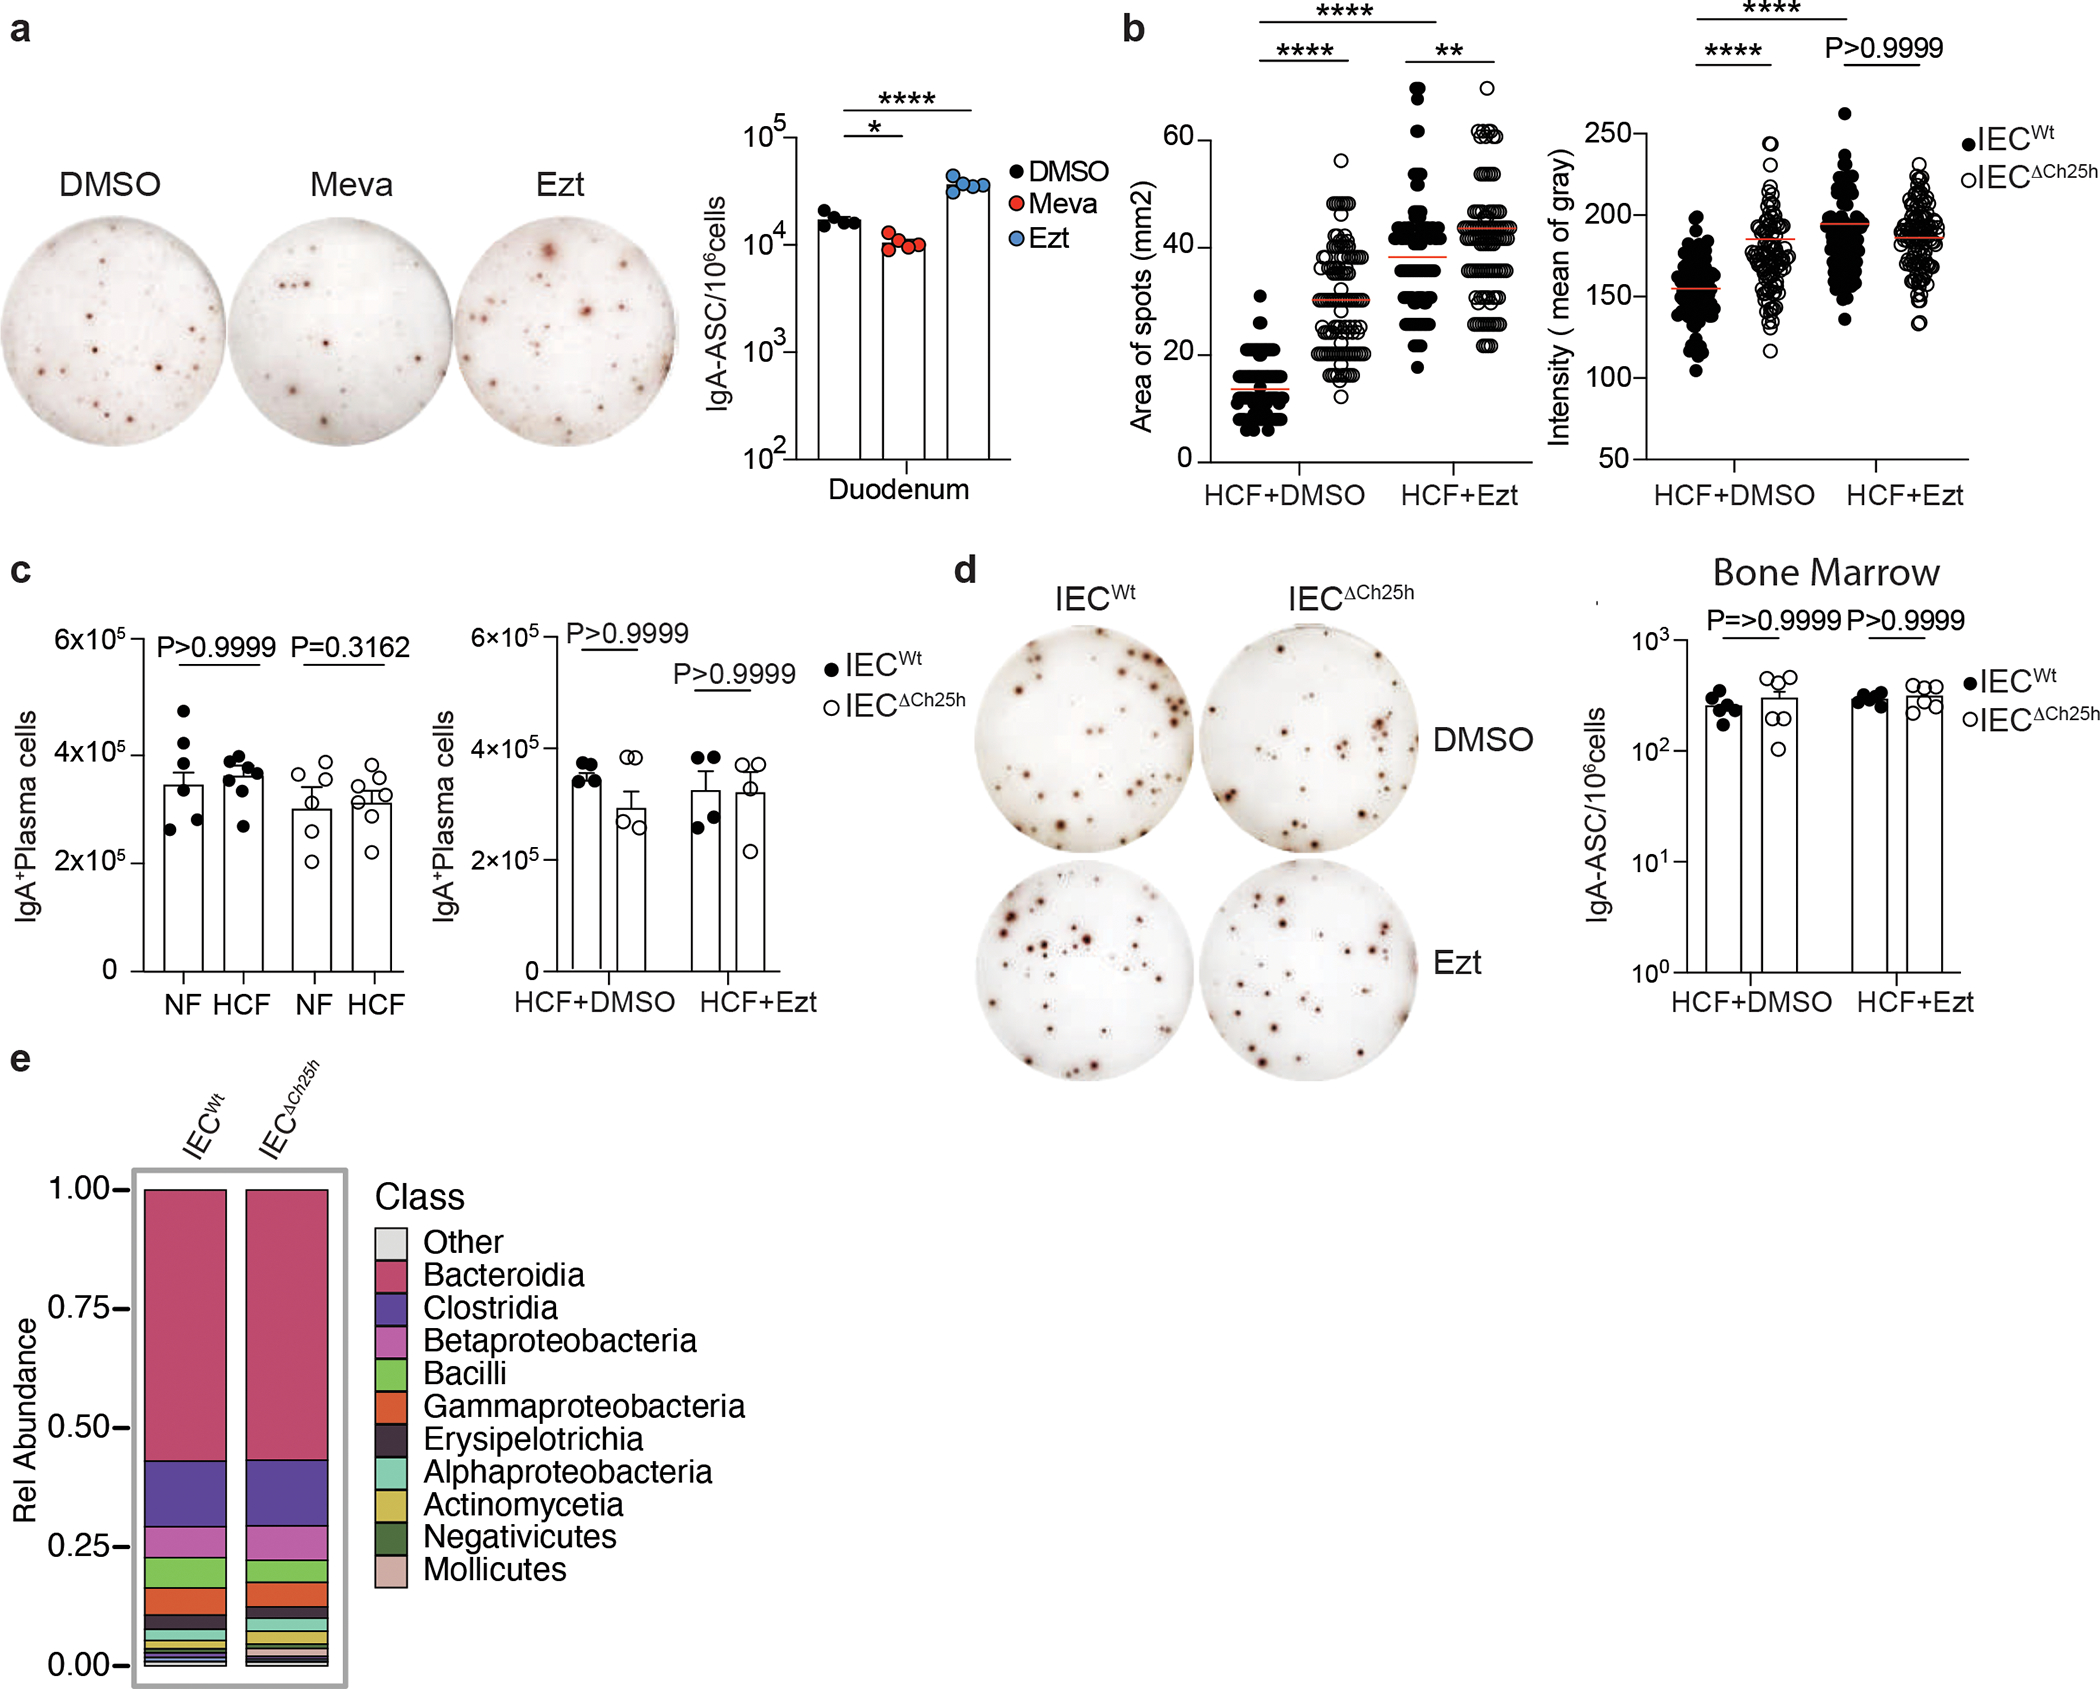
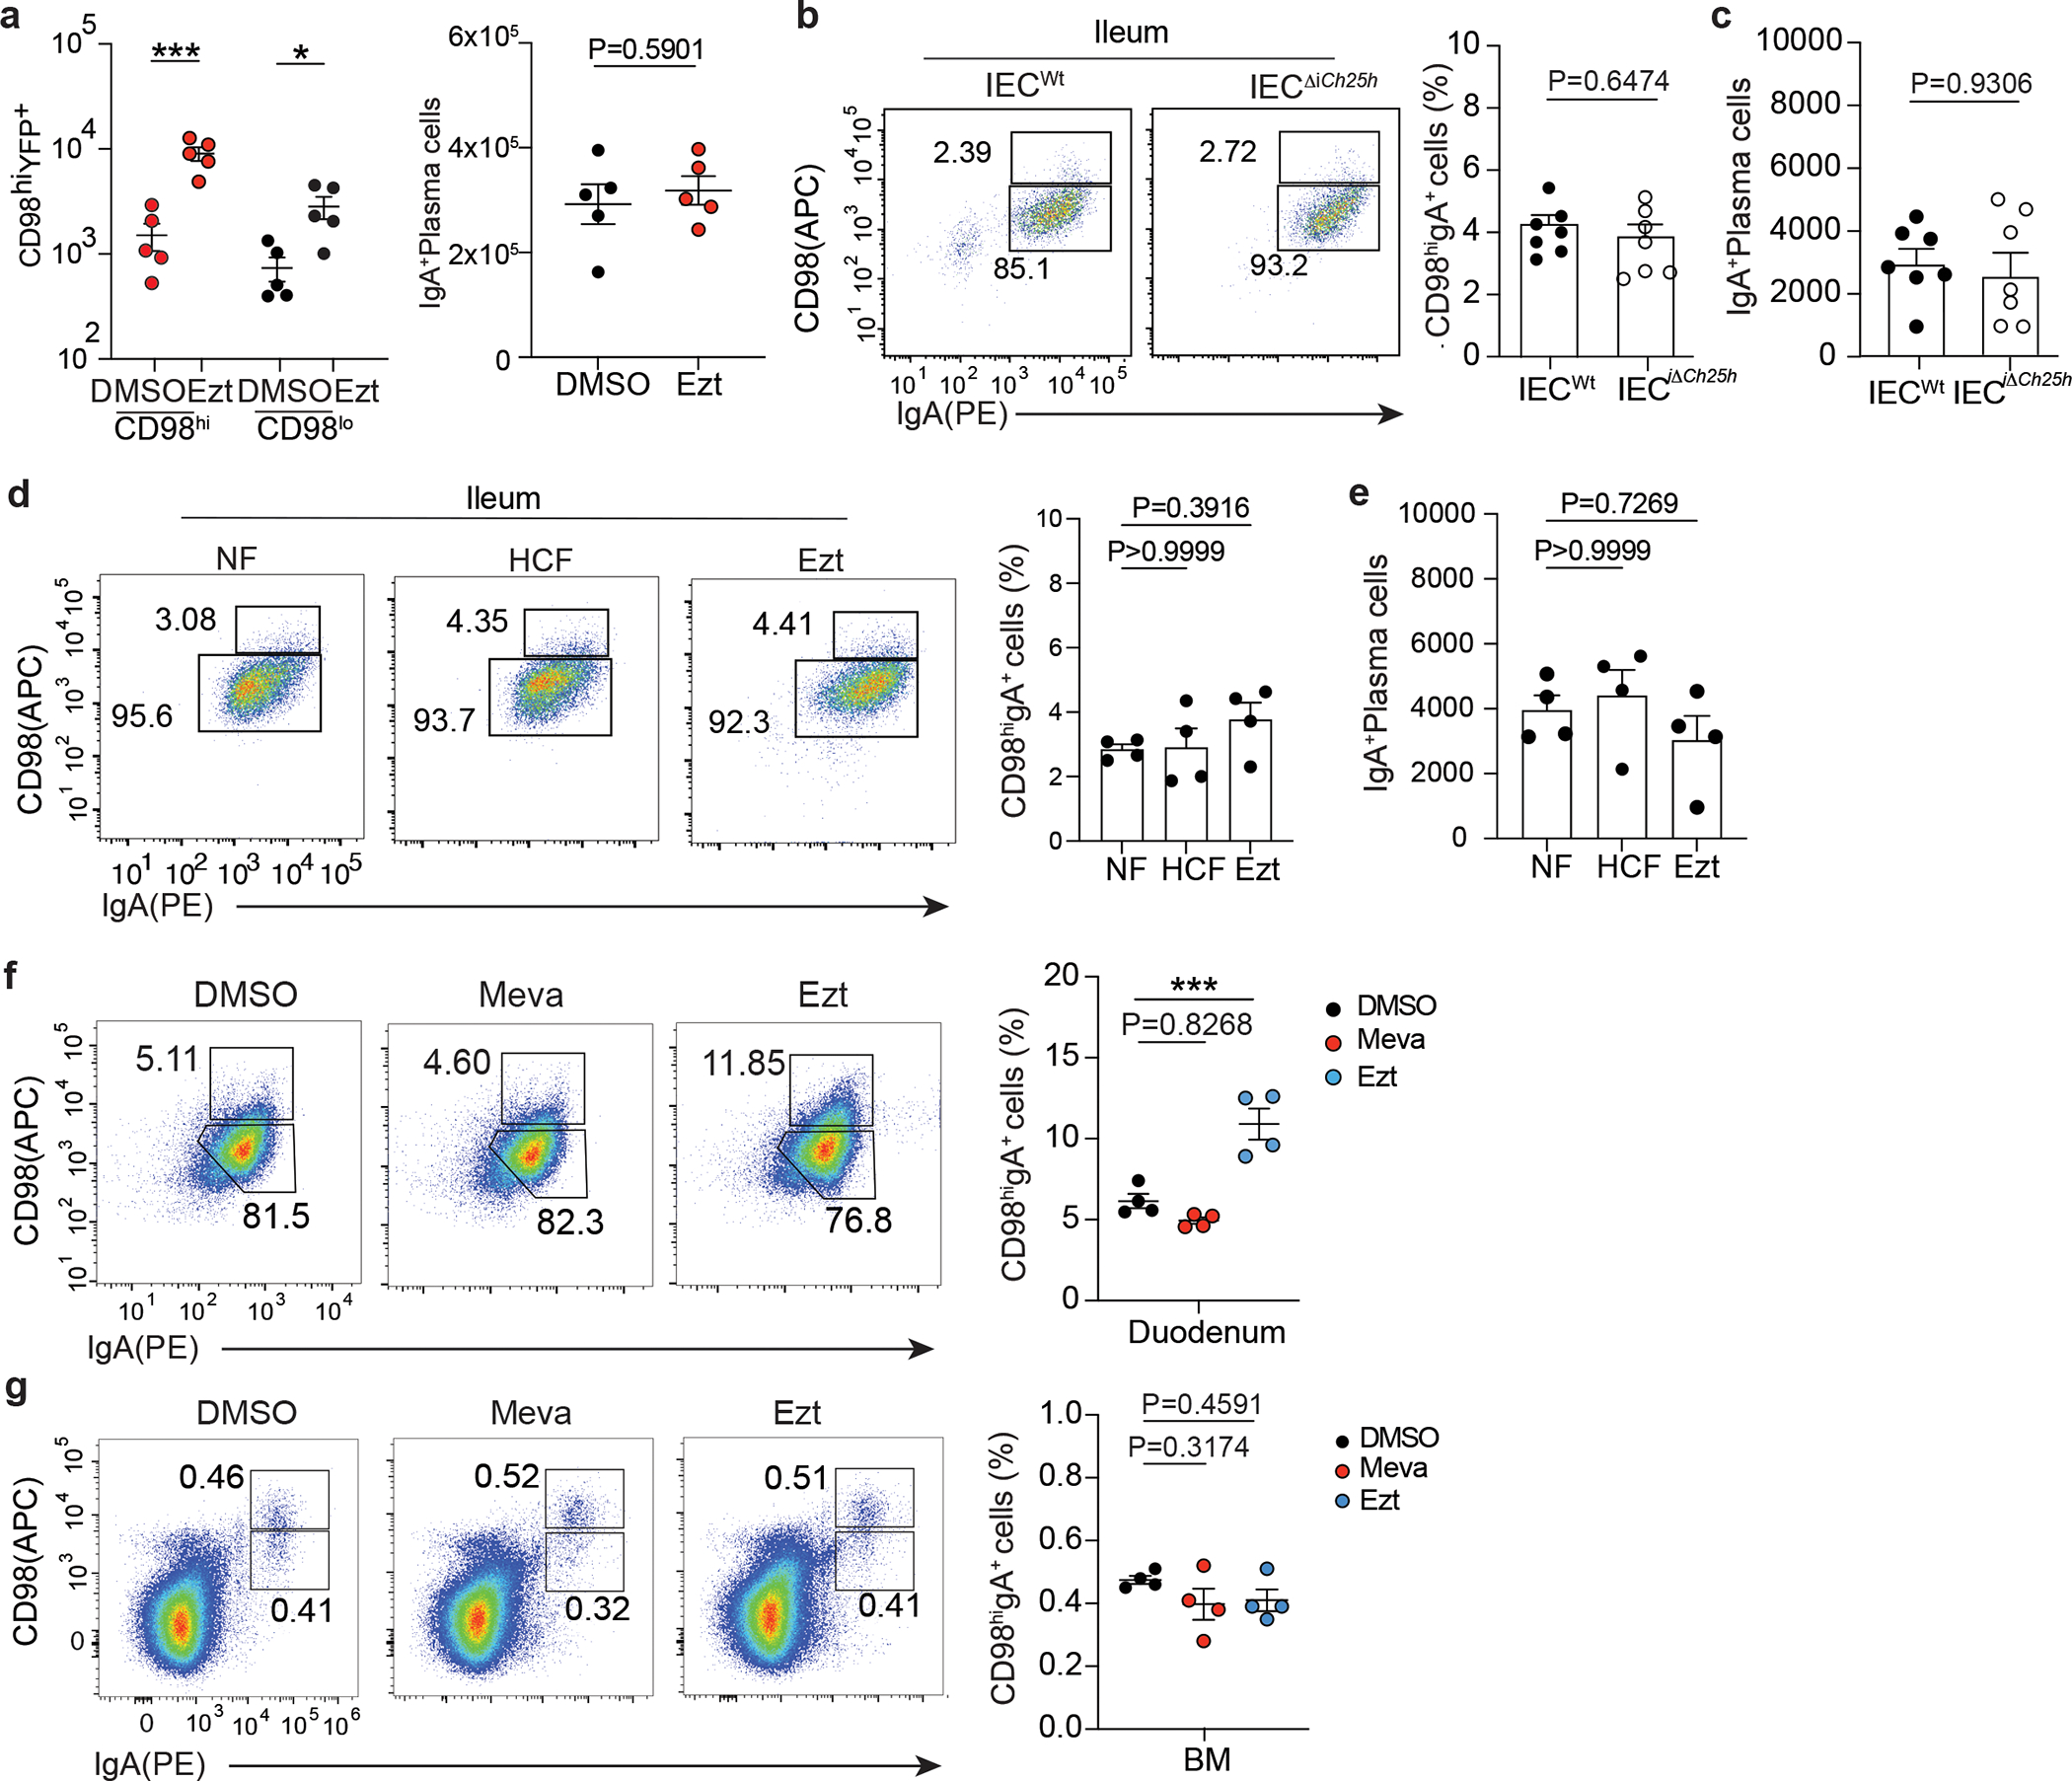
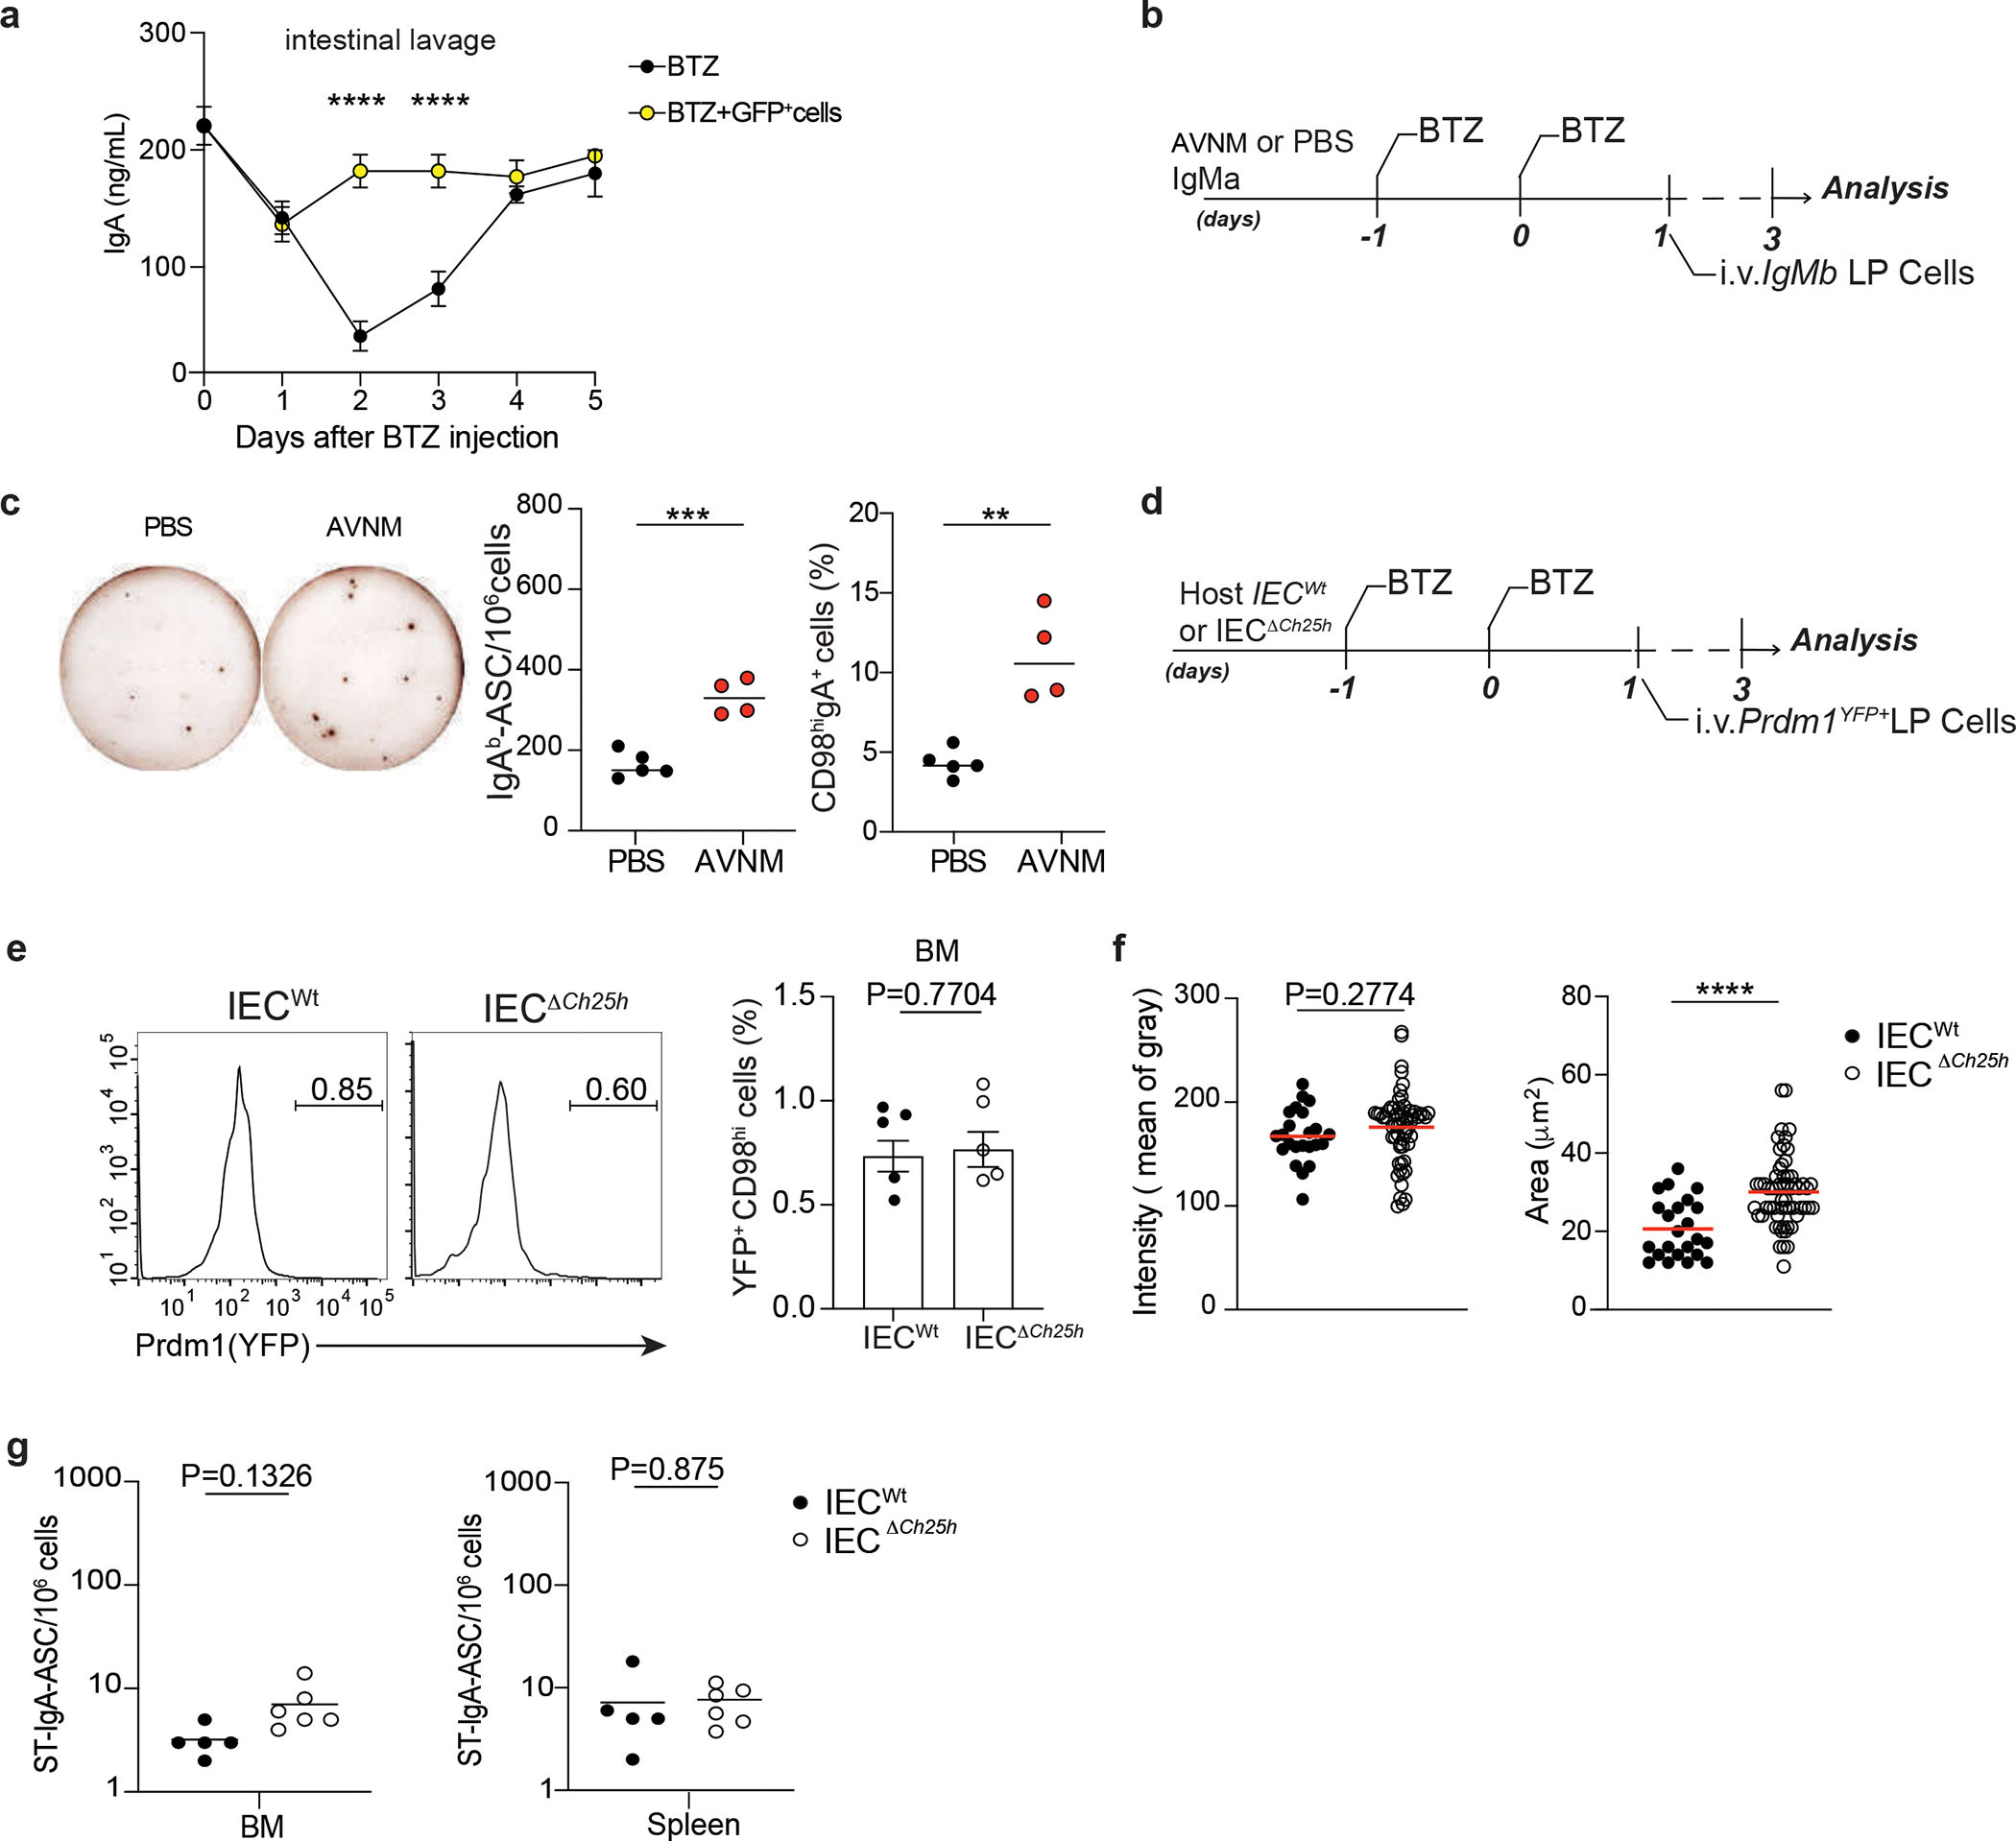
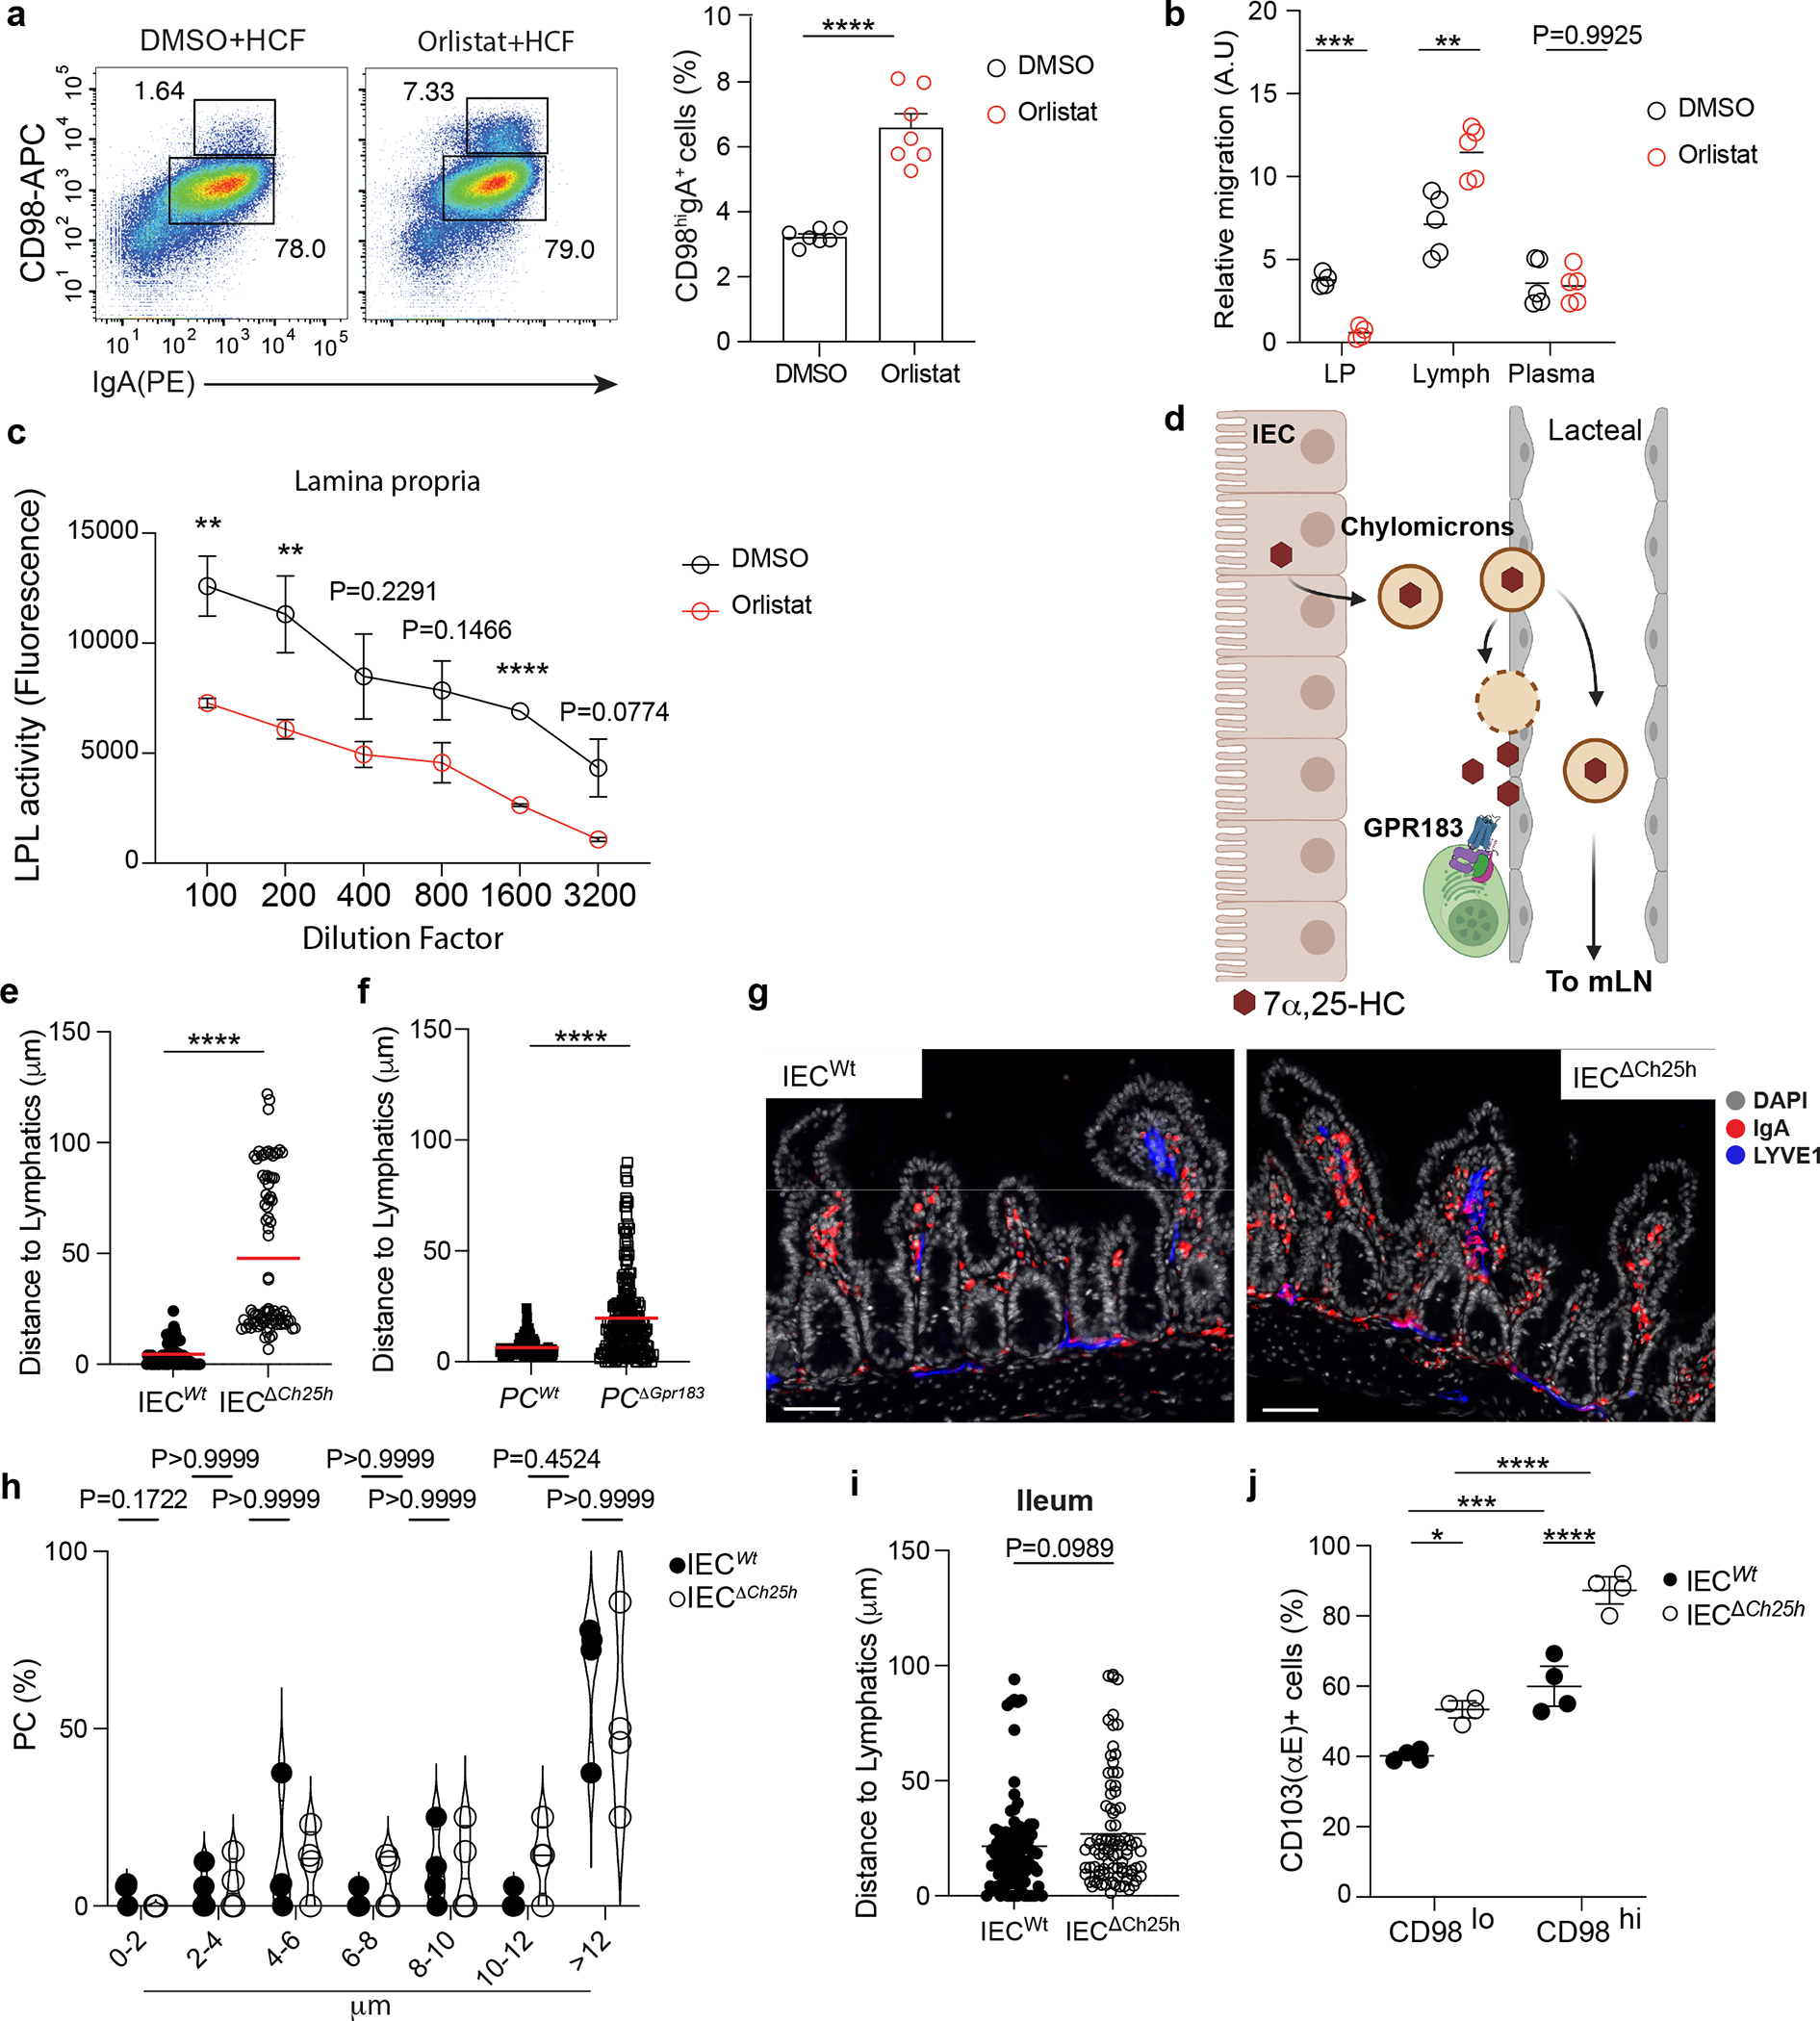
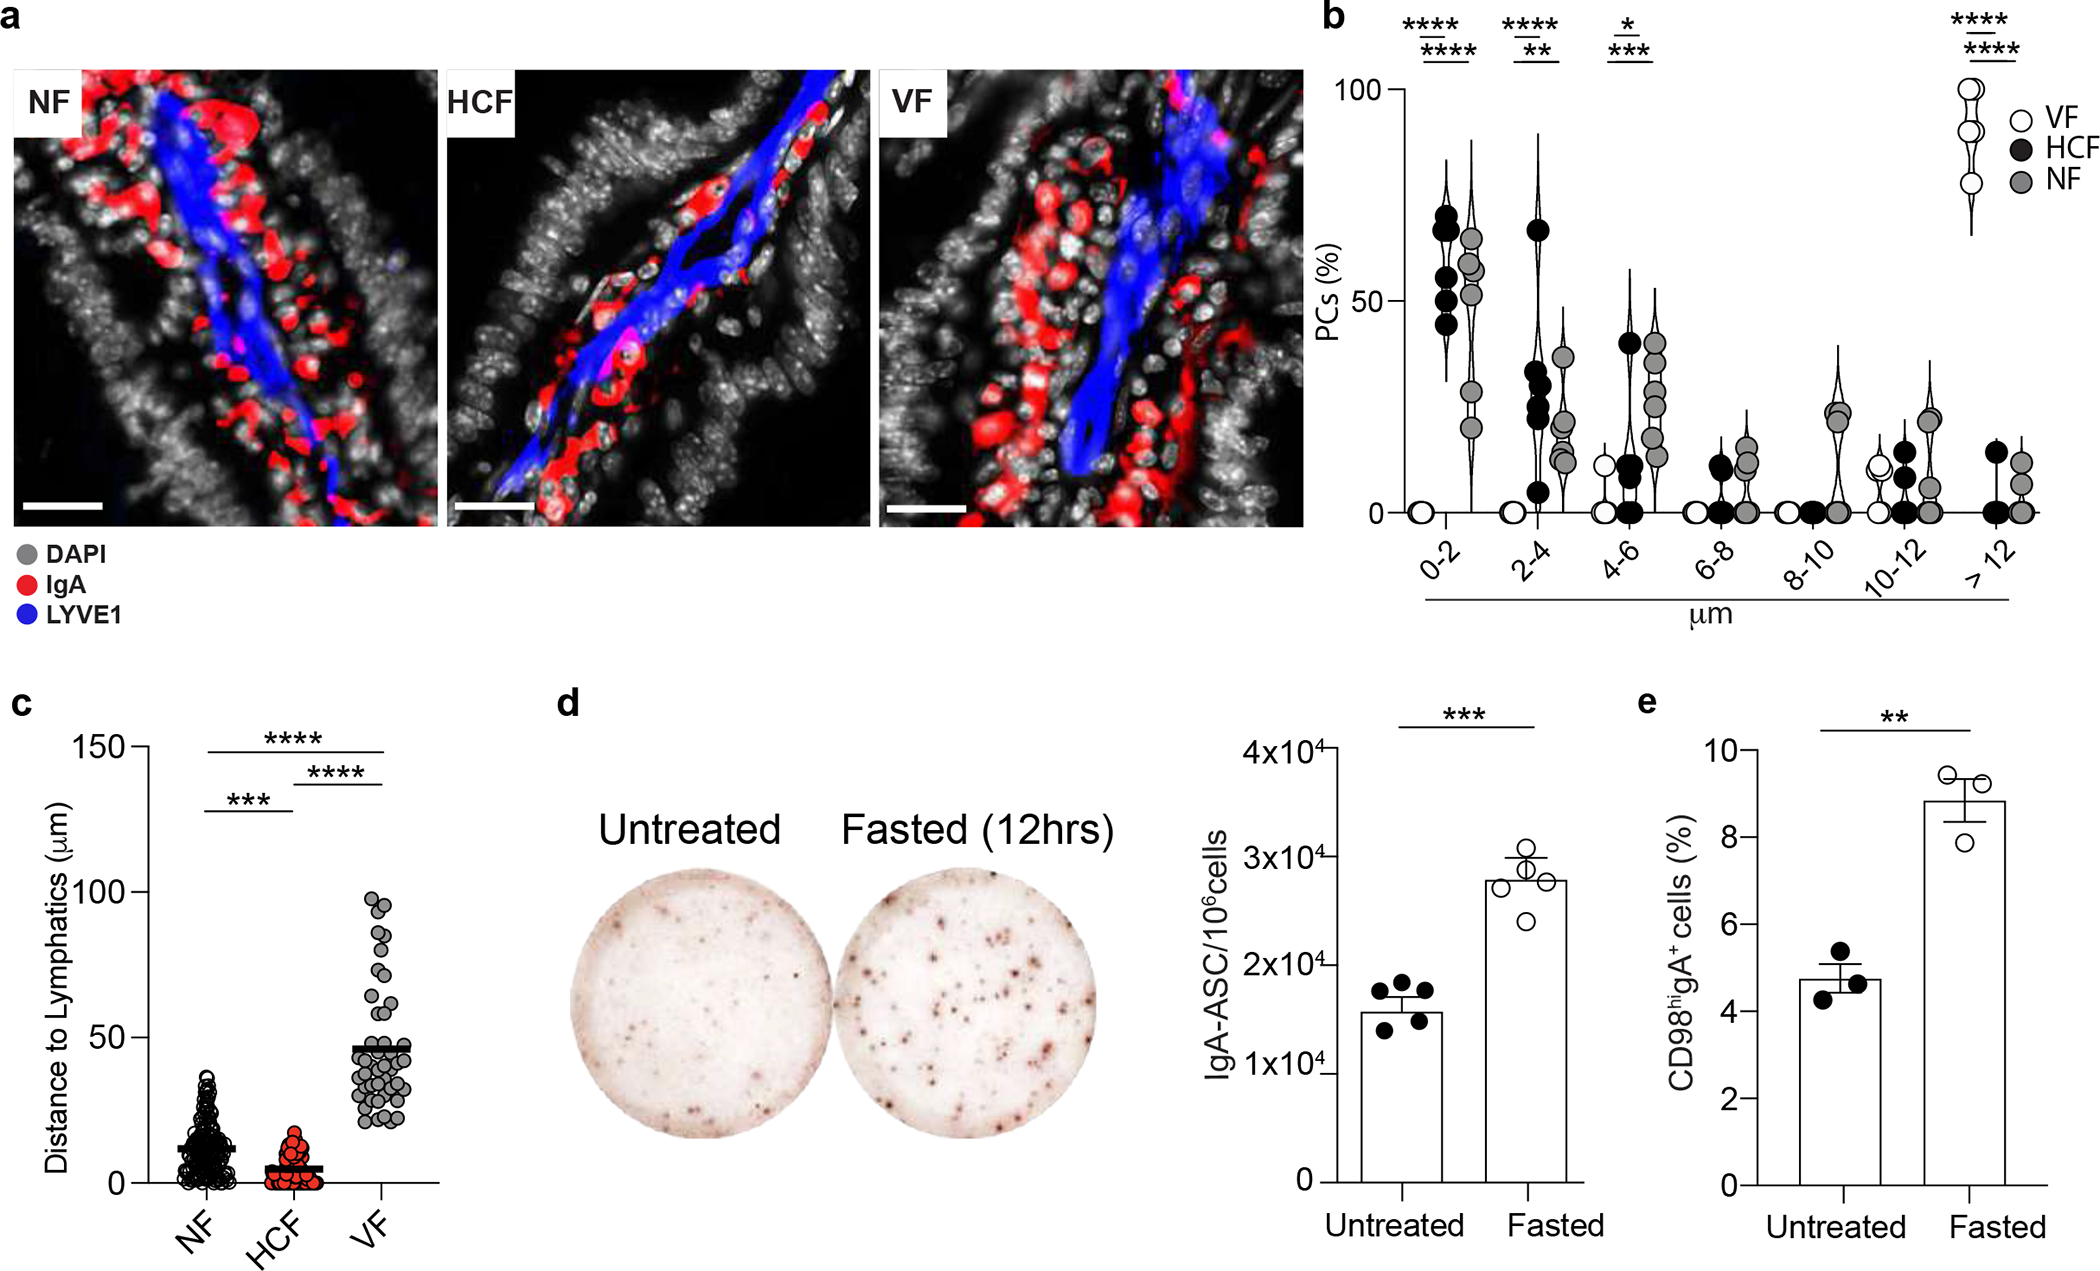
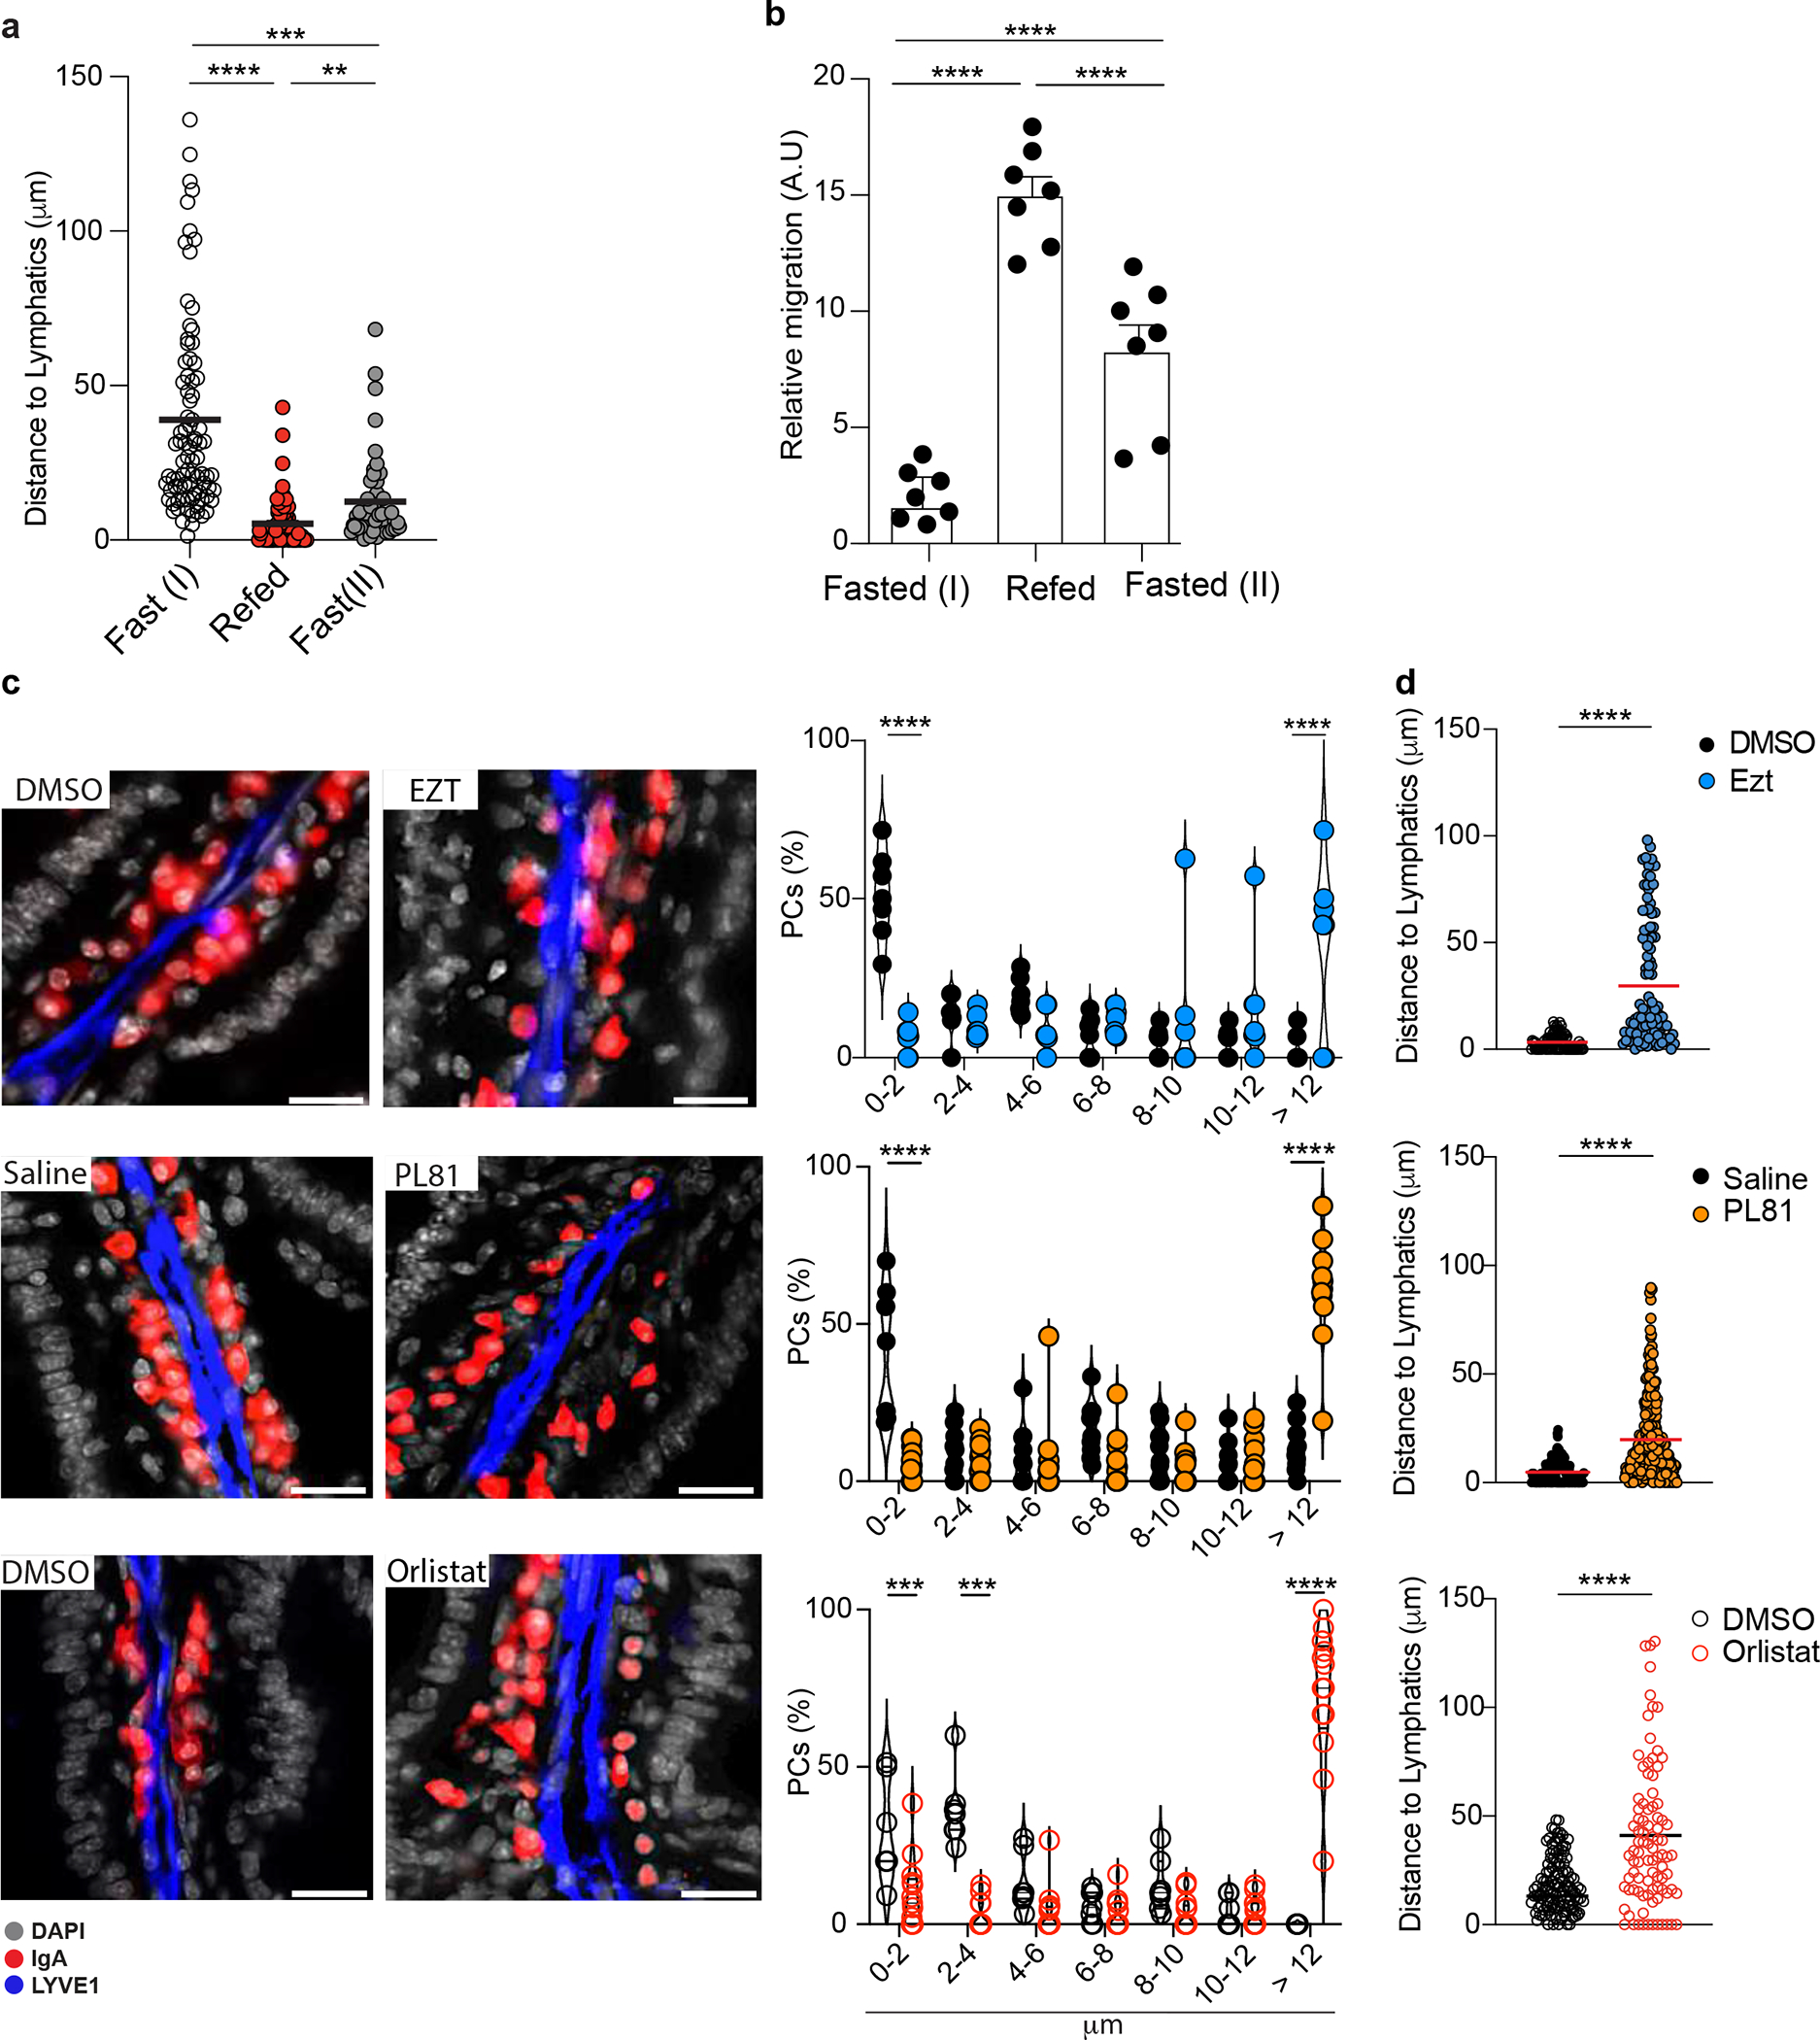
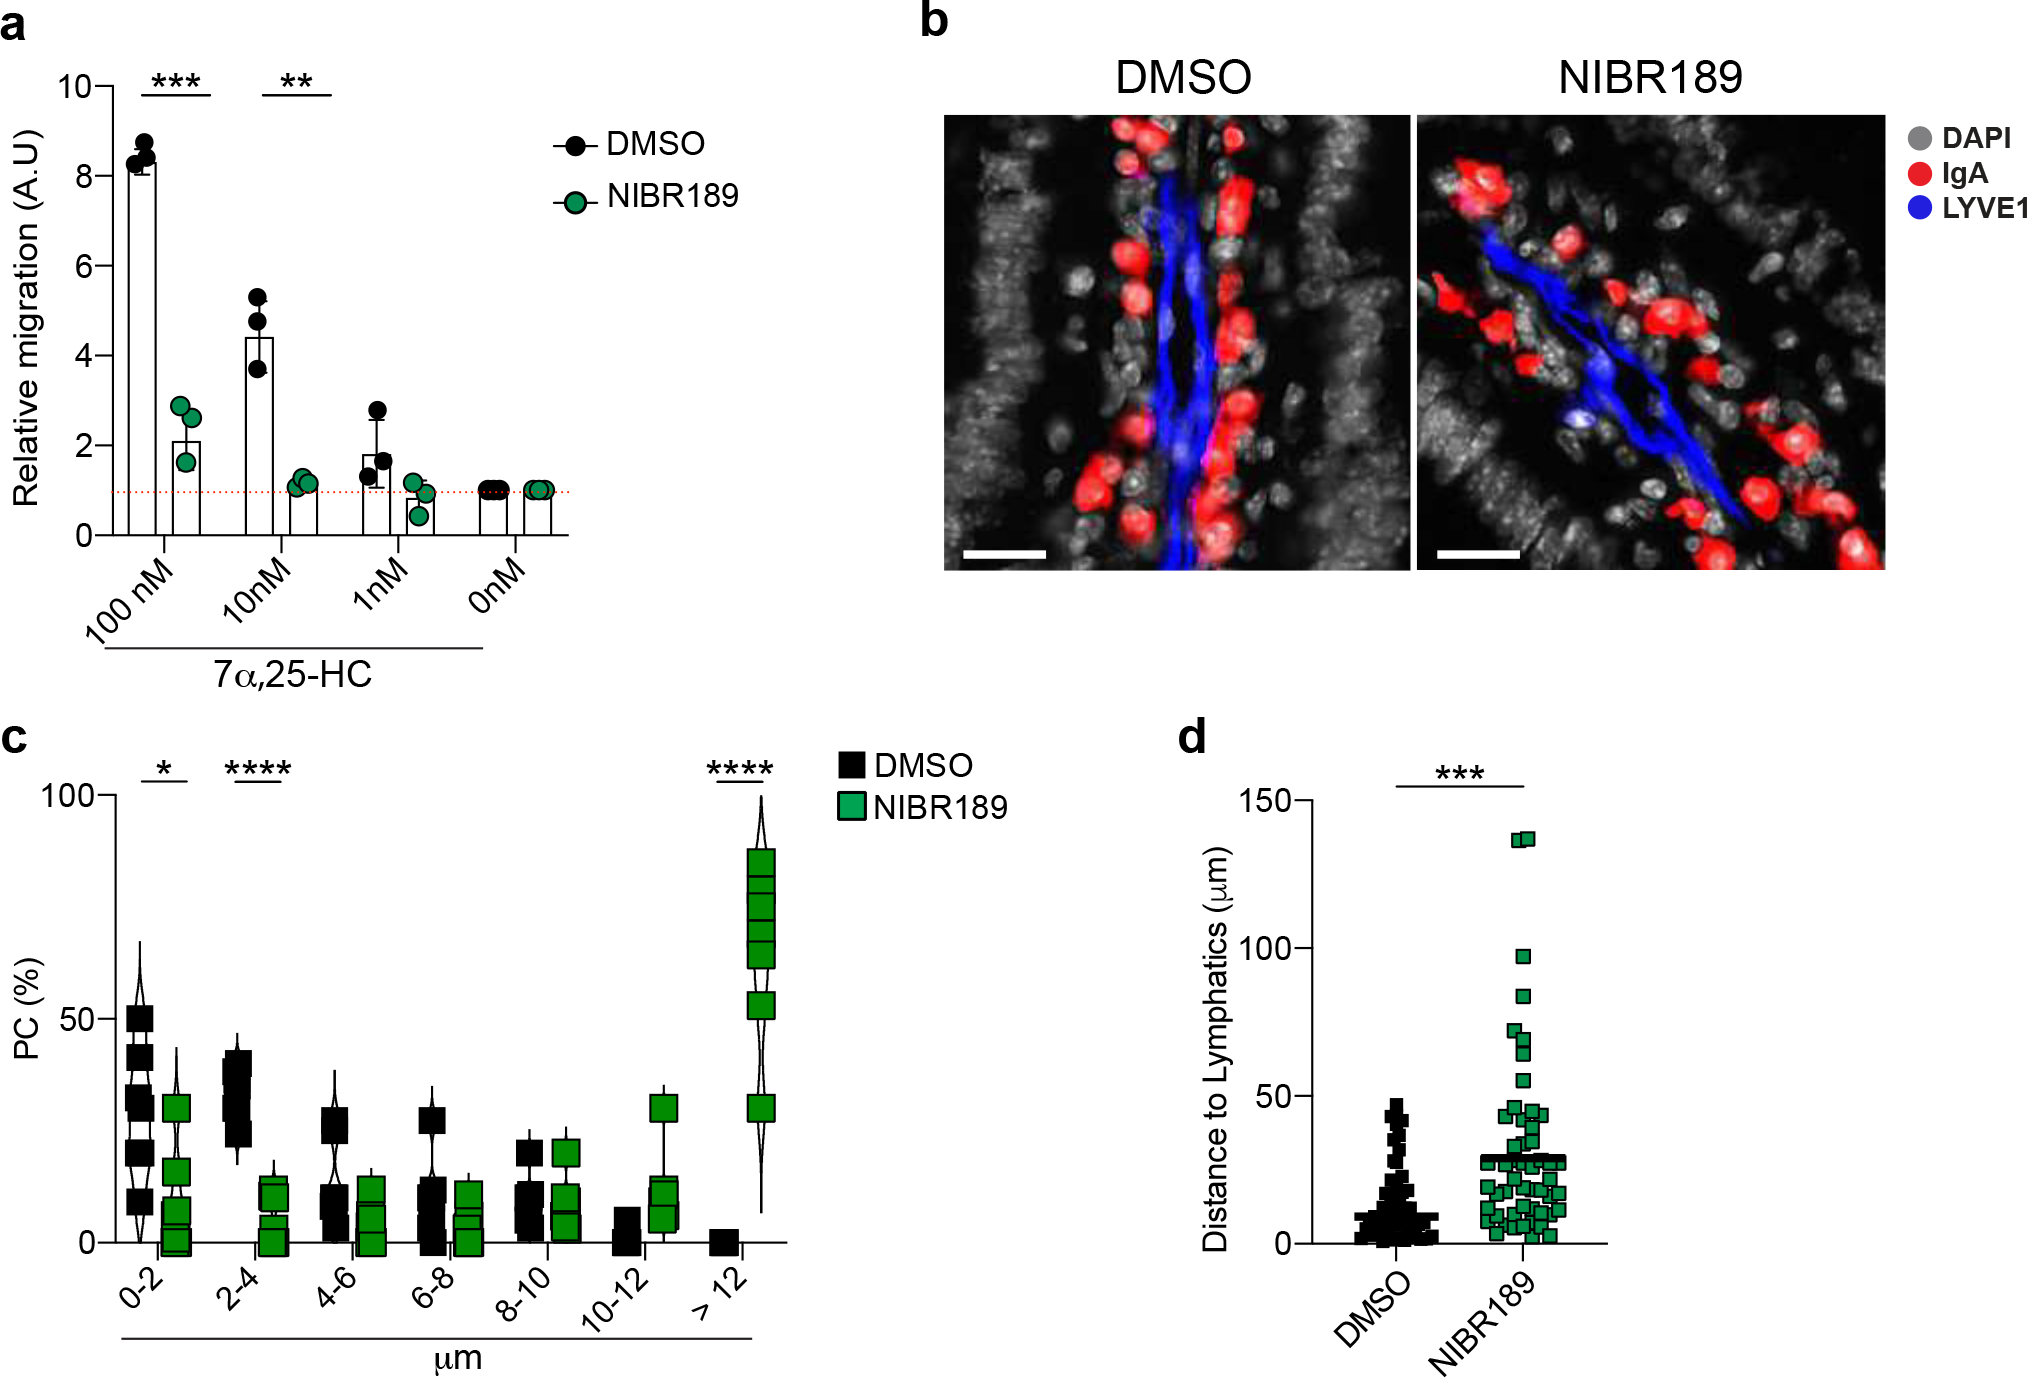
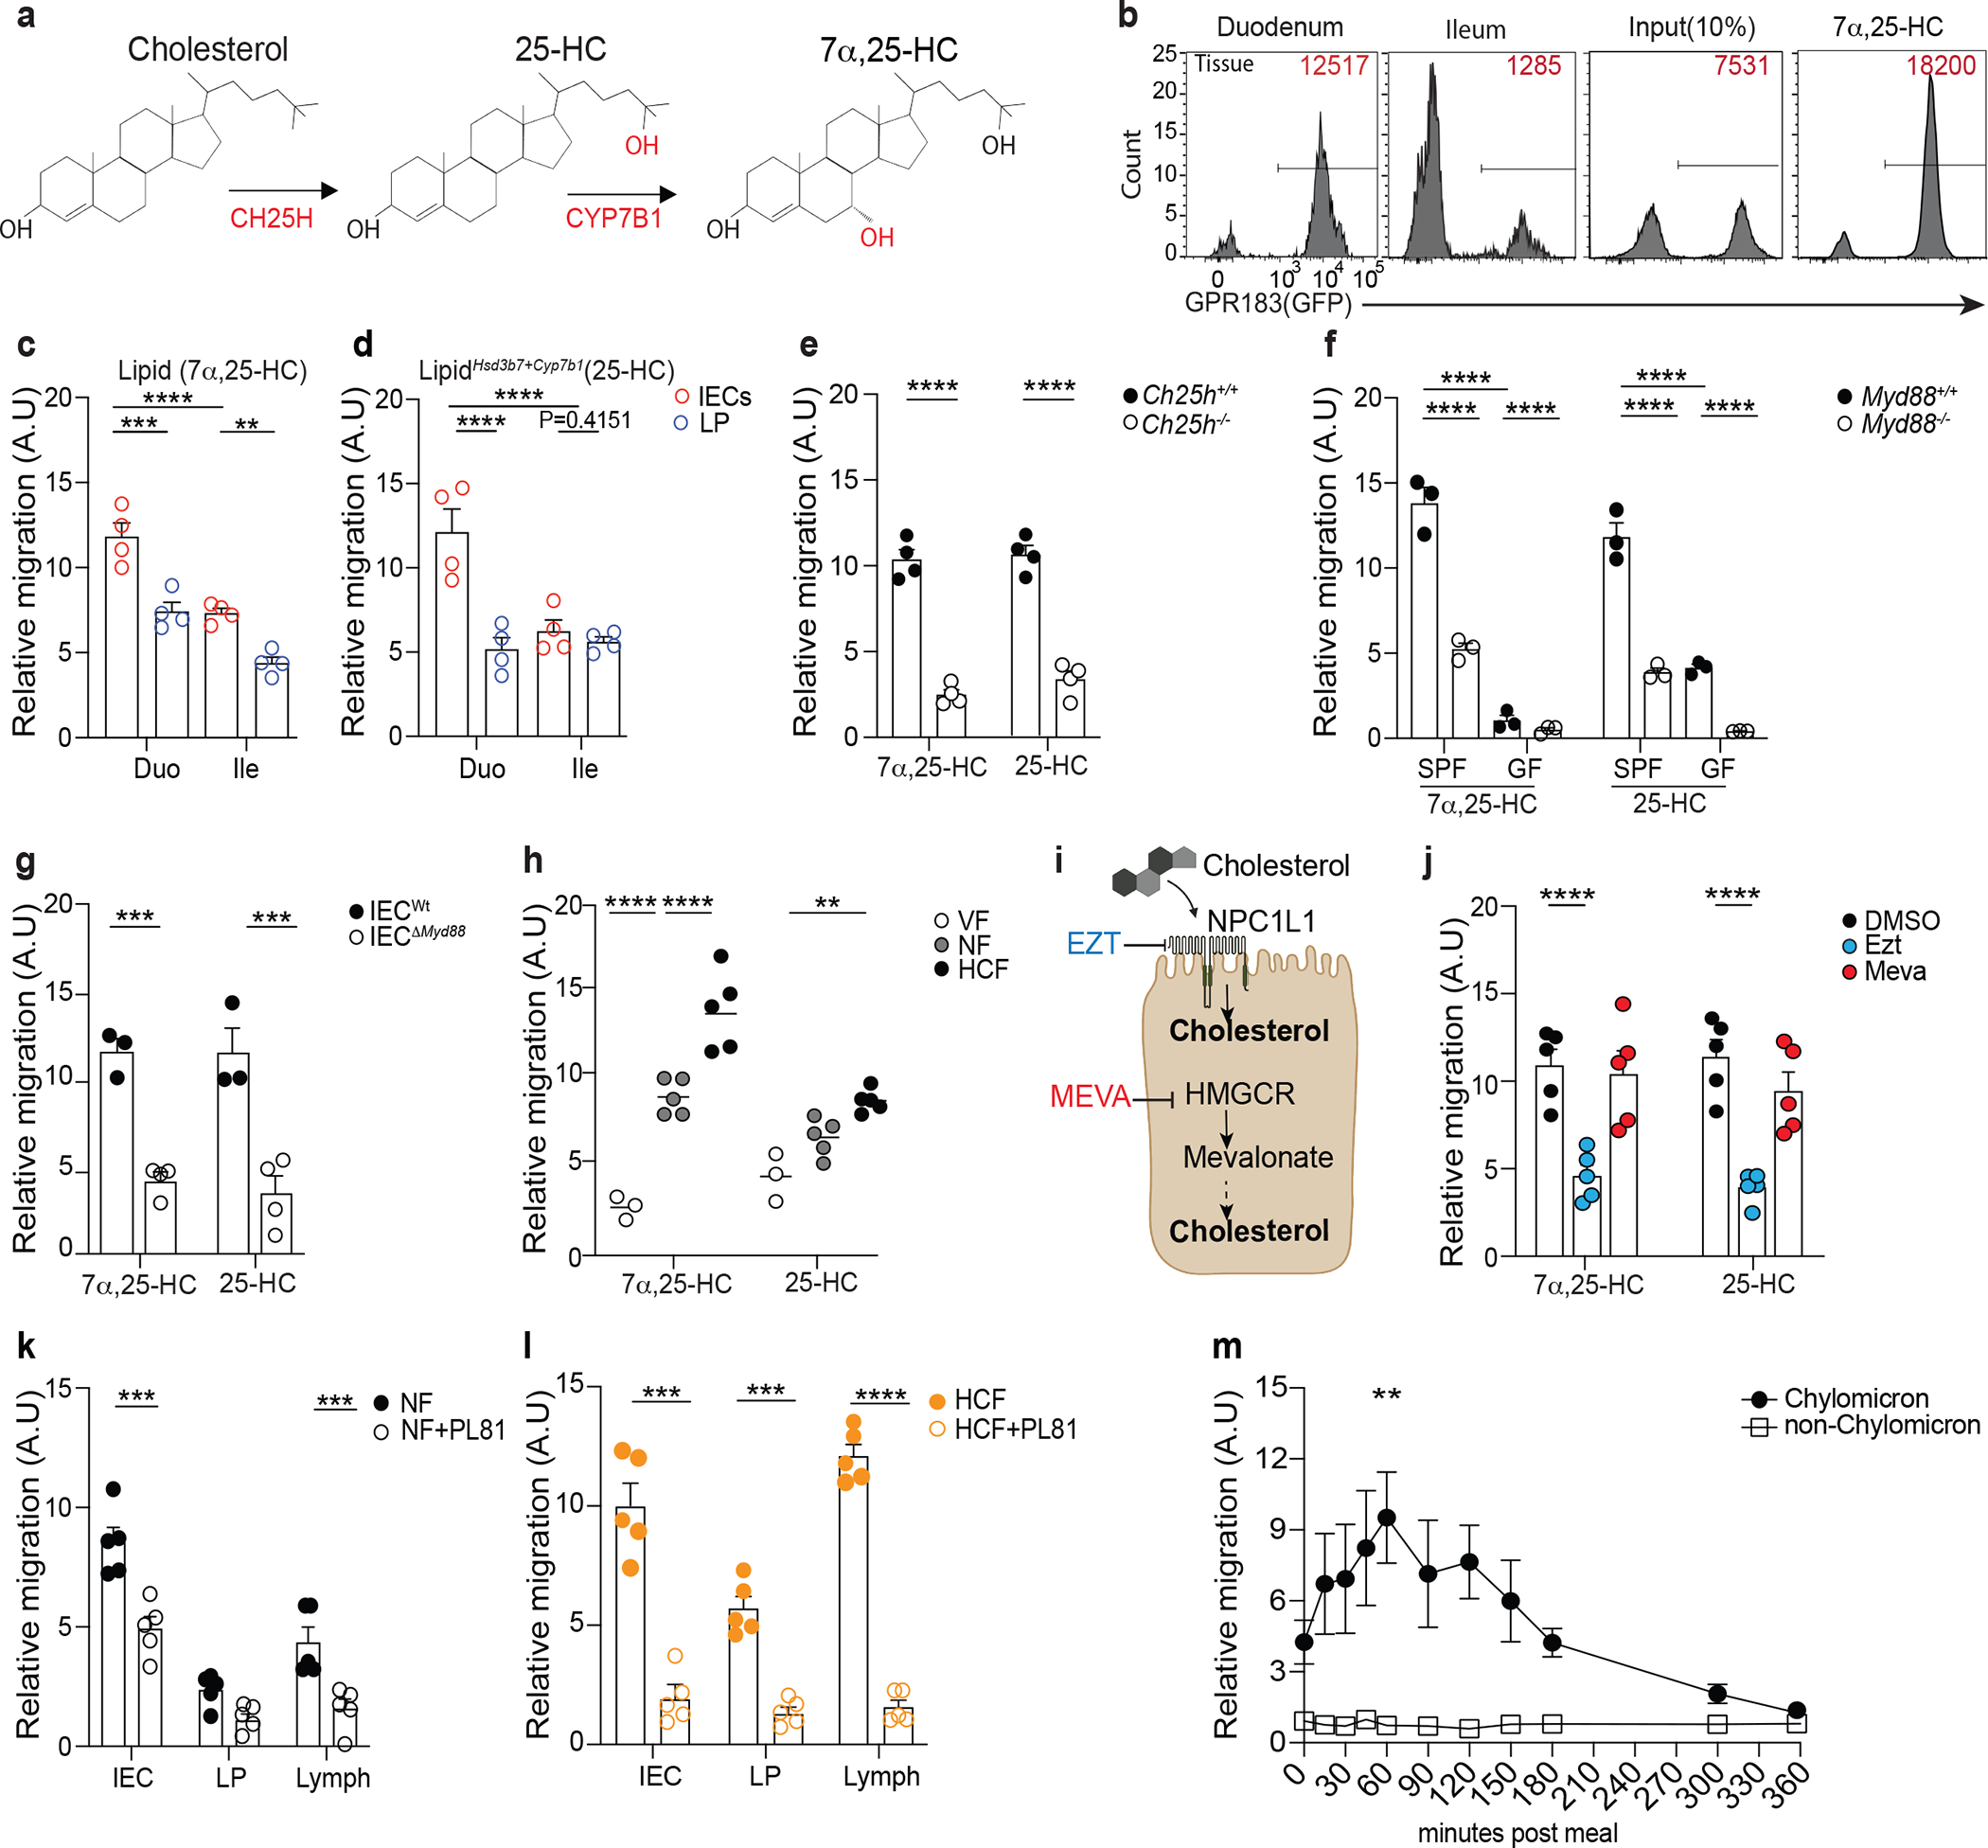
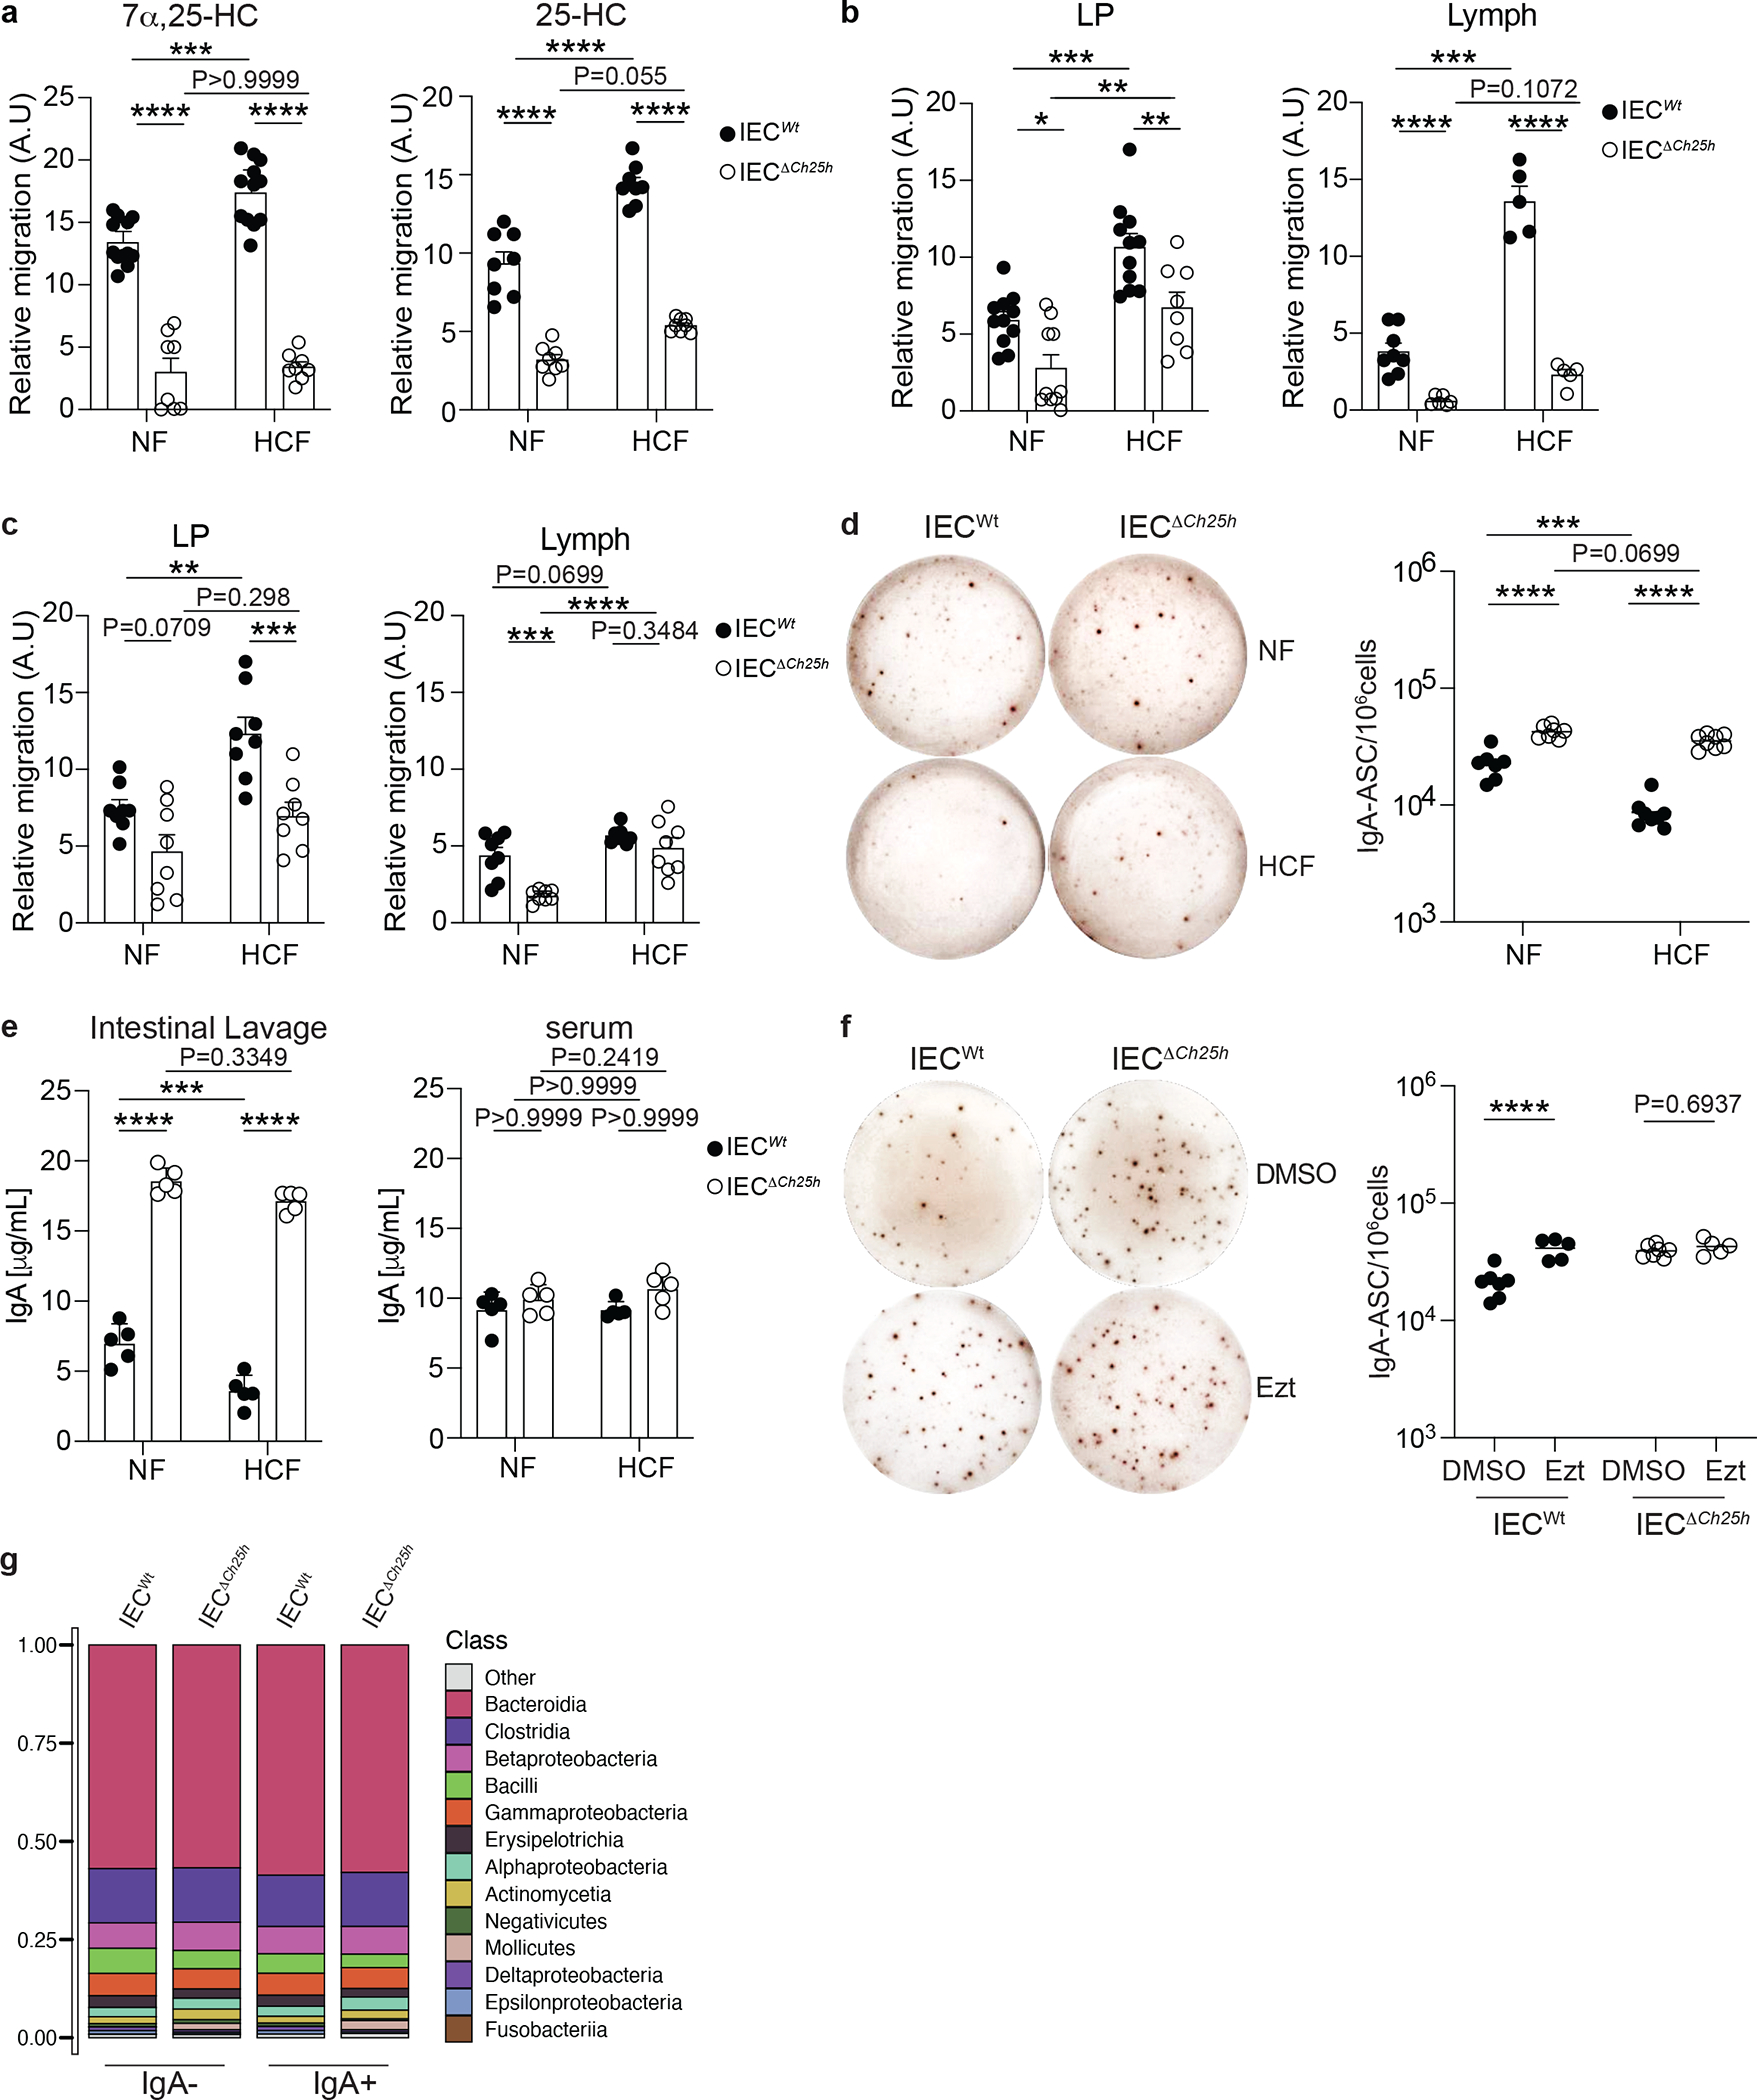
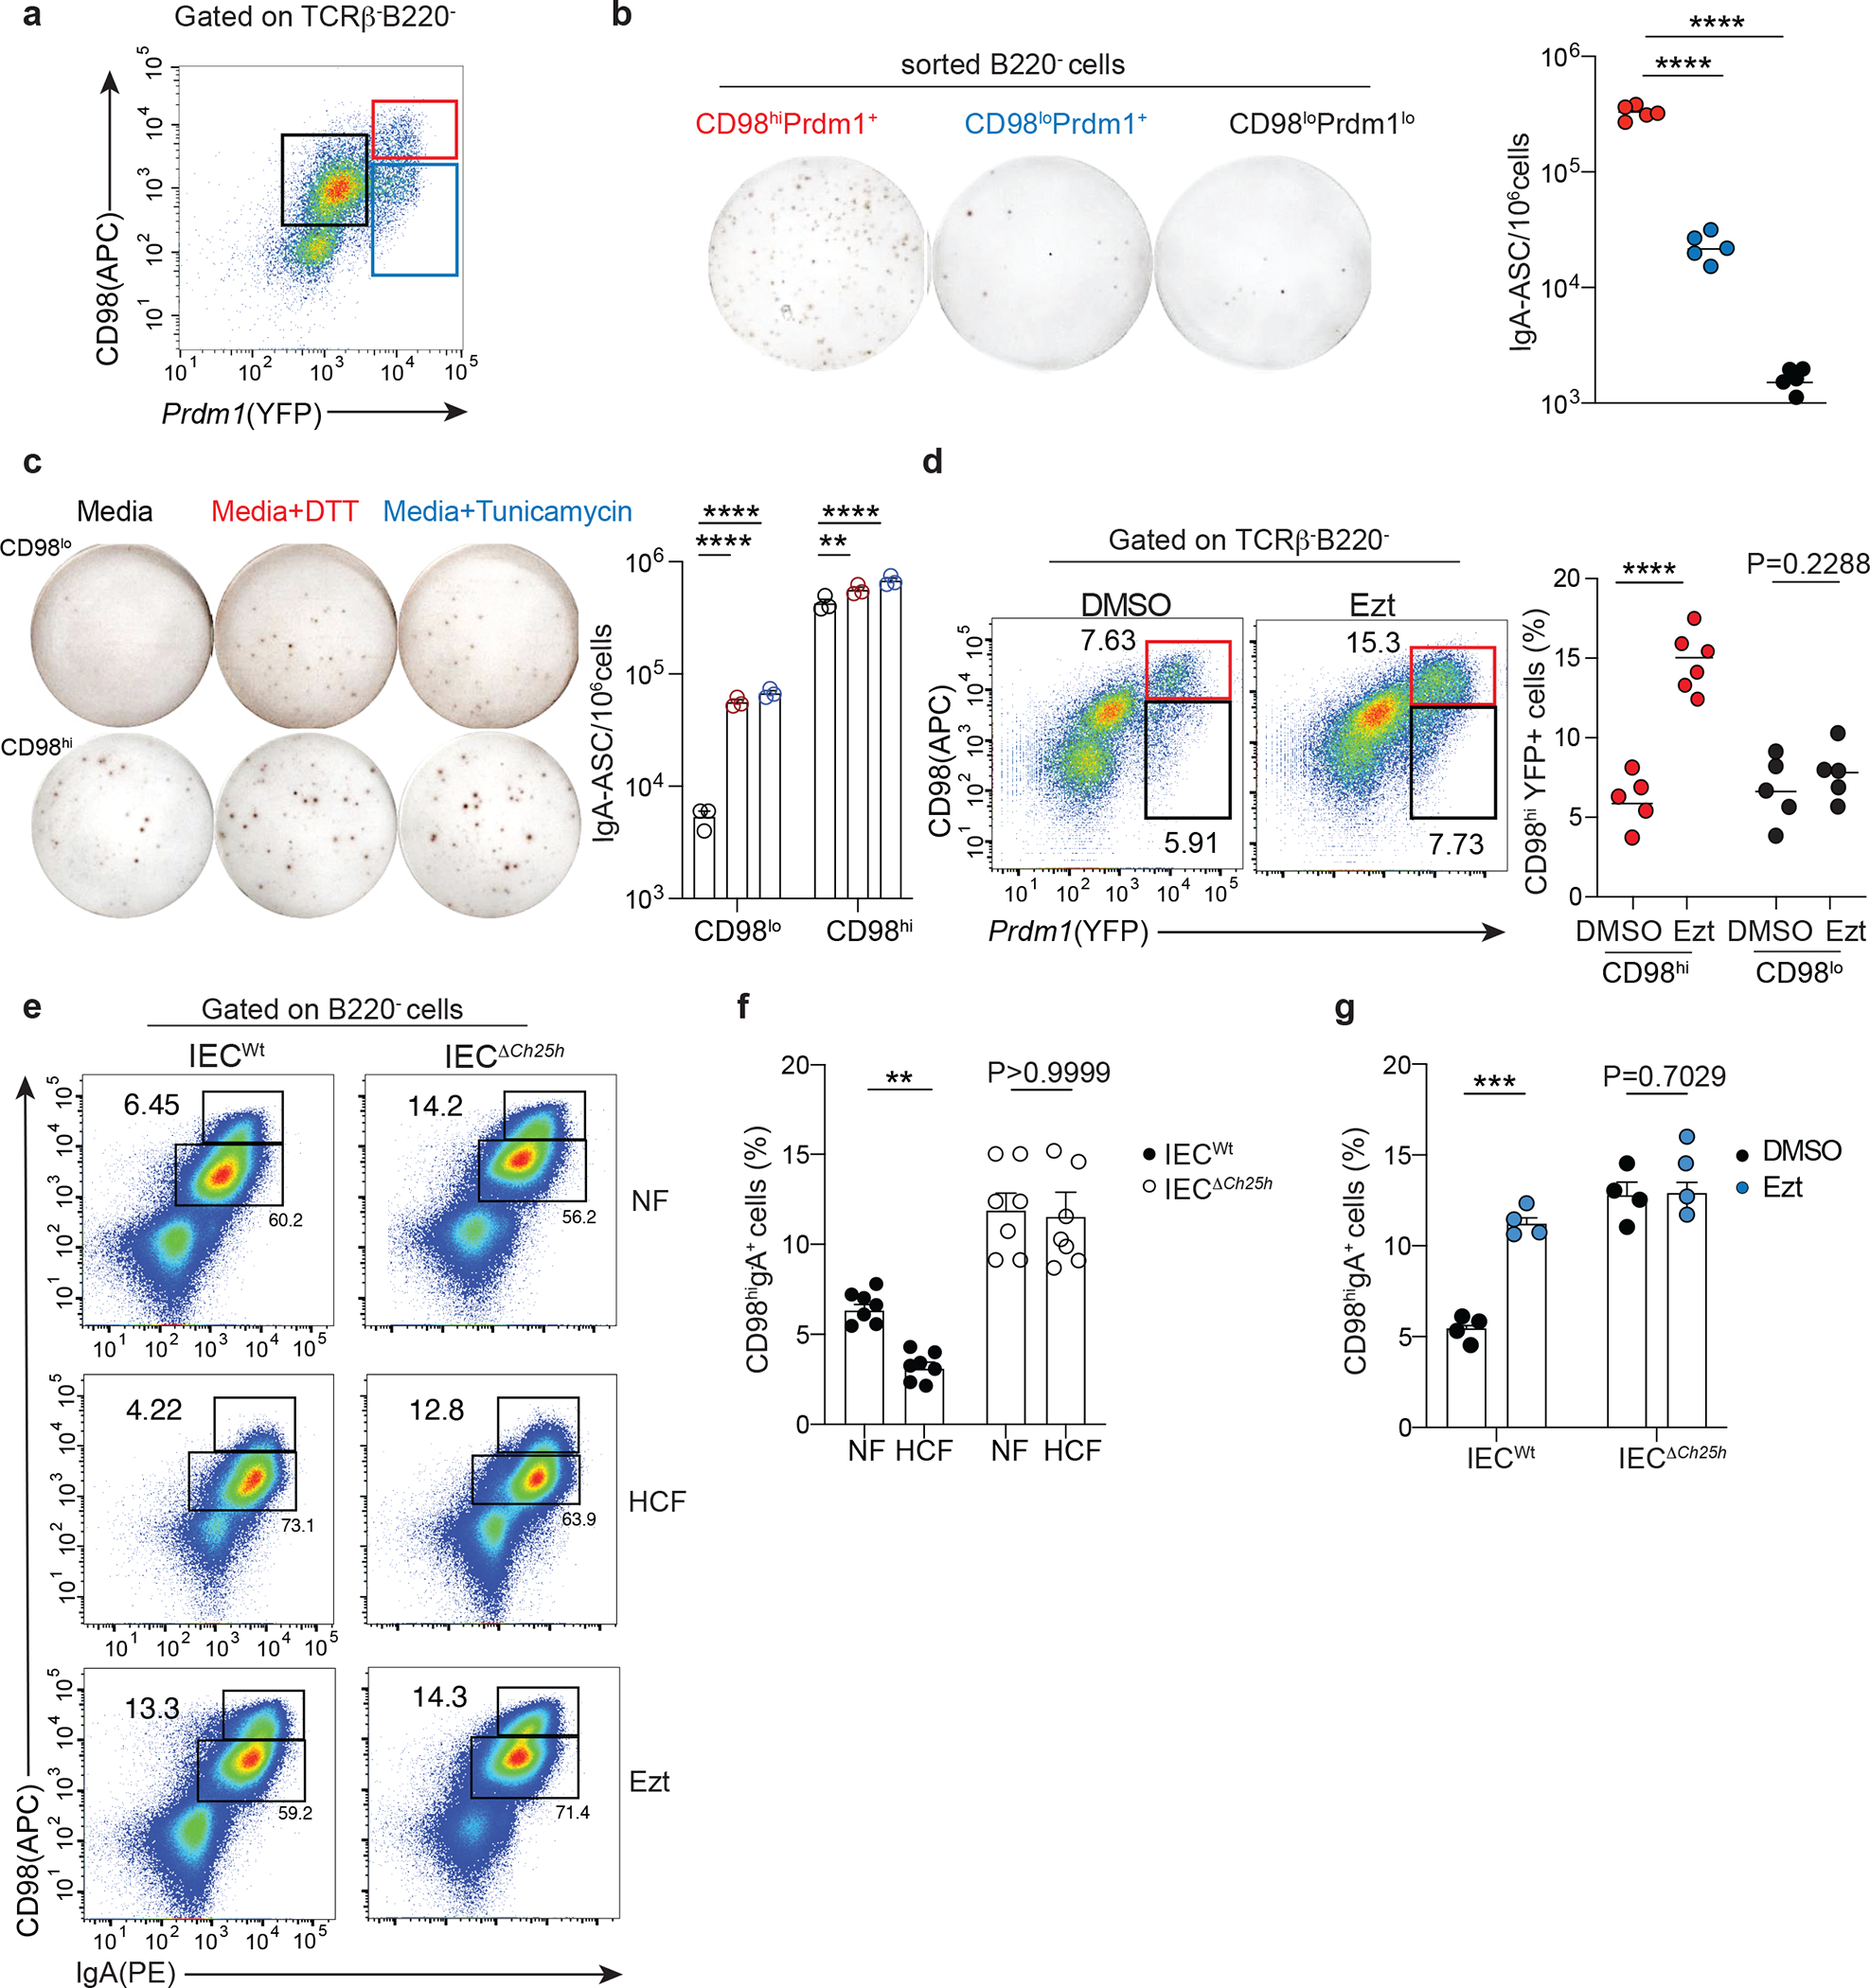
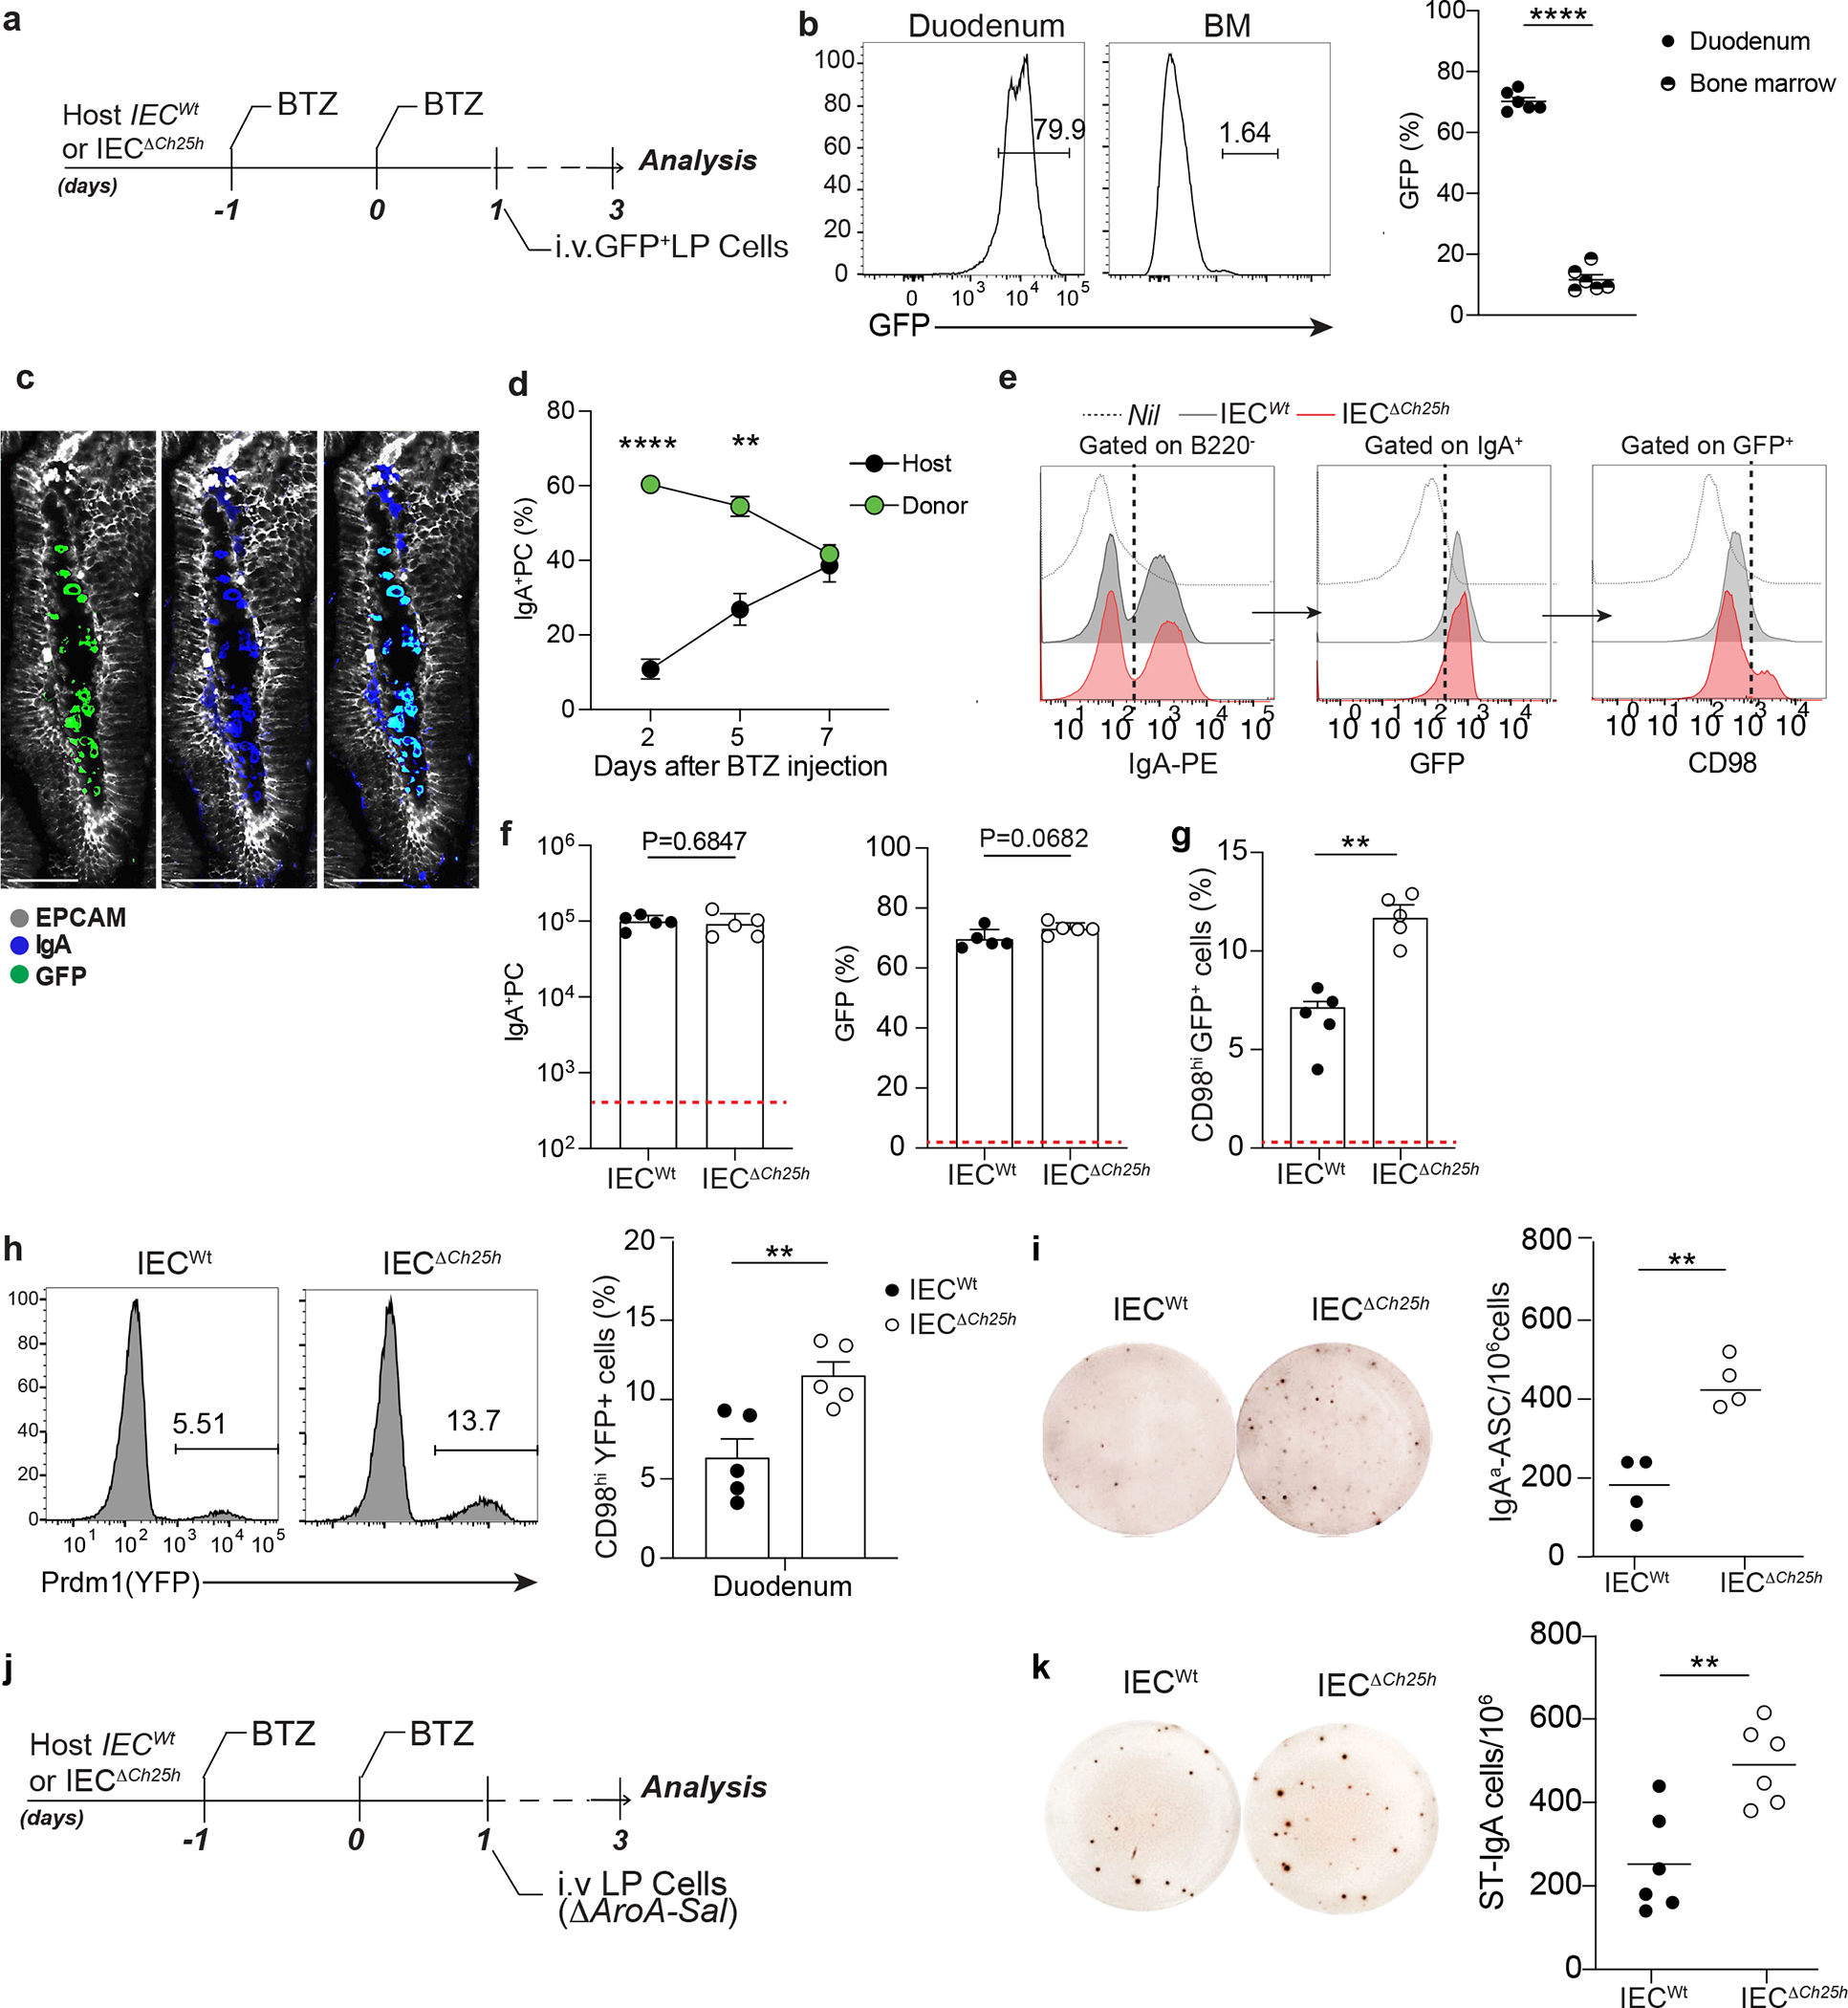
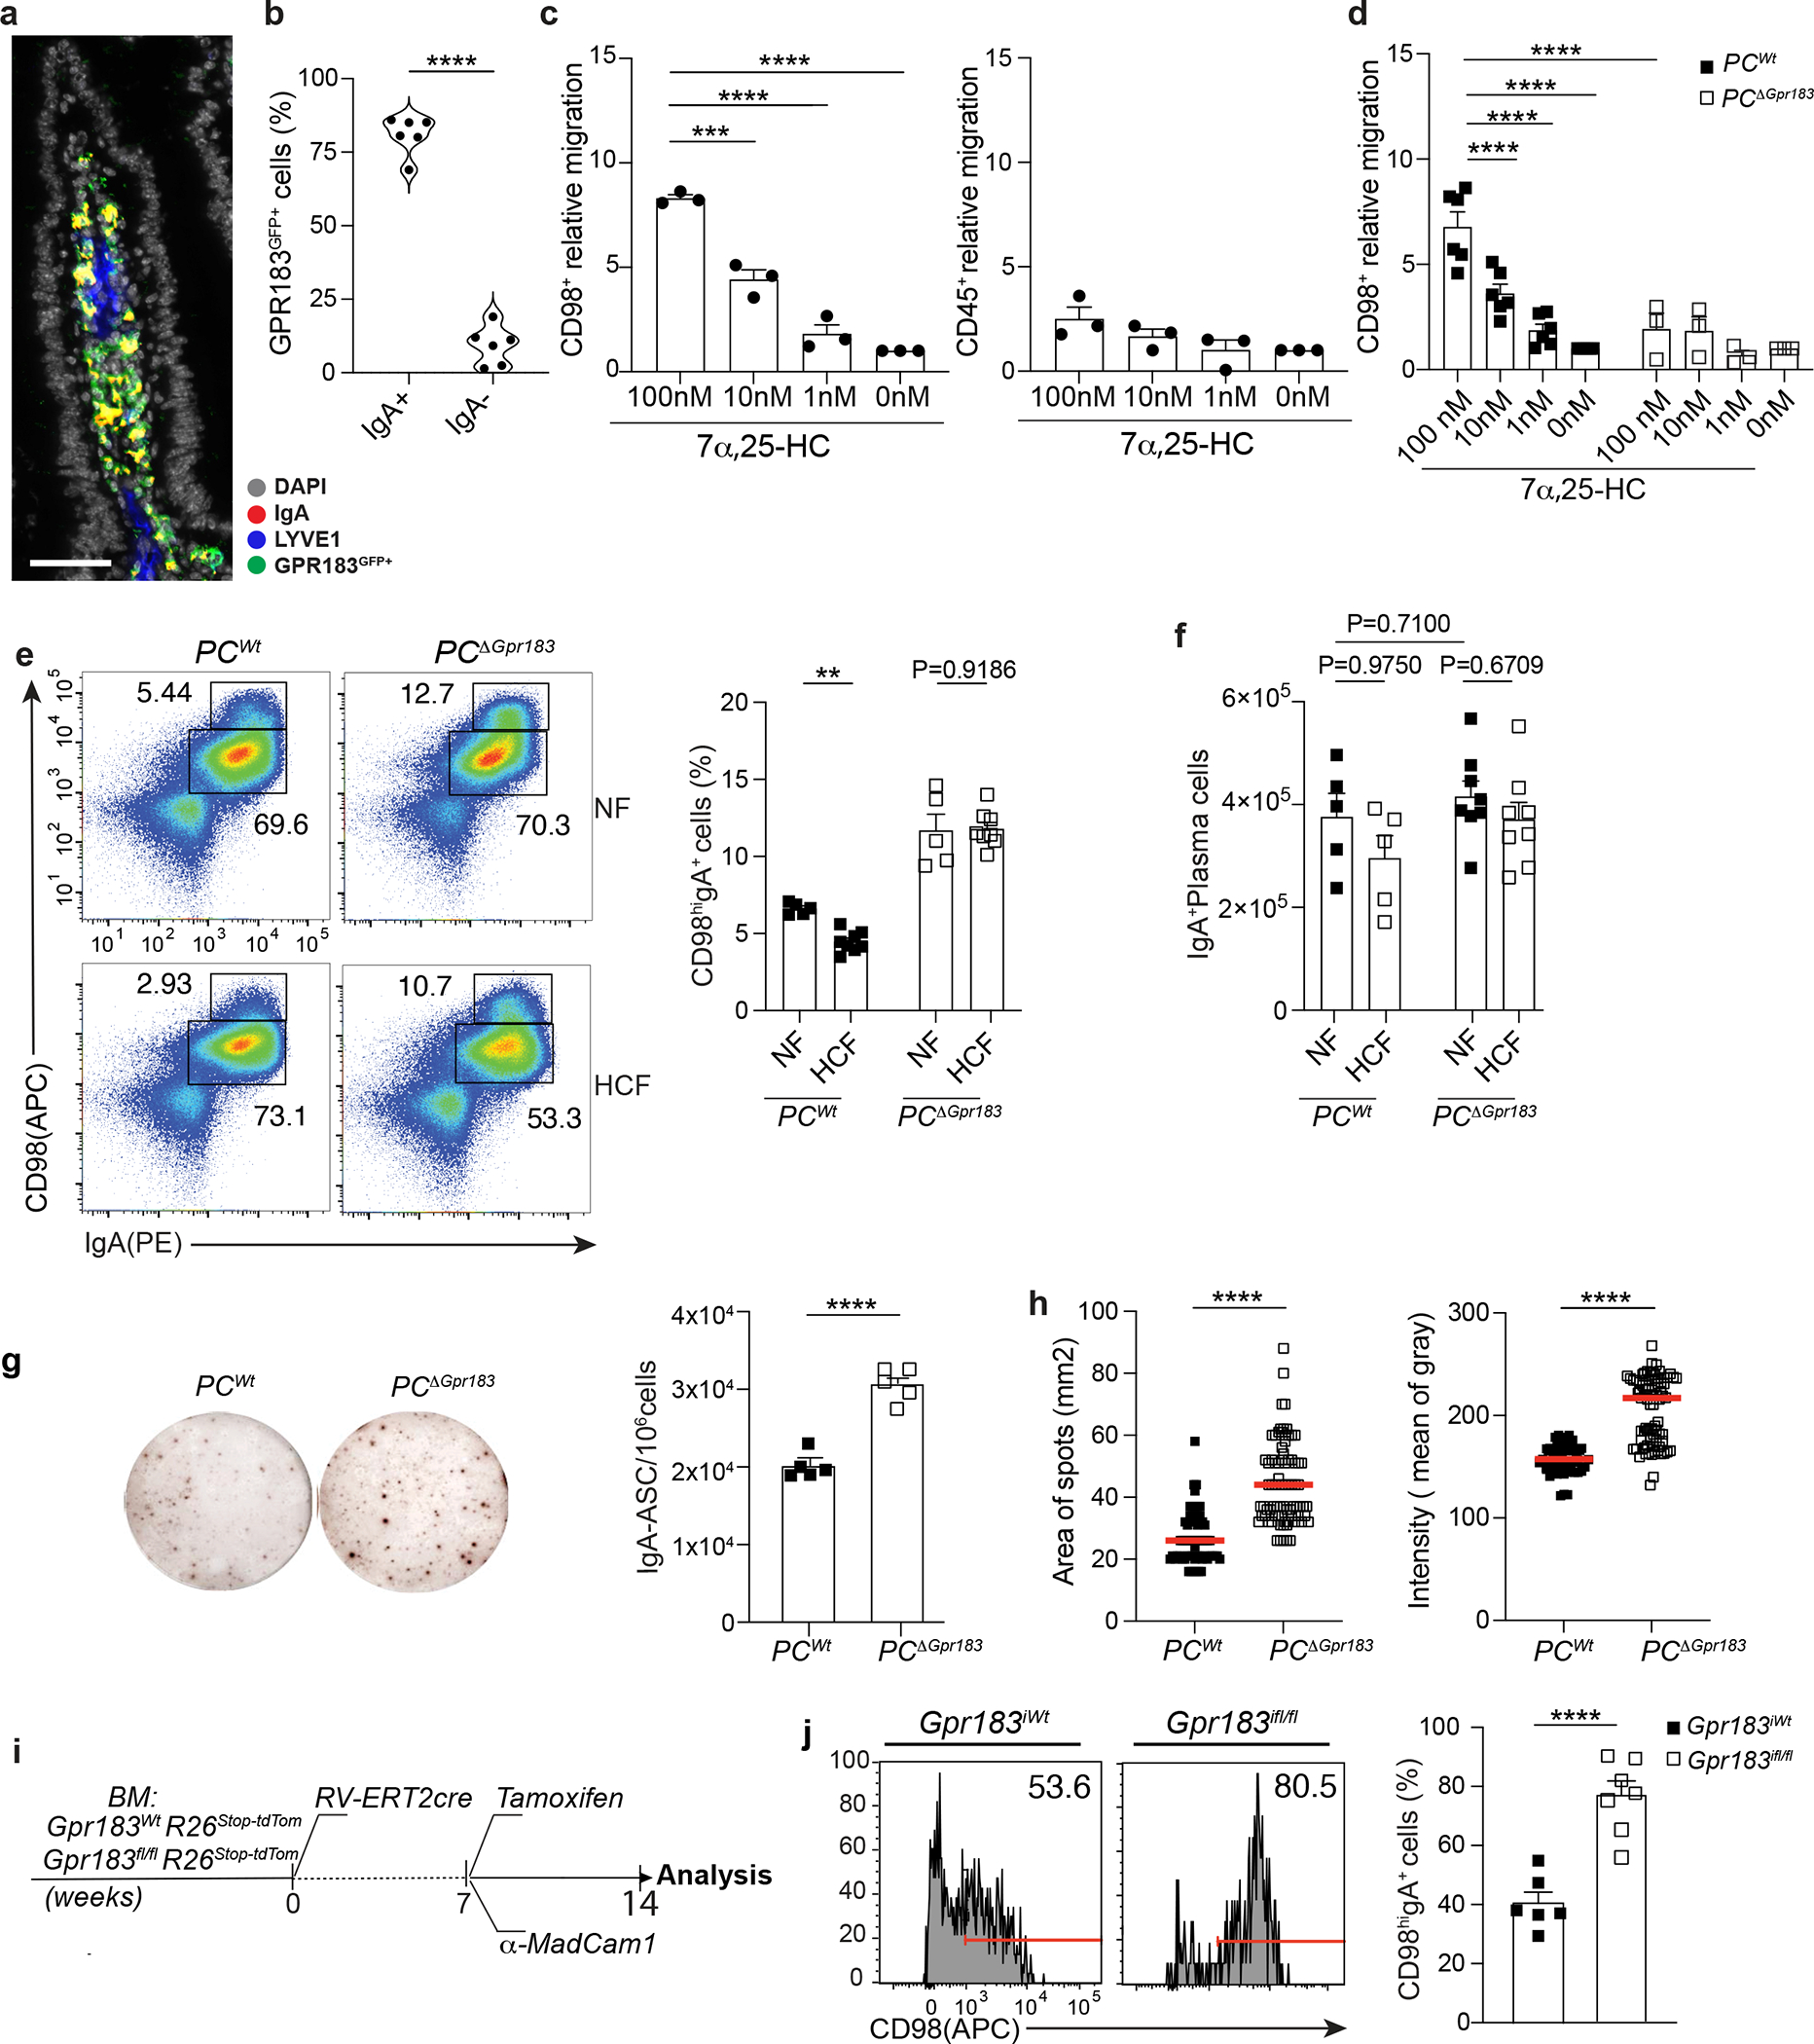
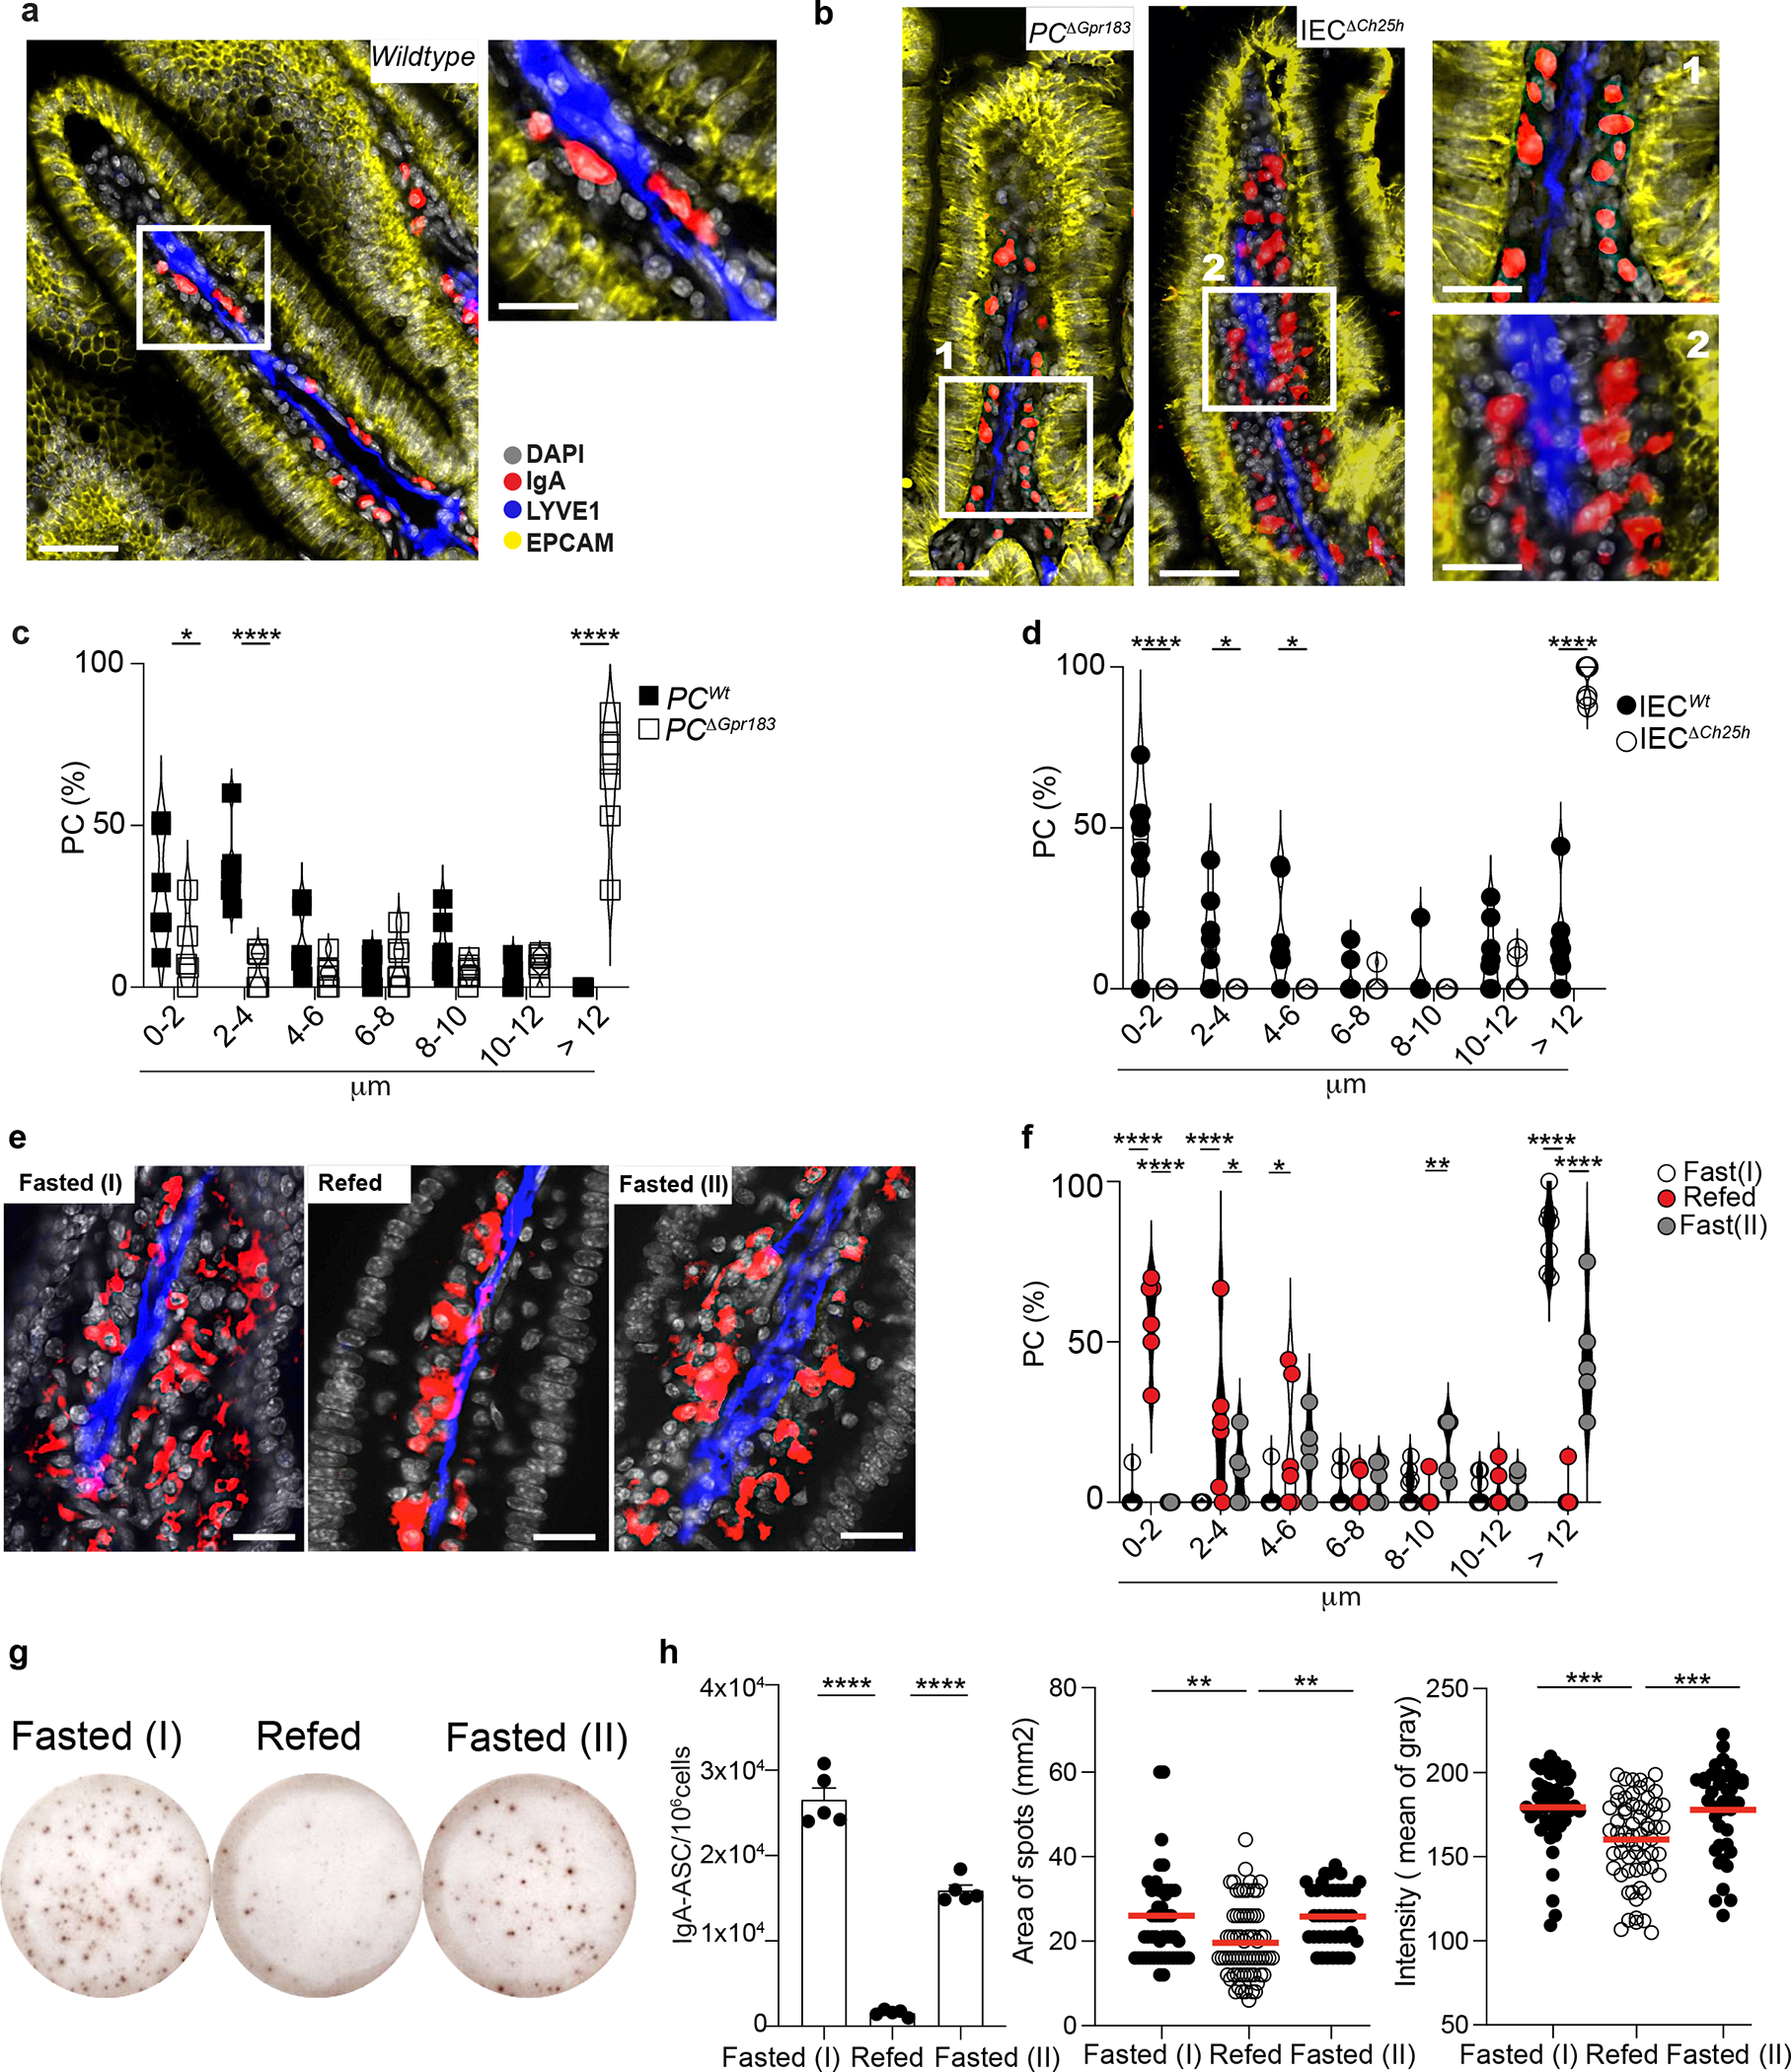
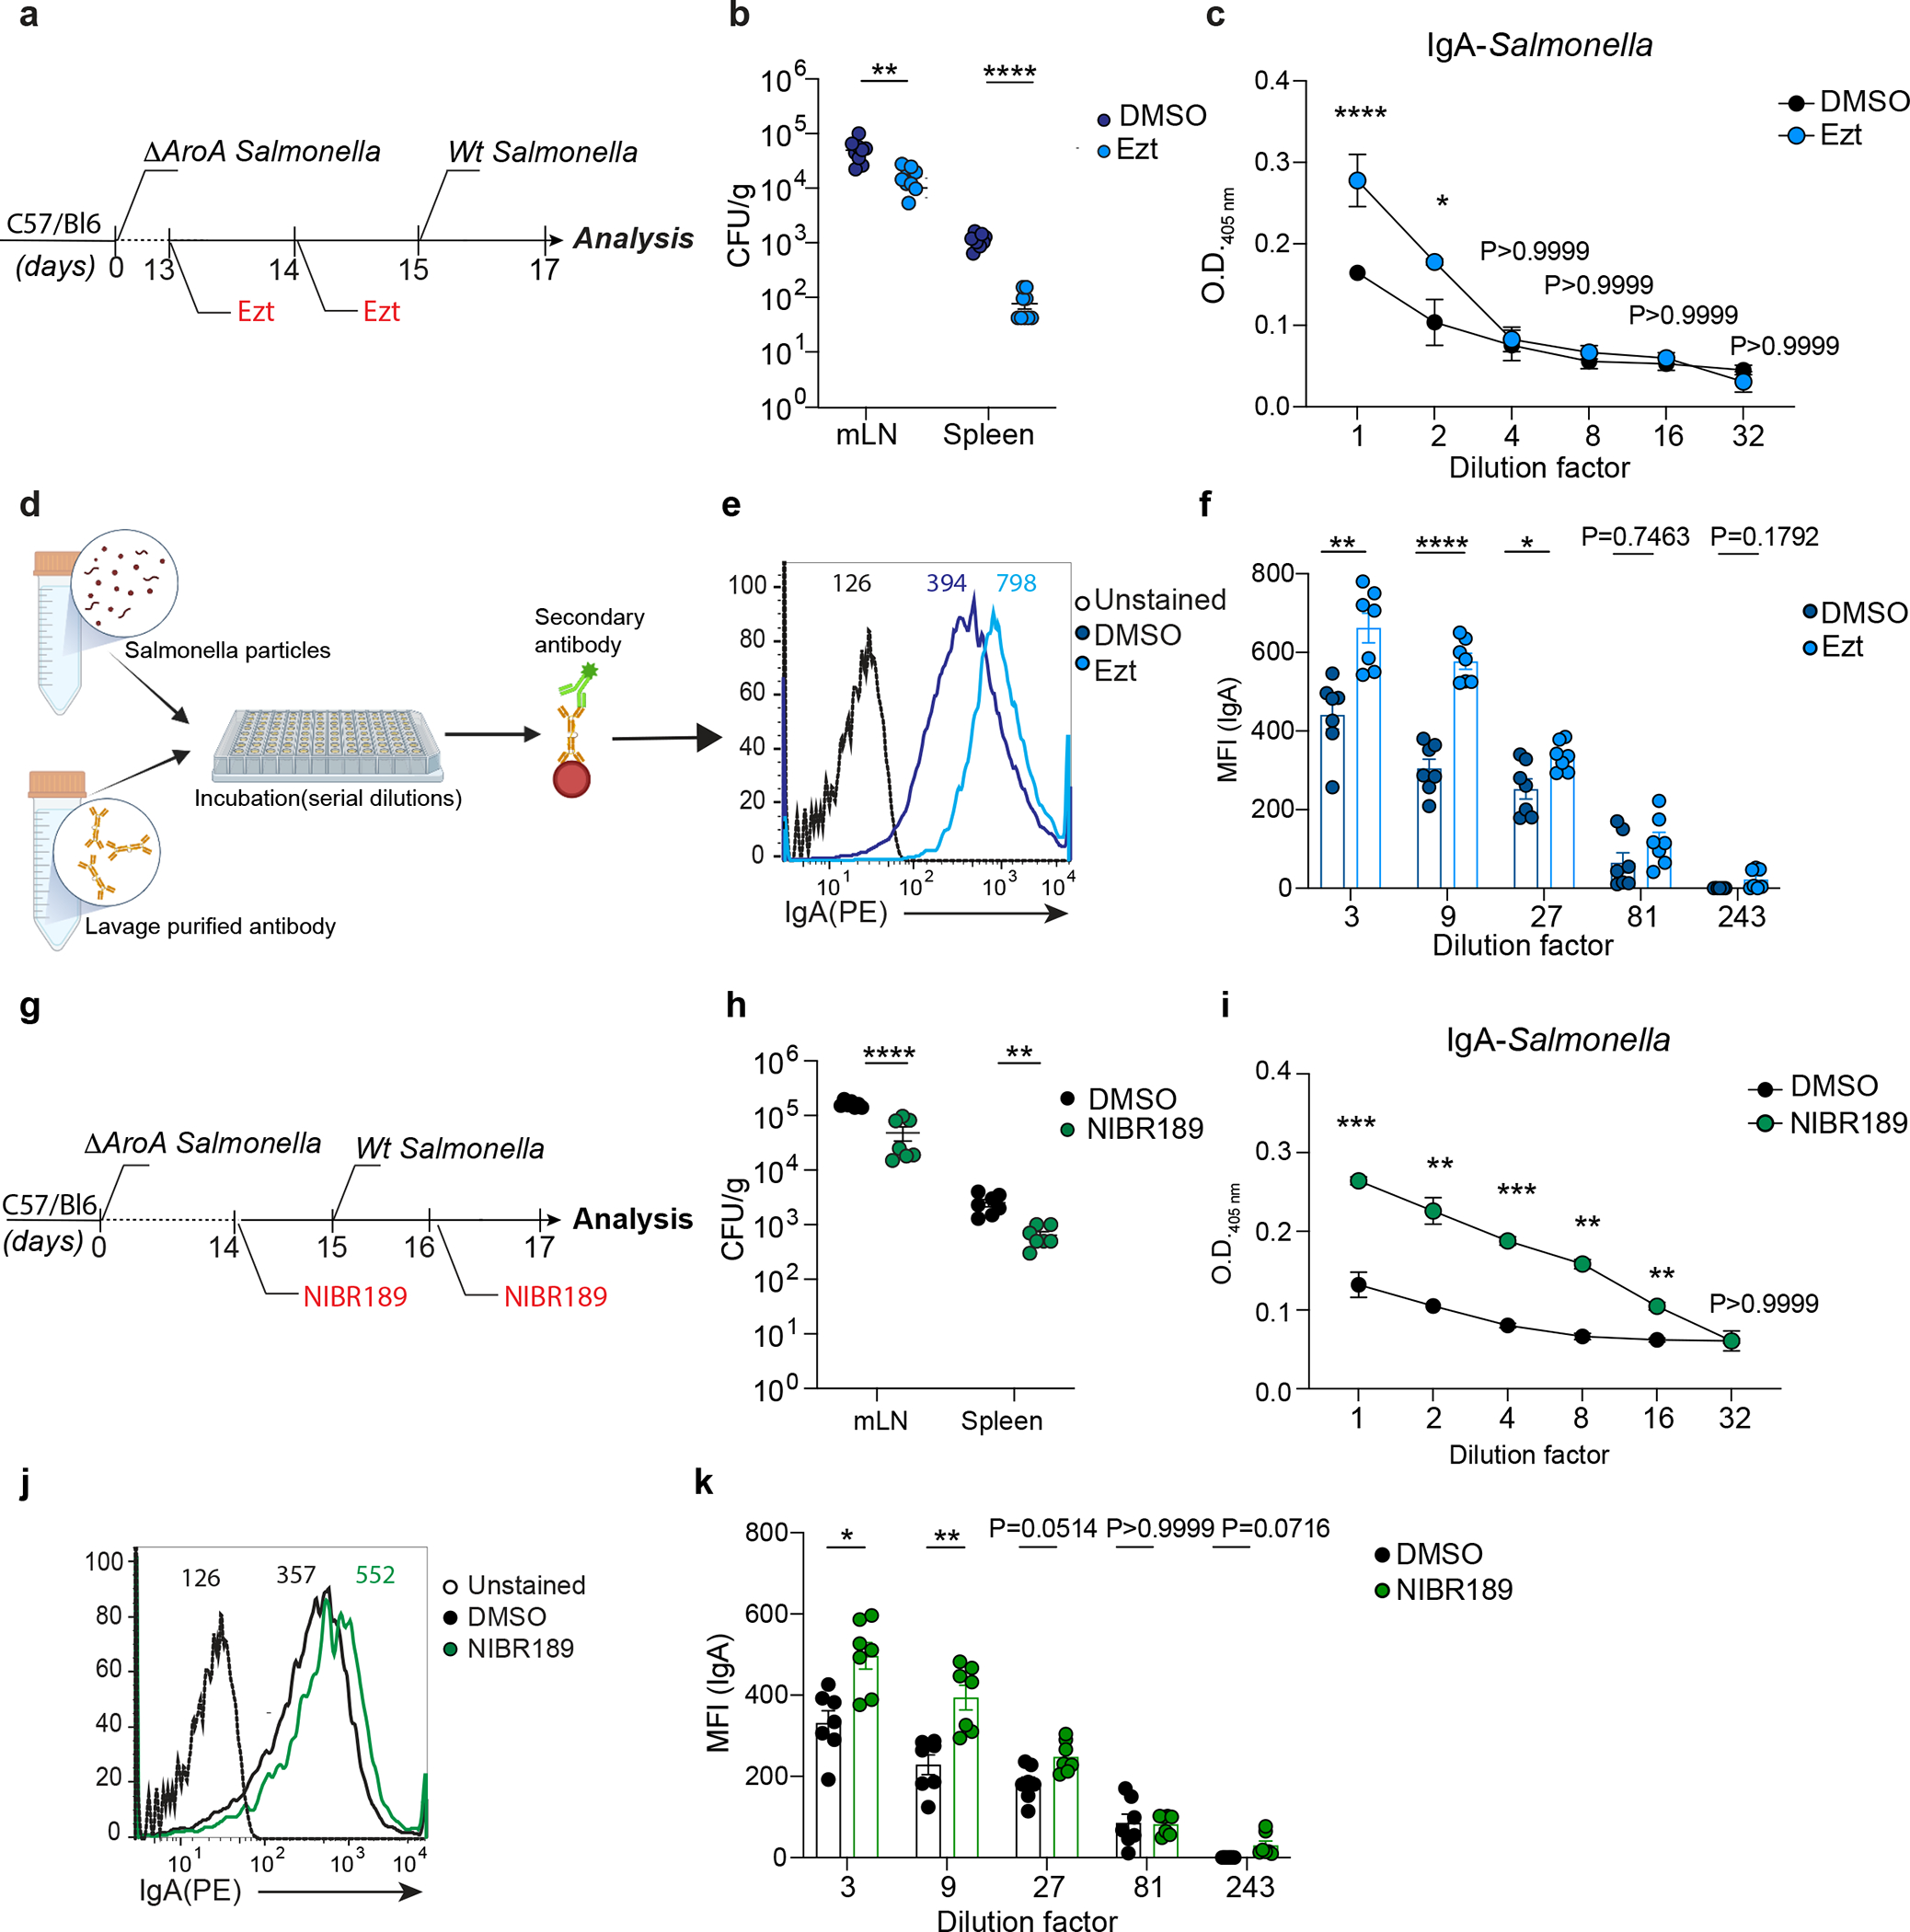
Immunoglobulin A (IgA) secretion by plasma cells, terminally differentiated B cells residing in the intestinal lamina propria, assures microbiome homeostasis and protects the host against enteric infections. Exposure to diet-derived and commensal-derived signals provides immune cells with organizing cues that instruct their effector function and dynamically shape intestinal immune responses at the mucosal barrier. Recent data have described metabolic and microbial inputs controlling T cell and innate lymphoid cell activation in the gut; however, whether IgA-secreting lamina propria plasma cells are tuned by local stimuli is completely unknown. Although antibody secretion is considered to be imprinted during B cell differentiation and therefore largely unaffected by environmental changes, a rapid modulation of IgA levels in response to intestinal fluctuations might be beneficial to the host. In the present study, we showed that dietary cholesterol absorption and commensal recognition by duodenal intestinal epithelial cells lead to the production of oxysterols, evolutionarily conserved lipids with immunomodulatory functions. Using conditional cholesterol 25-hydroxylase deleter mouse line we demonstrated that 7α,25-dihydroxycholesterol from epithelial cells is critical to restrain IgA secretion against commensal- and pathogen-derived antigens in the gut. Intestinal plasma cells sense oxysterols via the chemoattractant receptor GPR183 and couple their tissue positioning with IgA secretion. Our findings revealed a new mechanism linking dietary cholesterol and humoral immune responses centered around plasma cell localization for efficient mucosal protection.


Conflict of interest statement

Competing interests

The authors declare no competing interests

Figures

Extended data Fig. 1:
Extended data Fig. 1:. 7α,25-HC production is mainly restricted to the duodenum.
a, Ch25h and Cyp7b1 mRNA expression (A.U.) in duodenum and ileum of C57BL/6 mice. b, 7α,25-HC reduction in bile acids precursor (4-cholestern-7α,25-ol-3-one) by HSD3B7. c, Hsd3b7 mRNA expression (A.U.) in duodenum and ileum of C57BL/6 mice. d, Relative migration of GPR183+ cells with tissue lipid extracts from duodenum and ileum. e, mRNA quantification of Ch25h, Cyp7b1, Hsd3b7 in IECs and LP of C57BL/6 mice. f, Representative flow cytometry plot and number of GPR183+ cells migrating upon exposure to lipid extracts from duodenal and ileal IECs and lamina propria used in Figure 1c,d. g, Schematic depiction of in vitro 25-HC quantification strategy. The results were pooled from three independent experiments (a,c,d and e)(n=5 mice per group). Statistics were measured as two-sided unpaired Student’s t-test (*p<0.05,**p<0.01,***p<0.001) in (a,c,d and e) with Bonferroni’s correction. Exact P values and adjustments are provided in Source data.The error bars represent the mean ± s.e.m.
Extended data Fig. 2:
Extended data Fig. 2:. Inhibition of chylomicron production reduces 7α,25-HC, but not 25-HC, in the lymph.
a, Quantification of GPR183 ligand (Lipid) and precursors (LipidHsd3b7+Cyp7b1) in lymph of mice treated for 24 hours with NF or HCF. b, Representative staining of lipids by Oil Red O and Hematoxylin counterstaining of 7μm duodenum section from mice treated with 3% of PL81 (vol/vol) or vehicle (saline). Scale bar is 100μm. c, Plasma of mice untreated (red-clear apparency) or treated (milky apparency) with Poloxamer 407 to prevent chylomicrons clearance. d, M12 migration assay with lipid extracts (GPR183 ligand) from lymph and plasma of mice upon Poloxamer 407 or saline treatment. e, Triglycerides (TG) quantification in chylomicron and non-chylomicron fractions isolated from human plasma at the indicated time after exposure to lipid-based meal. The results were pooled from three independent experiments (a and d)(n=5 mice per group); (e)(n=3 biologically independent samples). Statistics were measured as two-sided unpaired Student’s t-test (***p<0.001,****p<0.0001) in (a,d) and two-way ANOVA with Bonferroni’s correction (***p<0.001, ****p<0.0001) in (e). Exact P values and adjustments are provided in Source data. The error bars represent the mean ± s.e.m.
Extended data Fig. 3:
Extended data Fig. 3:. 25-HC pathway controls duodenum IgA secretion.
a, Quantification of Ch25h mRNA by RT-qPCR in intestinal epithelial cells from VillincreCh25hfl/fl (IECΔCh25h) and littermate controls (IECWt). b, Western blot of CH25H (~31.74KDa), EPCAM (~40KDa) and β-ACTIN (~42KDa) quantification in IECs of IECΔCh25h and IECWt mice. Samples derived from the same experiment and gel were processed in parallel. c, Area and intensity quantification of IgA+ spots from lamina propria of IECWt and IECΔCh25h mice treated with normal food (NF) or 2% of cholesterol food (HCF). Each dot represents single IgA+spot. d, Tamoxifen inducible knockout model of Ch25h in IECs, upon restriction of PCs circulation by i.p. injection of 100 μg of anti-MadCam. e, Quantification of Ch25h mRNA by RT-qPCR in intestinal epithelial cells from IECΔCh25h and littermate controls (IECWt) two days after tamoxifen injection. f, Representative IgA ELISPOT and compiled data of duodenum and (g) ileum lamina propria cells from IECWt and IECiΔCh25h mice after Tamoxifen treatment. The results were pooled from three independent experiments (a)(n=5–6 mice per group); (b)(n=3 independent samples per group); (c)(n=76–114 cells per group); (e)(n=5 mice per group); (g)(n=7 mice per group) and two independent experiments (f)(n=4 mice per group). Statistics were calculated with two-sided unpaired Student’s t-test (***P<0.001) in (a,f,g), two-way ANOVA (****P<0.0001,***P<0.001,**P<0.01,*P<0.05) in (c) and one-way ANOVA with Bonferroni correction (*p<0.05, ***p<0.001, ****P<0.0001) in (e). Exact P values and adjustments are provided in Source data. The error bars represent the mean ± s.e.m.
Extended data Fig. 4:
Extended data Fig. 4:. Inhibition of cholesterol uptake, but not cholesterol biosynthesis, controls duodenum IgA secretion.
a, Representative IgA ELISPOT and compiled data of duodenum lamina propria of mice treated with 10mg/kg (body weight) of EZT or 20mg/kg (body weight) of Mevastatin or Vehicle (DMSO) for 24hours. b, Area and intensity quantification of IgA+ spots from lamina propria of IECWt and IECΔCh25h mice treated with EZT or DMSO as in Figure 2f. Each dot represents single IgA+spot. c, Total number of PCs measured by flow cytometry and gated on B220 IgA+ cells in duodenal lamina propria of IECWt and IECΔCh25h mice treated with NF, HCF or EZT. d, Representative IgA ELISPOT of bone marrow of IECWt and IECΔCh25h mice treated with EZT or DMSO. e, Analysis of total microbiome populations in luminal small intestine of IECWt and IECiΔCh25h mice by 16S. The results were pooled from three independent experiments (a)(n=5 mice per group); (b)(n=104–117 cells per group); (c)(n=4–7 mice per group); (d)(n=6 mice per group); (e)(n=3 mice per group). Statistics were calculated with two-sided unpaired Student’s t-test (***P<0.001) in (c,d), two-way ANOVA (****P<0.0001,***P<0.001,**P<0.01,*P<0.05) in (b) and one-way ANOVA with Bonferroni’s correction (*p<0.05, ***p<0.001, ****P<0.0001) in (a). Exact P values and adjustments are provided in Source data. The error bars represent the mean ± s.e.m.
Extended data Fig. 5:
Extended data Fig. 5:. Lack of Ch25h in IECs and cholesterol uptake inhibition control CD98 expression IgA secreting plasma cells in the duodenum.
a, Number of CD98hi and CD98lo PCs and total IgA+PC in lamina propria of mice treated with 10mg/kg (body weight) of EZT or vehicle and euthanized 24 hours later. b, Representative flow cytometry and frequency and total number of IgA+ PCs in the ileum of IECWt and IECCh25h mice (c). d, Representative flow cytometry and compiled quantification of frequency and total number of IgA+ PCs in the ileum of mice treated for 24 hours with NF, HCF and EZT (e). f, Representative flow cytometry and frequency of IgA+PCs in duodenum lamina propria of mice treated with EZT or Mevastatin or vehicle and euthanized 24 hours later. g, Flow cytometry and frequency of IgA+ PCs in BM of mice treated with EZT and Mevastatin as in (f). The results are pooled from three independent experiments (a)(n=5 mice per group); (b and c)(n=7 mice per group) and two independent experiments in (d,e,f and g)(n=4 mice per group). Statistics were measured as two-sided unpaired Student’s t-test (**p<0.01,***p<0.001) in (a,b and c) and one-way ANOVA with Bonferroni’s correction (***p<0.001) in (d,e,f and g). Exact P values and adjustments are provided in Source data.The error bars represent the mean ± s.e.m.
Extended data Fig. 6:
Extended data Fig. 6:. Ch25h-expressing epithelial cells restrain BLIMP1 upregulation and antigen-specific mucosal response in intestinal plasma cells.
a, IgA ELISA of intestinal lavages from wild type mice treated for two consecutive days with BTZ and injected with GFP+ cells (1×10⁶). Intestinal lavages were collected at the indicated days after BTZ injection. b, Experimental model of BTZ treatment and adoptive transfer of 1×10⁶ cells from lamina propria of IgMa mice treated 10 days with antibiotics (AVNM) or PBS into IgMb mice. c, Representative IgAb Elispot of LP PCs and CD98hiIgA+ PCs frequency from mice treated as (b). d, Experimental model of BTZ treatment and adoptive transfer of 1×10⁶ cells from lamina propria of Prdm1YFP+ reporter mouse into IECWt and I IECΔCh25h mice. e, Representative flow cytometry plot and compiled quantification of BLIMP1+ PCs in bone marrow of IECWt and IECΔCh25h mice treated as in (d). f, Area and intensity quantification of IgA+ spots from lamina propria of IECWt and IECΔCh25h mice treated with BTZ and injected with lamina propria cells from mice infected with non-replicative ΔAroA Salmonella Typhimurium. Each dot represents single IgA+spot. g, Salmonella-specific IgA ELISPOT in bone marrow and spleen of mice treated as in Figure 4J. The results are pooled from two independent experiments (a)(n=2 mice per group) and three independent experiments (c,e and g)(n=4–6 mice per group). Statistics were measured as two-sided unpaired Student’s t-test (**p<0.01; ***p<0.001; ****p<0.0001) in (a,c,e,f and g). Exact P values and adjustments are provided in Source data.The error bars represent the mean ± s.e.m.
Extended data Fig. 7:
Extended data Fig. 7:. Sensing of GPR183 ligand in plasma cells depends on intestinal lipoprotein lipase activity.
a, Representative flow cytometry plot and compile frequency of secreting IgA+ PCs (CD98hiIgA+) in mice treated for 24 hours with a lipoprotein lipases (LPL) inhibitor, Orlistat, or DMSO. b, GPR183 ligand quantification in lamina propria, lymph and plasma of mice treated for two consecutive days with 50mg/kg (body weight) of Orlistat. c, Quantification of LPL activity by fluorometric assay in duodenum lamina propria of mice treated as in (a and b). d, Illustration of the mechanism regulating 7α,25-HC trafficking from IECs to lamina propria. IEC-produced chylomicrons enter the intestinal lacteal and reach the lamina propria by LPL-mediated degradation or travel versus lymphoid organs (Created with Biorender.com). e-f, Quantification of PC distance from lymphatics in the indicated mice used in Fig.1c and Fig.1d. Each dot represents a single PC. g, Representative immunofluorescence of IgA+PCs, lymphatics and DAPI in ileum sections from wild type and IECΔCh25h mice used in Figure 6a,b and d. Scale bar is 100 μm. h, Quantification of PC frequency at the indicated distance from lymphatics. Each dot represents the average of PCs distance measured in sections from n=4 mice per each treatment. i, Quantification of PCs distance from lymphatics in section of ileum from wild type and IECΔCh25h mice. Each dot represents a single PC. j, Frequency of α chainCD103 (αE) in CD98lo and CD98hi cells from duodenum of IECWt and IECΔCh25hmice used in Fig. 6a,b and d. The results were pooled from three independent experiments (a and b)(n=6–7 mice per group); (e and f)( n=136–210 cells); (h and i)( n=4 mice per group and n=90–97 cells (i)) and two independent experiments (c and i)(n=3–4 mice per group). Statistics were calculated with two-sided unpaired Student’s t-test (**P<0.01,***p<0.001,****P< .0001) in (a,b,c,e,f, h and i) and two-way ANOVA with Bonferroni’s correction (*p<0.05, ***p<0.001, ****p<0.0001) in (j). Exact P values are provided in Source data. The error bars represent the mean ± s.e.m.
Extended data Fig. 8:
Extended data Fig. 8:. Diet-derived oxysterols shape spatial localization of IgA+ plasma cells in lamina propria
a, Representative immunofluorescence of duodenum sections from mice treated for 24 hrs with NF, HCF and VF. b, Quantification of PC frequency at the indicated distance from lymphatics (LYVE1+) in duodenum of mice treated as in (a). Each dot represents the average of PCs distance measured from n=6 mice per each treatment. c, Quantification of PCs distance from lymphatics in mice treated with the indicated food changes. Each dot represents a single PC. d, Representative IgA ELISPOT and compiled data from duodenum of untreated or fasted mice for 12 hours. e, Frequency of IgA+CD98hi cells analyzed by flow cytometry in LP of mice fasted for 12hrs, or untreated. The results were pooled from three experiments (a,b and c)(n=7 mice per group and n=50–145 cells (c)) and two independent experiments (d,e)(n=3–5 mice per group). Statistics were calculated with two-way ANOVA with Bonferroni’s correction (*p<0.05, **p<0.01,***p<0.001, ****p<0.0001) in (b and c) and two-sided unpaired Student’s t-test (**P<0.01,****P<0.0001) in (d and e). Exact P values are provided in Source data. The error bars represent the mean ± s.e.m.
Extended data Fig. 9:
Extended data Fig. 9:. Modulation of intestinal oxysterol concentration shapes intestinal plasma cell positioning.
a, Quantification of PC distance from lymphatics in mice treated with the indicated food changes. Each dot represents a single PC. b, M12 migration assay with lipid extracts from IECs of mice fasted for 12hrs, refed once with HCF and harvested after 3 or 12 hrs. c, Representative immunofluorescence and frequency of IgA+ PCs at certain distance to lymphatics in duodenum of mice treated with 3% of Pluronic81 (PL81)(vol/vol), 10mg/kg (body weight) of Ezetimibe (Ezt), 50mg/kg (body weight) of Orlistat or vehicle (saline or DMSO). Each dot represents the average of PCs distance measured in a total of n=7 mice per each treatment or (d) single PCs. Scale bar is 50 μm. The results are pooled from three independent experiments (a)(n=49–85 cells per group); (b)(n=7 mice per group); (c and d)(n=7–11 mice per group). Statistics were measured by two-way ANOVA Bonferroni’s correction (*p<0.05, **p<0.01, ***p<0.001, ****p<0.0001) in (a and b) or two-sided unpaired Student’s t-test (**p<0.01, ***p<0.001) in (c and d). Exact P values and adjustments are provided in Source data. The error bars represent the mean ± s.e.m.
Extended data Fig. 10:
Extended data Fig. 10:. GPR183 pharmacological inhibition shapes plasma cell dynamics and antigen-specific response.
a, Relative migration of lamina propria PCs from NIBR189 or vehicle (DMSO) treated mice and with the indicated concentration of GPR183L. b, Representative immunofluorescence of duodenum sections from mice treated twice with GPR183 inhibitor, NIBR189, or vehicle (DMSO).Scale bar is 50μm. c, Quantification of IgA+PCs frequency at certain distance from lymphatics (LYVE1+) showed as violin plot. Each dot represents the average of PCs frequency at the indicated range of n=7 mice per each treatment. d, Quantification of PCs distance from lymphatics upon GPR183 inhibition. Each dot represents a single PC. The results were pooled from two independent experiments (a)(n=3 mice pre group) and three independent experiments (b,c and d) (n=7 mice per group or n=62 cells (d)). Statistics were measured as two-sided unpaired Student’s t-test (***p<0.001,****p<0.0001) in (a,c and d). Exact P values and adjustments are provided in Source data. The error bars represent the mean ± s.e.m.
Figure 1:
Figure 1:. Intestinal epithelial cells integrate microbial and dietary cues to produce oxysterols for chylomicrons packaging and lymphatic secretion.
a, 7α,25-HC biosynthetic pathway from cholesterol. b, Representative flow cytometry plot and number of GPR183+ M12 cells migrating upon exposure to lipids extracts from duodenum and ileum tissue. The relative migration (A.U) was measured and plotted as ratio between number of migrating GFP+ M12 cells and number of migrating GFP- M12 cells and normalized to migration toward lipid free migration media (Nil). 100nM of 7α,25-HC was used as positive control for the migration assay. c,d, Summary data of 7α,25-HC (Lipid) and 25-HC (LipidHsd3b7+Cyp7b1) quantification in IECs and lamina propria (LP) of duodenum and ileum from C57Bl/6 mice (d). e, M12 migration assay of IEC lipids from Ch25h−/− and LMC mice. f, M12 migration assay of IEC lipids from germ free (GF) and specific pathogen free (SPF) MyD88−/− mice and littermate controls. g, M12 migration assay with lipids from IECs of VillincreMyD88fl/fl and LTC mice. h, Relative quantification of 7α,25-HC and 25-HC in IECs from wild type mice fed for 24 hours with normal food (NF), food with 2% of cholesterol (HCF) and vegetarian food (VF). i, Schematic representation of the pharmacological activity of Ezetimibe (Ezt) and Mevastatin (Meva) in IECs (Created with Biorender.com). j, M12 migration assay with lipids from IECs of mice treated for 24hrs with 10mg/kg (body weight) of Ezetimibe (Ezt), 20 mg/kg (body weight) of Mevastatin (Meva) or vehicle (DMSO). k, M12 migration assay with 7α,25-HC from IECs, lamina propria (LP) and Lymph of mice treated with 3% of Pluronic81(PL81) in NF condition or (l) HCF (vol/vol). m, M12 migration assay with human plasma from healthy patients upon exposure to lipid-based meal. Plasma was separated into chylomicron and non-chylomicron fractions and analyzed at the indicated time point. The results were pooled from three experiments (c,d,e,f and g)(n=3–4 mice per group); (h,j,k and l)(n=5 mice per group) and two independent experiments (m)(n=3 biologically independent samples). Statistics were measured by two-way ANOVA with Bonferroni’s correction (*p<0.05, **p<0.01,***p<0.001, ****p<0.0001) in (c,d,f,h and m) and two-sided unpaired Student’s t-test (e,g,j,k and l). Exact P values and adjustments are provided in Source data. The error bars represent the mean ± s.e.m.
Figure 2:
Figure 2:. Diet-dependent, IEC-derived oxysterols modulate IgA secretion in the small intestine.
a, M12 migration assay with lipid extracts of IECs from VillincreCh25hfl/fl (IECΔCh25h) and littermate controls (IECWt) treated with NF and 2% of cholesterol diet (HCF). b, Relative 7α,25-HC and 25-HC quantification (c) in lamina propria (LP) and Lymph of IECΔCh25h and littermate mice upon NF and 2% HCF. d, Representative IgA ELISPOT and compiled quantification of IgA secreting PCs in lamina propria of IECWt and IECΔCh25h mice fed for 1 week with NF or HCF. e, ELISA of IgA in intestinal lavages and serum of IECWt and IECΔCh25h mice treated as in (d). f, Representative IgA ELISPOT and compiled quantification of IgA secreting PCs in lamina propria of IECΔCh25h and littermate control mice treated with 10 mg/kg of Ezetimibe (EZT) or vehicle (DMSO) for 24 hours. g, Analysis of the IgA+coated and non-coated commensal bacteria in the intestinal lumen of IECWt and IECΔCh25h mice by 16S rRNAseq. The results are pooled from three independent experiments (a,b,c)(n=8–12 mice per group); (d)(n=7–8 mice per group);(g)(n=3 mice per group) and two independent experiments (e,f)(n=5 mice per group). Statistic were measured with two-way ANOVA with Bonferroni’s correction (*p<0.05, **p<0.01, ***p<0.001, ****p<0.0001) in (a,b,c,d and e) and two-sided unpaired Student’s t-test (****p<0.0001) in (f). Exact P values and adjustments are provided in Source data. The error bars represent the mean ± s.e.m.
Figure 3:
Figure 3:. Intestinal IgA plasma cells have discrete secretory capacity that segregates with CD98 expression.
a, Representative sorting strategy for CD98 and BLIMP1 expressing PC cells and (b) quantification of IgA secreting cells by ELISPOT (b). c, ELISPOT of CD98hi and CD98lo sorted cells and treated for 3 hours with media or ER stress inductors, 0.5mM of DTT and 1 μg/mL of Tunicamycin. d, Representative flow cytometry and compiled data of lamina propria PCs in Prdm1YFP reporter mice gavage once with 10 mg/kg of Ezetimibe (Ezt+HCF) or vehicle (DMSO+HCF) and euthanized 24 hours later. Secreting PCs were gated as B220-, TCRβ-, YFP+ and CD98hi or CD98lo expressing cells. e, Representative flow cytometry of CD98hiIgA+ PCs frequency pre-gated on B220- cells in duodenal lamina propria of IECWt and IECΔCh25h mice treated with NF, HCF or 10 mg/kg Ezt. f-g, Compiled data of (e). The results are pooled from three independent experiments (b)(n=5 mice per group); (c)(n=3 mice); (d)(n=5–6 mice per group); (f)(n=7 mice per group) and two independent experiments (g)(n=4 mice per group). Statistics were measured with two-sided unpaired Student’s t-test (**P<0.01, ***p<0.001, ****P<0.0001) in (d,f and g) and one-way ANOVA with Bonferroni’s correction (****p<0.0001) in (b and c). Exact P values and adjustments are provided in Source data. The error bars represent the mean ± s.e.m.
Figure 4:
Figure 4:. IEC-derived oxysterols restrain Blimp-1 upregulation and antigen-specific IgA response.
a, Experimental model of in vivo Bortezomib (BTZ) treatment and adoptive transfer of 1×10⁶ cells from lamina propria of B6-GFP mice into IECWt and IECΔCh25h mice. b, Representative frequency and compiled quantification of adoptively transferred GFP+ cells in duodenum and bone marrow of wildtype mice. c, Representative immunofluorescence of IgA+PCs in duodenum of C57BL/6 mouse previously treated with BTZ and systemically injected with lamina propria GFP+ cells. Bar is 50μm. d, Frequency of donor (GFP+) and host (GFP-) IgA+ cells in lamina propria of mice treated with BTZ and analyzed at 2,5 and 7 days after the adoptive transfer of GFP+ cells. e, Representative flow cytometry plot of IgA, GFP and CD98 cells in duodenum from IECWt and IECΔCh25h mice treated as in (a) and compiled data (f and g). The red dashed line indicates values in the nil mouse. h, Representative flow cytometry plot and compiled quantification of Prdm1YFP+ PCs adoptively transferred in BTZ-treated IECΔCh25h and littermate control (for experiment details see Extended Data Fig. 6d). i, Representative IgAa ELISPOT and compiled quantification of secreting PCs in lamina propria of IECΔCh25h and IECWt treated with BTZ and injected with lamina propria cells from IgMa mice. j, Experimental model of BTZ treatment and adoptive transfer of 1×10⁶ cells from lamina propria of mice infected with three doses of non-replicative ΔAroA Salmonella Typhimurium into IECWt and IECΔCh25h mice. k, Representative ELISPOT of Salmonella-specific IgA with lamina propria PCs from mice treated as in (j). The results were pooled from three independent experiments (b)(total n=6 mice); (f,g and h)(n=5 mice per group); (k)(n=6 mice per group) and two independent experiments (d)(n=3 biologically independent mice). Statistics were calculated with two-sided unpaired Student’s t-test (**P<0.01, ***P<0.001, ****P<0.0001) in (b,f,g,h,i and k) and one-way ANOVA in (d)(**P<0.01, ***p<0.0005) with Bonferroni’s correction. Exact P values and adjustments are provided in Source data. The error bars represent the mean ± s.e.m.
Figure 5:
Figure 5:. Intestinal plasma cells express GPR183 and migrate in response to 7α,25-HC.
a, Immunofluorescence of IgA, GPR183, LYVE1 and DAPI on duodenum sections from a Gpr183GFP/+ reporter mouse. Scale bar is 100μm. b, Frequency of GPR183 in lamina propria of Gpr183GFP/+ reporter mouse measured by flow cytometry. c, Relative migration of lamina propria plasma cell and CD45+ in response to different concentrations of 7α,25-HC. d, Relative migration of lamina propria PCΔGpr183 and wild type at the indicated concentration of GPR183 ligand. Number of migrated cells were analyzed by flow cytometry and the relative migration was measured as fold of changes. e, Representative flow cytometry plot and percentage of IgA secreting PCs (CD98hiIgA+) in PCΔGpr183 and control mice, fed for one week with NF or HCF. f, Number of total IgA+ PC in duodenum of mice from (e). g, Representative IgA ELISPOT and compiled quantification of secreting IgA+ PCs from PCΔGpr183 and controls mice at steady state. h, Area and intensity quantification of IgA+ spots from (g). Each dot represents single IgA+spot. i, Experimental model illustrating the development of Tamoxifen inducible bone marrow (BM) retroviral chimera mice. BM cells from Rosa26-STOP-tdtomato Gpr183fl/fl and Rosa26-STOP-tdtomato Gpr183Wt were transduced with retroviral vector encoding for ERT2-cre. BM cells (10X106) were injected in irradiated C57/BL6 mice. j, 8 weeks after BM reconstitution mice were injected with Tamoxifen and 100μg of anti-MadCam1 for one week and euthanized for flow cytometry analysis of IgA+ PCs. CD98 PCs were previously gated on tdTomato+ cells. The results were pooled from three independent experiments (a and b)( n=6 mice); (c)(total of n=3 mice ); (d)(n=6mice for PCWt and n=3 mice for PCΔGpr183); (e)(n=5 mice for NF fed mice n=8 for HCF fed mice); (g)(n=5 mice per group); (h)(n=64–79 cells per group) and (j)(n=6 mice per group). Statistics were calculated with one-way ANOVA in (c,d)(****p<0.0001), two-way ANOVA in (f) and two-sided unpaired Student’s t-test (**p<0.01, ****p<0.0001) in (b,e,g,h and j) with Bonferroni correction. Exact P values and adjustments are provided in Source data. The error bars represent the mean ± s.e.m.
Figure 6:
Figure 6:. Diet-derived oxysterols control spatial localization of intestinal IgA+ plasma cells via GPR183.
a, Representative immunofluorescence of PCs (IgA+), lymphatics (LYVE1+) and IECs (EPCAM+) on duodenum sections from wild type mice. Scale bar is 100μm (left) and 50 μm (right). b, Representative immunofluorescence of PCs (IgA+), lymphatics (LYVE1+) and IECs (EPCAM+) in PCΔGpr183 and IECΔCh25h sections and compiled data (c,d). Scale bar is 100μm (left) and 50 μm (right). Each dot represents the average of PCs frequency at the indicated range of distance measured in a total of n=7 mice per each treatment. e, Representative immunofluorescence of PCs (IgA+), lymphatics (LYVE1+) and DAPI in duodenum sections of mice fasted for 12hrs, refed once with HCF and then harvested at 3 or 12 hrs post-HCF. Scale bar is 50 μm. f, Frequency of PCs at the indicated distance from lymphatics from mice in (e). Each dot represents the average of PCs frequency at the indicated range of distance measured in n=6 mice per each treatment. g, Representative IgA ELISPOT and number (h), area and intensity of IgA spots from lamina propria of fasted mice for 12 hours (I), refed with HCF and fasted again for 6 hours (II). The results were pooled from three independent experiments (a,b,c,d,e and f)(n=6–7 mice pre group) and 2 independent experiments (g and h)(n=5 mice per group or n=40–68 cells). Statistics were measured as two-sided unpaired Student’s t-test (*p<0.05, ****p<0.0001) with Bonferroni’s correction in (c and d), two-way ANOVA (*p<0.05, **p<0.01,***p<0.001, ****p<0.0001) in (f) and one-way ANOVA in (h) with Bonferroni’s correction. Exact P values and adjustments are provided in Source data. The error bars represent the mean ± s.e.m.
Figure 7:
Figure 7:. Cholesterol uptake and GPR183 inhibition enhance Salmonella-specific intestinal IgA response.
a, Experimental model illustrating the infection with ΔAroA Salmonella and after 2 weeks with Wt-Salmonella upon inhibition of cholesterol uptake by Ezt. b, Salmonella CFU quantification in the indicated organs from mice initially infected with non-invasive ΔAroA Salmonella, treated with Ezt or vehicle (DMSO) and challenge with a lethal dose of invasive Wt-Salmonella. c, ELISA for Salmonella-specific IgA quantification in intestinal lavages of mice treated with Ezt and infected with Salmonella (n=7). d, Diagrammatic representation of how a basic bacterial flow cytometry experiment is carried out with antibodies purified from intestinal lavages of mice orally infected with Salmonella. e, Representative flow cytometry (dilution 1:3) and compiled quantification (f) of Salmonella-specific binding IgA (MFI) in intestinal lavage of mice infected as in (a). g, Experimental model illustrating the infection with ΔAroA Salmonella and after 2 weeks with Wt-Salmonella in mice pretreated with the GPR183 agonist inverse, NIBR189 (Created with Biorender.com). h, CFU measurement of Salmonella in the indicated tissues harvested from mice infected as indicated in (g). i, ELISA of Salmonella-specific IgA in intestinal lavages of mice treated as in (g). j, Representative flow cytometry of Salmonella-specific binding IgA in intestinal lavages (dilution 1:3) of mice infected first with ΔAroA Salmonella and then with Wt-Salmonella upon NIBR189 treatment and compiled quantification of IgA (MFI)(k). The results were pooled from three independent experiments (b,f,h and k)(n=7 mice per group); (c)(n=4 mice per group); (i)( n=3 mice per group). Statistics were measured as two-sided unpaired Student’s t-test (*p<0.05,**p<0.01,***p<0.001,****p<0.0001)in (b,c,f,h,i and k). Exact P values and adjustments are provided in Source data. The error bars represent the mean ± s.e.m.

References

    1. Hand TW & Reboldi A Production and Function of Immunoglobulin A. Annual Review of Immunology 39, 695–718 (1AD). - PubMed
    1. Martinoli C, Chiavelli A & Rescigno M Entry Route of Salmonella typhimurium Directs the Type of Induced Immune Response. Immunity 27, 975–984 (2007). - PubMed
    1. Moor K et al. High-avidity IgA protects the intestine by enchaining growing bacteria. Nature 544, 498–502 (2017). - PubMed
    1. Fagarasan S et al. Critical Roles of Activation-Induced Cytidine Deaminase in the Homeostasis of Gut Flora. Science 298, 1424–1427 (2002). - PubMed
    1. Altmann SW et al. Niemann-Pick C1 Like 1 Protein Is Critical for Intestinal Cholesterol Absorption. Science 303, 1201–1204 (2004). - PubMed

Publication types

LinkOut - more resources