. 2023 Mar;24(3):545-557.
doi: 10.1038/s41590-022-01403-y. Epub 2023 Jan 19.

Human early-onset dementia caused by DAP12 deficiency reveals a unique signature of dysregulated microglia

Affiliations

Human early-onset dementia caused by DAP12 deficiency reveals a unique signature of dysregulated microglia

Yingyue Zhou et al. Nat Immunol. 2023 Mar.

Erratum in

Abstract

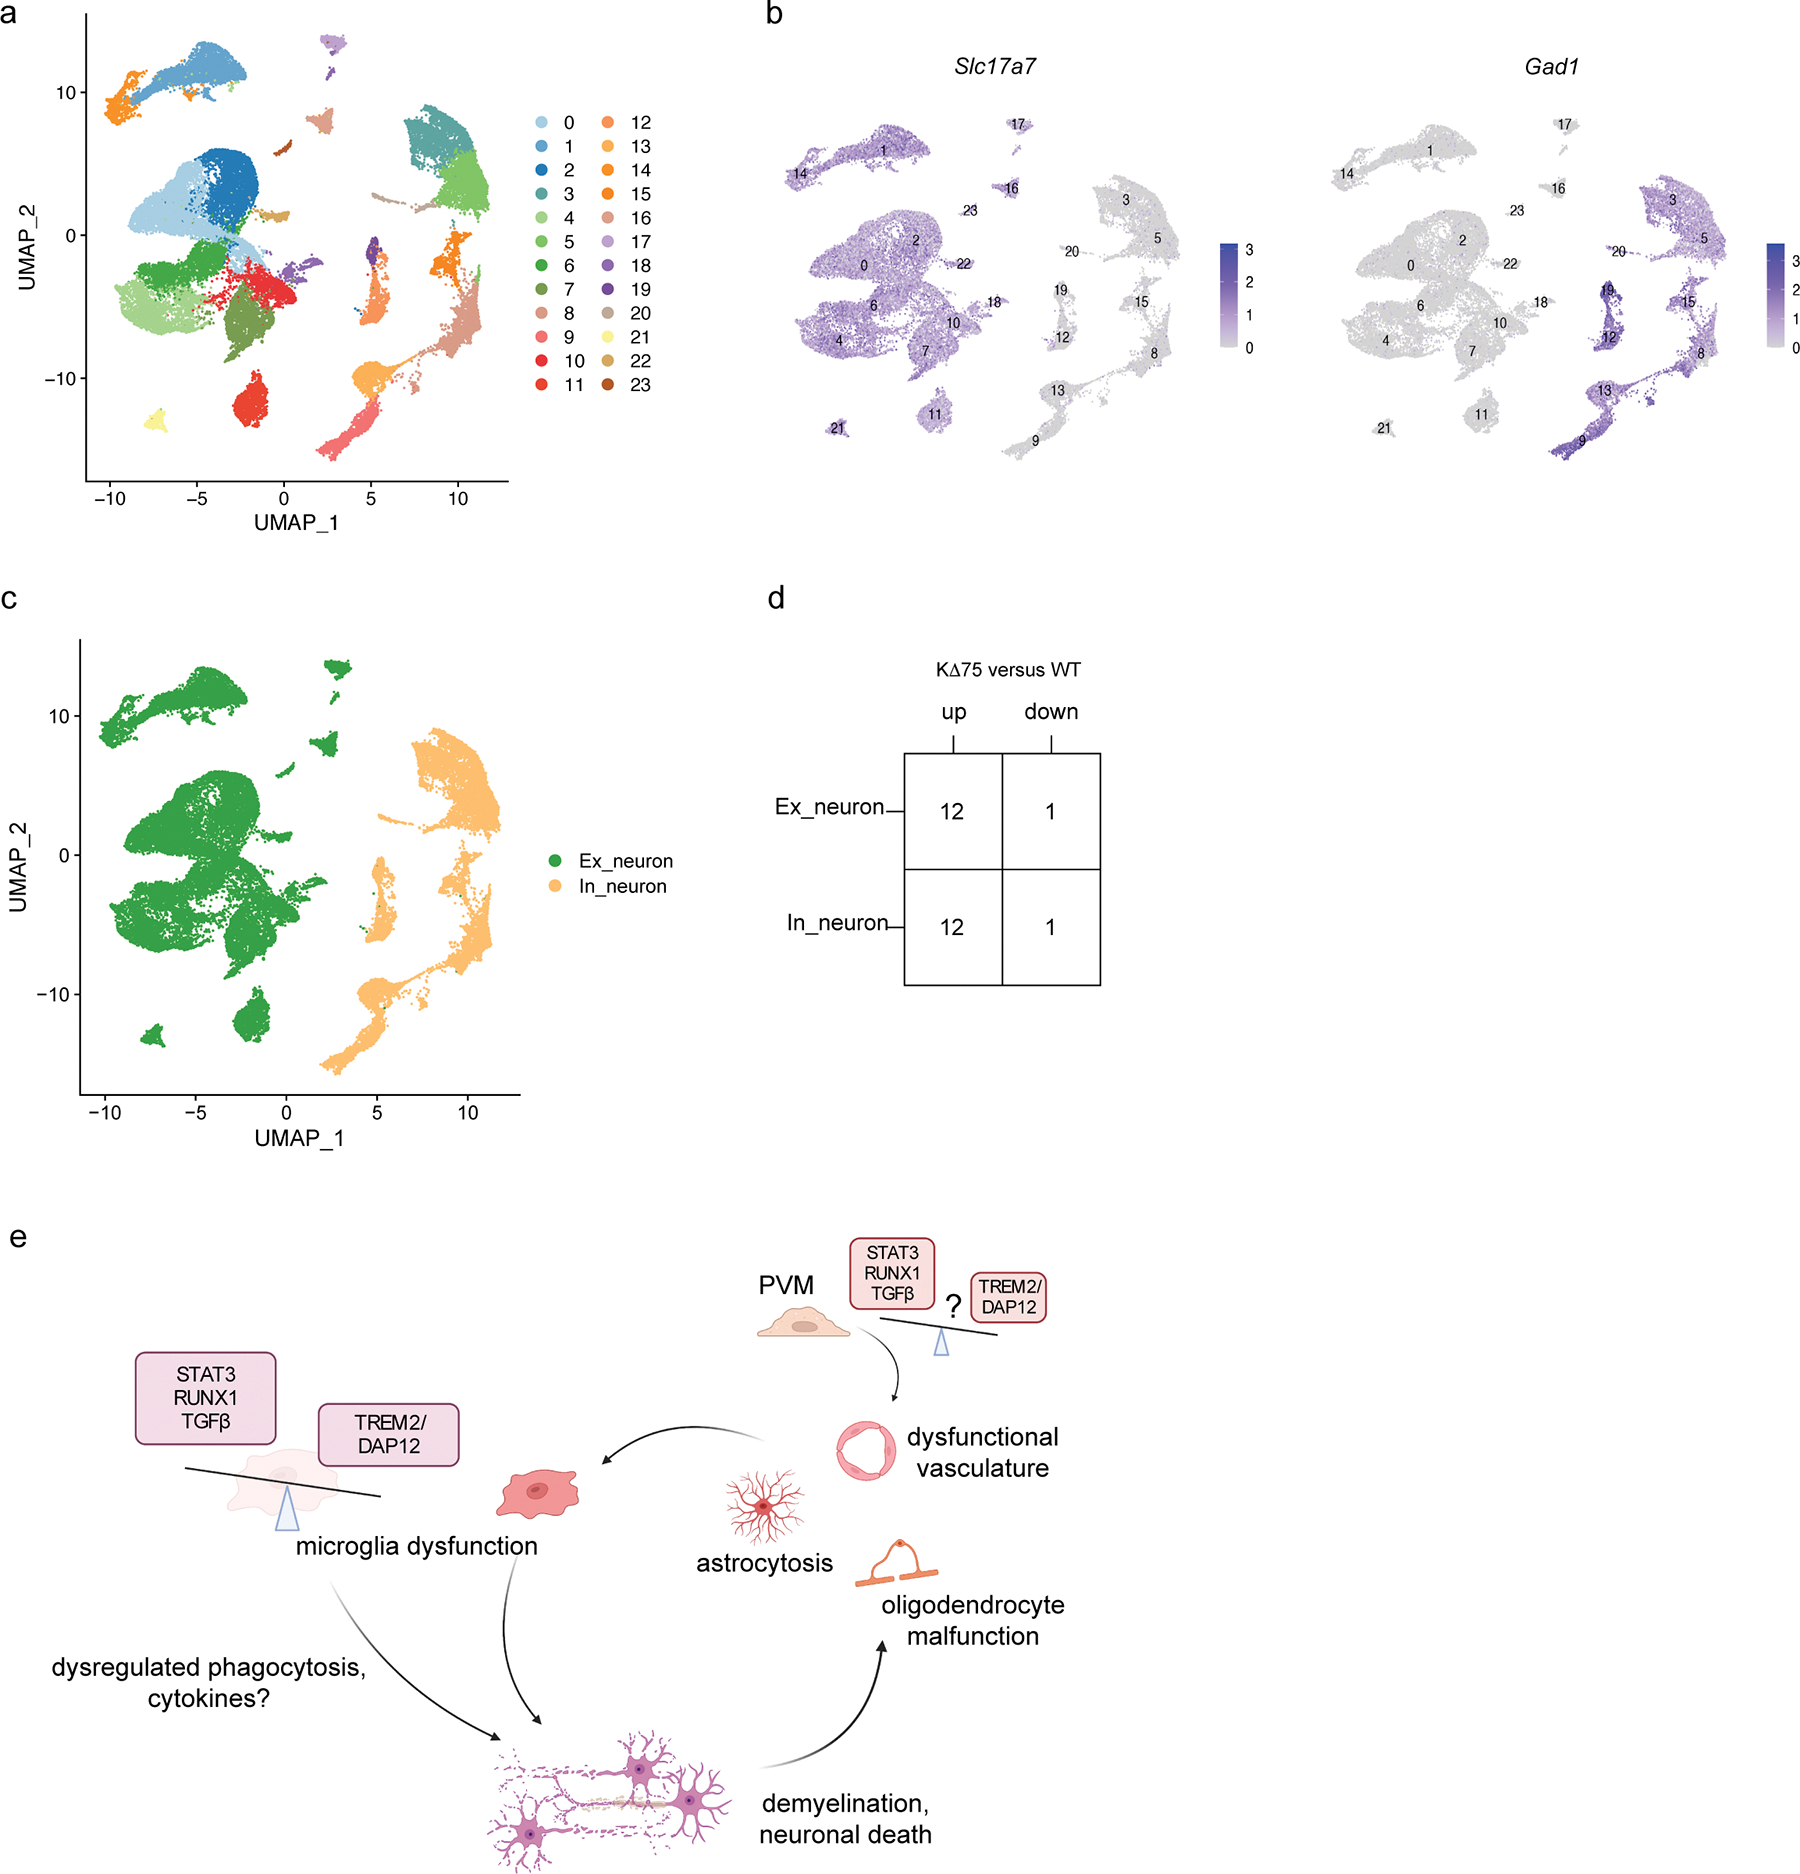
The TREM2-DAP12 receptor complex sustains microglia functions. Heterozygous hypofunctional TREM2 variants impair microglia, accelerating late-onset Alzheimer's disease. Homozygous inactivating variants of TREM2 or TYROBP-encoding DAP12 cause Nasu-Hakola disease (NHD), an early-onset dementia characterized by cerebral atrophy, myelin loss and gliosis. Mechanisms underpinning NHD are unknown. Here, single-nucleus RNA-sequencing analysis of brain specimens from DAP12-deficient NHD individuals revealed a unique microglia signature indicating heightened RUNX1, STAT3 and transforming growth factor-β signaling pathways that mediate repair responses to injuries. This profile correlated with a wound healing signature in astrocytes and impaired myelination in oligodendrocytes, while pericyte profiles indicated vascular abnormalities. Conversely, single-nuclei signatures in mice lacking DAP12 signaling reflected very mild microglial defects that did not recapitulate NHD. We envision that DAP12 signaling in microglia attenuates wound healing pathways that, if left unchecked, interfere with microglial physiological functions, causing pathology in human. The identification of a dysregulated NHD microglia signature sparks potential therapeutic strategies aimed at resetting microglia signaling pathways.


Conflict of interest statement

Competing Interests Statement

M.C. is a member of the Vigil Neuro scientific advisory board (SAB), is consultant for Cell Signaling Technology, has received research grants from Vigil Neuro during the conduct of the study and has a patent to TREM2 pending. The remaining authors declare no competing interests.

Figures

Extended Data Fig. 1
Extended Data Fig. 1. Cluster characterization of NHD and control samples.
a, UMAP plots of NHD and control samples before (left) and after (right) batch correction by Harmony. n=66,324 total nuclei; 11 control and 3 NHD individuals. b, Bar graphs of total nuclei number, median of number of genes and median of number of UMIs of each sample sequenced. c, Heatmap showing cell type markers. d, Nuclei frequency of all cell types in each sample.
Extended Data Fig. 2
Extended Data Fig. 2. Characterization of NHD microglia subclusters.
a, Pathways enriched in genes upregulated in NHD microglia compared to controls, using GSEA analysis (left, q value by FDR adjustment) or Metascape analysis (right, P value by hypergeometric distribution). b, PCA plot of NHD and control microglia demarcated by sex. c, Average expression of top DEGs (log2(Fold Change) > 0.5, FDR-adjusted P < 0.05, two-part, generalized linear model) upregulated in NHD microglia plotted against age at death. Trend line calculated for control samples only.
Extended Data Fig. 3
Extended Data Fig. 3. NHD microglia signature overlaps with IL-10-induced macrophage signature.
a, UMAP plot of human monocyte-derived macrophages stimulated with cocktails of LPS+IFNg, IL-4+IL-13 or IL-10 from GSE199378, designated by treatment. b, Venn diagram showing little overlap among signatures of polarized macrophages. c-e, Violin plot showing gene set scores (by UCell) of the designated macrophage polarization signatures (top 100 genes upregulated under each condition) in the macrophage polarization dataset; c, LPS+IFNg polarization, n=8,232 nuclei; d, IL-4+IL-13 polarization, n=6,741 nuclei; e, IL-10 polarization, n=6,890 nuclei. Box center lines, bounds of box, and whiskers indicate median, first and third quartiles, and minima and maxima within 1.5X IQR, respectively. P value by two-sided Wilcoxon Rank Sum test. f-h, GSEA plots showing enrichment of NHD microglia signature in signatures of polarized macrophages stimulated by LPS and IFNg (f), IL-4 (g) and IL-10 (h) from GSE61298. P values by permutation. NES, normalized enrichment score. i, Histogram of phospho-STAT3 (pSTAT3) staining of bone marrow derived macrophages (BMDMs) from WT and DAP12 KD75 mice, stimulated with 0ng/ml or 20ng/ml IL-10 for 15min after starvation overnight. Data are representative of two independent experiments. j, Quantification of pSTAT3 mean fluorescence intensity (MFI) in i. P value by two-way ANOVA. Data are presented as mean ± s.e.m. n=3 independent cell culture wells per genotype per experiment; two independent experiments. k, Histogram of total STAT3 staining in BMDM from WT and DAP12 KD75 mice, treated as in i. Data are representative of two independent experiments. l, Quantification of STAT3 mean fluorescence intensity in k. P value by two-way ANOVA. Data are presented as mean ± s.e.m. n=3 independent cell culture wells per genotype per experiment; two independent experiments. m, Gating strategy for BMDMs from WT and KD75 mice. Numbers indicate the percentage of cells within the gate.
Extended Data Fig. 4
Extended Data Fig. 4. The NHD endothelial cell signature shows altered function.
a, Volcano plot depicting genes differentially expressed (log2(Fold Change) > 0.25, FDR-adjusted P < 0.05, two-part, generalized linear model) in NHD versus control endothelial cells. b, Box plots showing average individual expression levels for selected DEGs in endothelial cells. Box center lines, bounds of box, and whiskers indicate median, first and third quartiles, and minima and maxima within 1.5X IQR, respectively. P values by two-sided Wilcoxon Rank Sum test. n=11 control and 3 NHD individuals. c, Heatmap showing average gene expression of top DEGs in endothelial cells per sample.
Extended Data Fig. 5
Extended Data Fig. 5. Comparison of NHD astrocyte and oligodendrocyte signatures with those in other neurodegenerative diseases.
a,b, Venn diagram revealing overlapping genes commonly upregulated in NHD astrocytes and two human AD datasets (a), and in NHD astrocytes and AIMS (astrocytes inflamed in MS) (b). c, Dot plot showing marker genes for each oligodendrocyte subcluster. d, Volcano plot depicting genes differentially expressed in NHD and control oligodendrocytes (log2(fold change) > 0.25, FDR-adjusted P < 0.05, two-part, generalized linear model). e, Box plots showing average of individual levels of expression for selected genes upregulated in NHD oligodendrocytes. Box center lines, bounds of box, and whiskers indicate median, first and third quartiles, and minima and maxima within 1.5X IQR, respectively. P values by two-sided Wilcoxon rank-sum test. n=11 control and 3 NHD individuals. f, Heatmap showing average gene expression of top DEGs (log2(fold change) > 0.25, FDR-adjusted P < 0.05, two-part, generalized linear model) in oligodendrocytes from each sample. g, Pathways enriched in genes upregulated in NHD oligodendrocytes. P values calculated based on the cumulative hypergeometric distribution. h,i, Venn diagram revealing genes differentially expressed in NHD oligodendrocytes as well as in two human MS datasets. h, upregulated genes. i, downregulated genes.
Extended Data Fig. 6
Extended Data Fig. 6. NHD neurons present signatures of diminished activity.
a, UMAP plot of neuron sub-clustering. n=36,336 total neuronal nuclei; 3 NHD and 11 controls. Ex, excitatory neurons; In, inhibitory neurons. b, Nuclei frequency of neuronal subclusters in each sample. c, Number of upregulated (up) and downregulated (down) genes differentially expressed in (log2(fold change) > 0.5, FDR-adjusted P < 0.05, two-part, generalized linear model) NHD and controls in each neuronal subcluster. d,e, Pathways enriched in genes downregulated in NHD in excitatory neurons (d) or inhibitory neurons (e). P values calculated based on the cumulative hypergeometric distribution. f, Violin plots showing percentage of reads that map to ribosomal genes split by disease condition. Differences between NHD and controls in all subclusters are significant by two-sided Wilcoxon Rank Sum test. Each dot represents the mean ± s.d. A full list of P values and number of nuclei is given in Supplementary Table 2. g, Heatmap showing average expression of genes in synaptic vesicle endocytosis pathway per condition per cluster.
Extended Data Fig. 7
Extended Data Fig. 7. Cluster characterization of 2-year-old KΔ75 and WT cortical samples.
a, Bar graphs of total nuclei number, median of number of genes and median of number of UMIs of each sample sequenced. b, UMAP plot of 2-year-old KΔ75 and WT cortical samples grouped by clusters, which were manually assigned to each cell type. n=60,851 total nuclei; 4 animals per genotype. c, UMAP plots showing expression of cluster markers. d, Nuclei distribution of all samples in each cluster. e, UMAP plot of all nuclei from KΔ75 and WT samples. n=26,492 WT nuclei and 34,359 KΔ75 nuclei; 4 animals per genotype.
Extended Data Fig. 8
Extended Data Fig. 8. KΔ75 microglia sub-clustering in detail.
a, UMAP plot showing expression of Tyrobp in myeloid clusters. b, Venn diagram highlighting similarities between IFN-R and the interferon responsive signature from ref. Overlapping genes are shown in the box. c, Scatter plot depicting differential cell type abundance calculated by MASC. Data are represented as the MASC OR of a nucleus being in that cluster for WT versus KΔ75 (with 95% CI), against the −log(P value) of the association. Center of bar corresponds to OR. Red labeled cluster was significant with FDR-adjusted P value < 0.05 using Benjamini-Hochberg correction. A full list of P values and number of nuclei is provided in Supplementary Table 5. d, Donut plots showing nuclei contribution from each sample to each myeloid subcluster. Numbers represent the percentage of nuclei from each sample within the designated subcluster. e, Volcano plot showing DEGs (log2(fold change) > 0.5, adjusted P < 0.05, two-sided Wilcoxon Rank Sum test, Bonferroni correction) within the HM cluster from KΔ75 and WT mice. f, Heatmap showing average gene expression of top DEGs from e in HM cluster. g, Pathways enriched in genes downregulated in KΔ75 HM vs. WT HM. q values calculated based on Benjamini-Hochberg.
Extended Data Fig. 9
Extended Data Fig. 9. KΔ75 oligodendrocyte and astrocyte sub-clustering in detail.
a, UMAP plots showing cluster marker expression in each oligodendrocyte sub-cluster. b, Violin plots showing expression of reactive oligodendrocyte genes in each sub-cluster. c, Violin plots showing expression of reactive oligodendrocyte genes in the ROL clusters from KΔ75 and WT mice. d, Violin plots showing the DOL signature score (by UCell) in each oligodendrocyte sub-cluster. DOL signature was extracted from ref. Box center lines, bounds of box, and whiskers indicate median, first and third quartiles, and minima and maxima within 1.5X IQR, respectively. P values by two-sided Wilcoxon Rank Sum test. n=8,398 MFOL, 1,643 OPC, 754 MOL, 74 COP and 51 ROL nuclei. e, Violin plots showing DOL signature score (by UCell) in ROL from KΔ75 and WT mice. f, Representative IF images of MBP (red) in corpus callosum of 2-year-old WT and KΔ75 mice. Scale bar, 30 mm. g, Quantification of MBP intensity in f. P value by two-tailed unpaired t test. Bars at mean. n=4 WT and 3 KΔ75 mice. h, UMAP plot showing expression of Vim and Gfap in astrocyte subcultures. i, Violin plots showing expression of reactive astrocyte genes in each sub-cluster. j, Pathways enriched in astrocyte cluster 8 marker genes. q-values calculated based on Benjamini-Hochberg. k, UMAP plot showing expression of Crym in astrocyte subclusters.
Extended Data Fig. 10
Extended Data Fig. 10. Transcriptional profiles of KΔ75 and WT neurons are similar.
a, UMAP plot of neuron sub-clustering. n=40,657 total neuronal nuclei; 4 animals per genotype. b, UMAP plot showing expression of Slc17a7 and Gad1. c, UMAP plot of neuron sub-clustering grouped by excitatory neurons (Ex_neuron) and inhibitory neurons (In_neuron). d, Number of upregulated (up) and downregulated (down) DEGs (log2(fold change) > 0.5, adjusted P < 0.05, non-parametric two-sided Wilcoxon rank sum test, Bonferroni correction) in excitatory and inhibitory neurons in KΔ75 versus WT mice. e, Model of NHD pathogenesis. A genetic defect in DAP12 or TREM2 leads to imbalance between TREM2/DAP12 signaling pathway and pathways driven by STAT3, RUNX1 and TGFb in microglia. This imbalance results in demyelination through unknown mechanisms, which may include dysregulated phagocytosis and secretion of cytokines. Accumulation of myelin and cellular debris leads to progressive and extensive tissue damage that includes astrocytosis, oligodendrocyte malfunction and dysfunctional vasculature, which further activates microglia. In addition, perivascular macrophages may directly alter vascular function, leading to its dysregulation. Created with BioRender.com.
Fig. 1.
Fig. 1.. NHD microglia show a unique signature.
a, UMAP plot of NHD and control patients. n=66,324 total nuclei; 11 control and 3 NHD individuals. Ex_neuron, excitatory neurons; In_neuron, inhibitory neurons; Oligo, oligodendrocytes; OPC, oligodendrocyte precursor cells; Astro, astrocytes; Micro, microglia; Endo, endothelial cells; Peri, pericytes; SMC, smooth muscle cells; Fibro, fibroblasts; IMM, immune cells. b, UMAP plot of TYROBP expression. c, Number of upregulated (up) and downregulated (down) DEGs (log2(fold change) > 0.5, FDR-adjusted P value < 0.05, two-part, generalized linear model) between NHD and controls in each cell type. d, UMAP plot of microglia and perivascular macrophages (PVMs) from NHD patients and controls. n=3,217 microglia nuclei and 463 PVM nuclei. e, UMAP plots of expression of feature genes in the microglia-PVM cluster. f, Scatter plot depicting genes differentially expressed (FDR-adjusted P < 0.05, two-part, generalized linear model) in NHD versus control within the microglia cluster. g, Box plots showing average of individual levels of expression for selected DEGs in the microglia cluster. Box center lines, bounds of box, and whiskers indicate median, first and third quartiles, and minima and maxima within 1.5X inter-quartile range (IQR), respectively. P values by two-sided Wilcoxon Rank Sum test. n=11 control and 3 NHD individuals. h, Violin plots showing gene set scores (by UCell) of DEGs derived from various neurodegenerative diseases in control and NHD microglia. AD, Alzheimer’s Disease (refs,); HAM, human AD microglia (ref); VaD, vascular dementia (ref); MIMS, microglia inflamed in MS (ref). Gene sets used are listed in Supplementary Table 4. Box center lines, bounds of box, and whiskers indicate median, first and third quartiles, and minima and maxima within 1.5X IQR, respectively. P values by two-sided Wilcoxon Rank Sum test. n=2,124 control and 625 NHD microglia nuclei. i, Venn diagram of overlapping genes commonly upregulated in NHD microglia and two human AD datasets (left), and in NHD microglia as well as two MS-specific microglia subpopulations (right). j, IF staining of SPP1 (red) and IBA1 (green) in NHD and control occipital cortex. DAPI in blue. Scale bar, 10 μm. The experiment was repeated two times.
Fig. 2.
Fig. 2.. NHD microglia signature in part overlaps with IL-10-primed macrophage signature.
a, UMAP plot of human monocyte-derived macrophages stimulated with cocktails of LPS+IFNγ, IL4+IL13, or IL10 from GSE199378. b, Dot plot showing top 10 marker genes for each stimulation in a. c, Violin plot showing gene set scores (by UCell) of LPS+IFNγ, IL4+IL13 or IL10 induced macrophage signatures in microglia from NHD patients and controls. Box center lines, bounds of box, and whiskers indicate median, first and third quartiles, and minima and maxima within 1.5X IQR, respectively. P value by two-sided Wilcoxon Rank Sum test. Box plots embedded show the first and third quartiles and median. n=2,124 control and 625 NHD microglia nuclei. d, Representative images of IHC staining of CD163 in NHD and control brains. Scale bar, 100μm. e, Quantification of percentage of CD163+ area in d. P value by two-tailed unpaired t test. Data are presented as mean ± s.e.m. n=3 control and 3 NHD samples. f, Heatmap depicting Pearson correlation of top 20 ligands driving NHD microglia signature predicted by NicheNet. g, Circos plot showing ligand target interactions predicted by NicheNet. The top half circle in orange represents targets expressed by microglia. The bottom half shows predicted ligands expressed in cells as color coded in the legend. h, Violin plots showing FGF2 expression in various cell types from NHD patients and controls. P value by two-sided Wilcoxon Rank Sum test. Dot represents mean ± s.d. A full list of P values and number of nuclei is provided in Supplementary Table 2.
Fig. 3.
Fig. 3.. NHD pericyte signature indicates vascular abnormalities.
a, UMAP plot of vascular cell sub-clustering. Endo, endothelial cells. Peri, pericytes. SMC, smooth muscle cells. M.FB, meningeal fibroblasts. P.FB, perivascular fibroblasts. n=730 Endo, 287 Peri, 187 SMC, 225 M.FB and 193 P.MB nuclei. b, Dot plot showing expression of marker genes for each subcluster. c, Number of upregulated (up) and downregulated (down) DEGs (log2(fold change) > 0.5, FDR-adjusted P value < 0.05, two-part, generalized linear model) in each sub-cluster in NHD versus controls. d, Volcano plot depicting DEGs (log2(fold change) > 0.25, FDR-adjusted P value < 0.05, two-part, generalized linear model) in pericytes between NHD and controls. e, Box plots showing average of individual levels of expression for selected DEGs in the pericyte cluster. Box center lines, bounds of box, and whiskers indicate median, first and third quartiles, and minima and maxima within 1.5X IQR, respectively. P value by two-sided Wilcoxon Rank Sum test. f, Pathways enriched in genes upregulated in NHD pericytes. P values calculated based on the cumulative hypergeometric distribution. g, Elastica-Goldner staining of blood vessels in NHD and control brain sections. Scale bar, 50μm. The experiment was repeated twice.
Fig. 4.
Fig. 4.. NHD astrocyte signatures reflect a wound healing response.
a, Volcano plot showing DEGs (log2(Fold Change) > 0.25, FDR-adjusted P value < 0.05, two-part, generalized linear model) in NHD versus controls within the astrocyte cluster. Red designates genes involved in response to wounding. b, Pathways enriched in genes upregulated (log2(Fold Change) > 0.5, FDR-adjusted P value < 0.05, two-part, generalized linear model) in NHD astrocytes. q values calculated by FDR. c, Box plots showing average of individual levels of expression for selected DEGs in astrocytes. Box center lines, bounds of box, and whiskers indicate median, first and third quartiles, and minima and maxima within 1.5X IQR, respectively. P value by two-sided Wilcoxon Rank Sum test. n=11 control and 3 NHD individuals. d, Protein-protein interaction network of top 100 upregulated genes in NHD astrocytes. Node color represents pathways. Node size reflects degree of interaction. e, Representative images of IHC staining of GFAP in NHD and control brains. Scale bar, 100μm. f, Quantification of percentage of GFAP+ area in e. Data are presented as mean ± s.e.m. P value by two-tailed unpaired t test. n=3 control and 3 NHD samples. g, UMAP plot of NHD and control oligodendrocyte lineage cells. Oligo, oligodendrocytes. OPC, oligodendrocyte precursor cells. n=13,694 Oligo, 1,885 OPC and 71 transition nuclei. h, Heatmap showing average gene expression of top downregulated oligodendrocyte genes in NHD versus controls. Color scale represents row z-score. i, Box plots showing average of individual levels of expression for selected oligodendrocyte genes downregulated in NHD. Box center lines, bounds of box, and whiskers indicate median, first and third quartiles, and minima and maxima within 1.5X IQR, respectively. P value by two-sided Wilcoxon Rank Sum test. n=11 control and 3 NHD individuals. j, Representative images of IHC staining of MBP in NHD and control brains. Scale bar, 100μm. k, Quantification of percentage of MBP+ area in j. Data are presented as mean ± s.e.m. P value by two-tailed unpaired t test. n=3 control and 3 NHD samples.
Fig. 5.
Fig. 5.. Microglia profile of aged KΔ75 mice is distinct from that of NHD.
a, UMAP plot of cortical samples from 2-year-old KΔ75 and WT mice. n=60,851 nuclei; 4 animals per genotype. Ex_neuron, excitatory neurons; In_neuron, inhibitory neurons; Oligo, oligodendrocytes; Astro, astrocytes; Micro, microglia; OPC, oligodendrocyte precursor cells; VLMC, vascular leptomeningeal cells; ABC, arachnoid barrier cells; Endo, endothelial cells; PC, pericytes. b, UMAP plot showing expression of Tyrobp in microglia cluster. c, Scatter plot depicting differential cell type abundance calculated by MASC. Data are represented as the MASC odds ratio (OR) of a nucleus being in that cluster for WT versus KΔ75 (with 95% confidence interval (CI)), against the −log(P value) of the association. Center of bar corresponds to OR. No cluster was significant, with FDR-adjusted P value > 0.05 using Benjamini-Hochberg correction. A full list of P values and number of nuclei is provided in Supplementary Table 5. d, UMAP plot of sub-clustered myeloid population (Micro cluster in Fig. 5a). HM, homeostatic microglia; AM, age-associated microglia; IFN-R, interferon responsive microglia; MHCIIhi-BAM, MHCII-high-expressing border-associated macrophages (BAM); MHCIIlo-BAM, MHCII-low-expressing BAM. n=2,179 myeloid nuclei; 4 animals per genotype. e, Dot plot showing marker genes for each myeloid subcluster. f, Venn diagram comparing genes upregulated in AM and DAM. Genes upregulated by both DAM and AM are shown in the box; the top 5 genes unique for each cluster are shown on the sides. g, Venn diagram comparing genes upregulated in AM and WAM (white matter-associated microglia); genes upregulated by both WAM and AM are shown in the box. h, UMAP plot of myeloid subclusters in WT and KΔ75 mice. n=1,011 WT myeloid nuclei; 1,168 KΔ75 myeloid nuclei. i, Donut plots showing nuclei contribution from each sample to AM and IFN-R subclusters. Numbers represent the percentage of nuclei contributed by either WT or KΔ75 within each subcluster. j, IF staining of CD11c (red) and IBA1 (green) in corpus callosum of WT and KΔ75 mice. DAPI in blue. Scale bar, 20 μm. k, Quantification of CD11c+IBA1+ volume as a percentage of total IBA1+ volume in j. Data are presented as mean ± s.e.m. P value by two-tailed unpaired t test. n=4 WT and 3 KΔ75 mice.
Fig. 6.
Fig. 6.. KΔ75 mice exhibit mild oligodendrocyte and astrocyte defects.
a, UMAP plot of sub-clustered oligodendrocyte lineage cells (Oligo and OPC populations in Fig. 5a). n=10,607 Oligo nuclei and 1,688 OPC nuclei. COP, differentiation-committed oligodendrocyte precursors; MFOL, myelin-forming oligodendrocytes; MOL, mature oligodendrocytes; ROL, reactive oligodendrocytes. b, Dot plot showing marker genes for each subcluster in the oligodendrocyte lineage. c, Scatter plot showing average expression against fold change of DEGs (log2(fold change) > 0.5, adjusted P value < 0.05, two-sided Wilcoxon Rank Sum test, Bonferroni correction) in KΔ75 versus WT within the MFOL cluster. d, Pathways enriched in genes downregulated in MFOL in KΔ75 versus WT. q-values calculated based on Banjamini-Hochberg. e, Donut plot showing nuclei contribution from each sample in the ROL cluster. Numbers represent the percentage of nuclei from either KΔ75 or WT. f, IF staining of Serpina3n (red) and Olig2 (green) in corpus callosum of WT and KΔ75 mice. DAPI in blue. Scale bar, 10 μm. g, Quantification of number of Serpina3n+Olig2+ cells as a percentage of Olig2+ cells in f. Data are presented as mean +/− SEM. P value by two-tailed unpaired t test. n=4 WT and 3 KΔ75 mice. h, UMAP plot of sub-clustered astrocytes (Astro cluster in Fig. 5a). n=3,258 Astro nuclei. i, Dot plot showing expression of marker genes for each astrocyte subcluster. j, Scatter plot depicting differential cell type abundance calculated by MASC. Data are represented as the MASC OR of a nucleus being in that cluster for WT versus KΔ75 (with 95% CI), against the −log(P value) of the association. Center of bar corresponds to OR. Red labeled clusters were significant with FDR-adjusted P value < 0.05 using Benjamini-Hochberg correction. A full list of P values and number of nuclei is provided in Supplementary Table 5. k, Violin plots showing expression of reactive astrocyte marker genes in KΔ75 and WT. n=1,356 WT astrocytes and 1,902 KΔ75 astrocytes. P value by two-sided Wilcoxon Rank Sum test. l, IF staining of GFAP (green) in corpus callosum of WT and KΔ75 mice. DAPI in blue. Scale bar, 10 μm. m, Quantification of percentage of GFAP+ volume in l. Data are presented as mean ± s.e.m. P value by two-tailed unpaired t test. n=4 WT and 3 KΔ75 mice.

Comment in

Similar articles

Cited by

References

    1. Ulland TK & Colonna M TREM2 - a key player in microglial biology and Alzheimer disease. Nat Rev Neurol 14, 667–675 (2018). - PubMed
    1. Li R-Y et al. TREM2 in the pathogenesis of AD: a lipid metabolism regulator and potential metabolic therapeutic target. Molecular Neurodegeneration 17, 40 (2022). - PMC - PubMed
    1. Efthymiou AG & Goate AM Late onset Alzheimer’s disease genetics implicates microglial pathways in disease risk. Molecular Neurodegeneration 12, 43 (2017). - PMC - PubMed
    1. Song WM et al. Humanized TREM2 mice reveal microglia-intrinsic and -extrinsic effects of R47H polymorphism. Journal of Experimental Medicine jem.20171529 (2018) doi:10.1084/jem.20171529. - DOI - PMC - PubMed
    1. Zhou Y et al. Human and mouse single-nucleus transcriptomics reveal TREM2-dependent and TREM2-independent cellular responses in Alzheimer’s disease. Nature Medicine 26, 131–142 (2020). - PMC - PubMed

Methods-only References

    1. Fonseka CY et al. Mixed-effects association of single cells identifies an expanded effector CD4+ T cell subset in rheumatoid arthritis. Sci Transl Med 10, eaaq0305 (2018). - PMC - PubMed
    1. Butler A, Hoffman P, Smibert P, Papalexi E & Satija R Integrating single-cell transcriptomic data across different conditions, technologies, and species. Nature Biotechnology 36, 411–420 (2018). - PMC - PubMed
    1. Hafemeister C & Satija R Normalization and variance stabilization of single-cell RNA-seq data using regularized negative binomial regression. Genome Biology 20, 296 (2019). - PMC - PubMed
    1. Finak G et al. MAST: a flexible statistical framework for assessing transcriptional changes and characterizing heterogeneity in single-cell RNA sequencing data. Genome Biology 16, 278 (2015). - PMC - PubMed
    1. Andreatta M & Carmona SJ UCell: Robust and scalable single-cell gene signature scoring. Comput Struct Biotechnol J 19, 3796–3798 (2021). - PMC - PubMed

Publication types

Supplementary concepts