. 2023 Jun;19(6):695-702.
doi: 10.1038/s41589-022-01232-y. Epub 2023 Jan 19.

Structures of the sulfite detoxifying F420-dependent enzyme from Methanococcales

Affiliations

Structures of the sulfite detoxifying F420-dependent enzyme from Methanococcales

Marion Jespersen et al. Nat Chem Biol. 2023 Jun.

Abstract

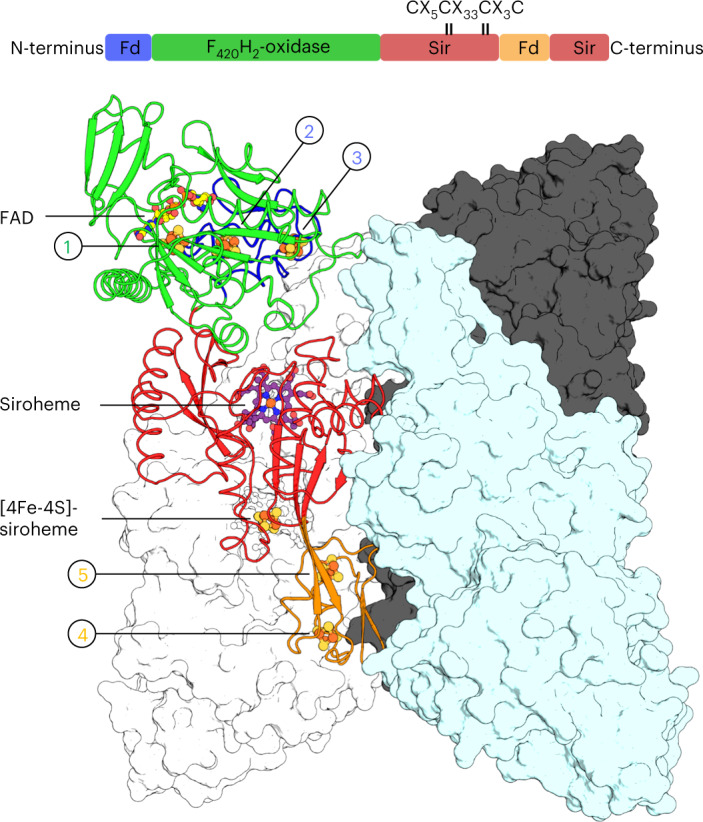
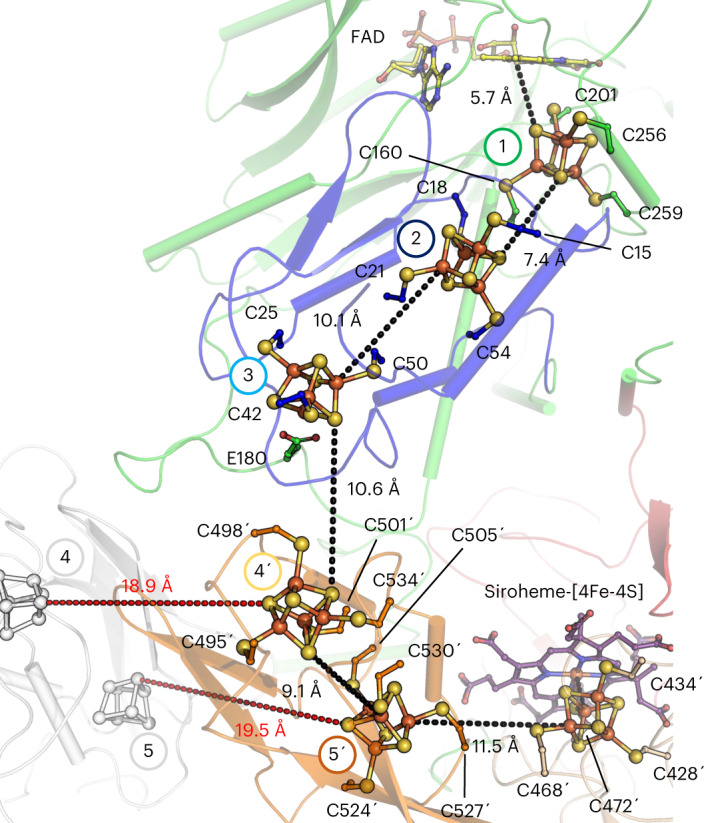
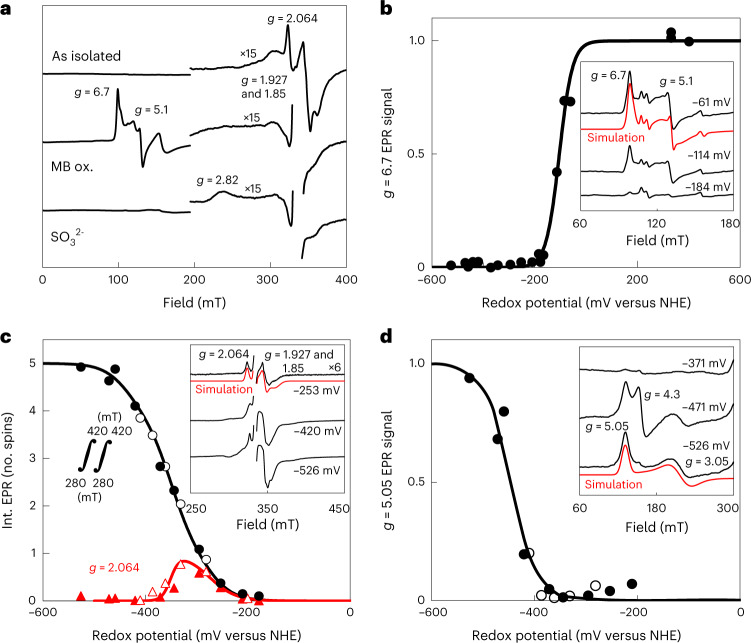
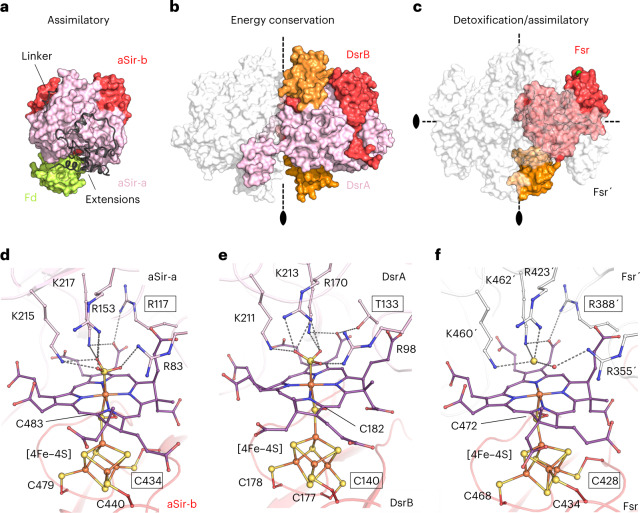
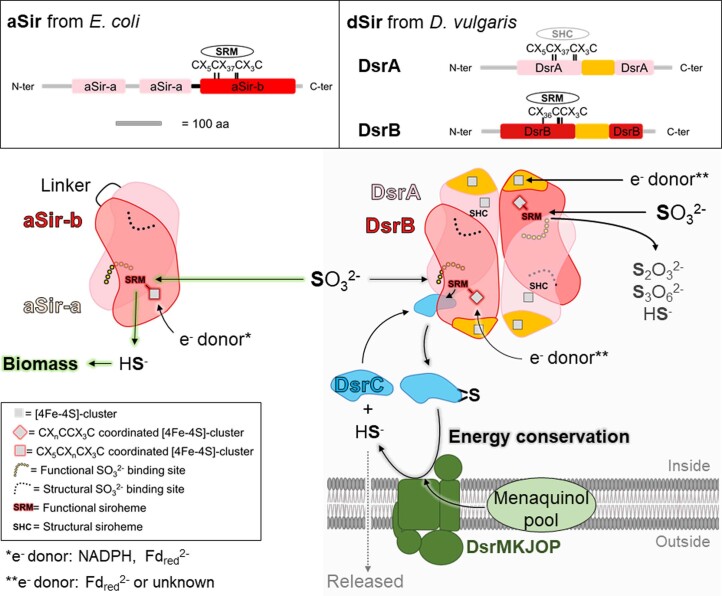
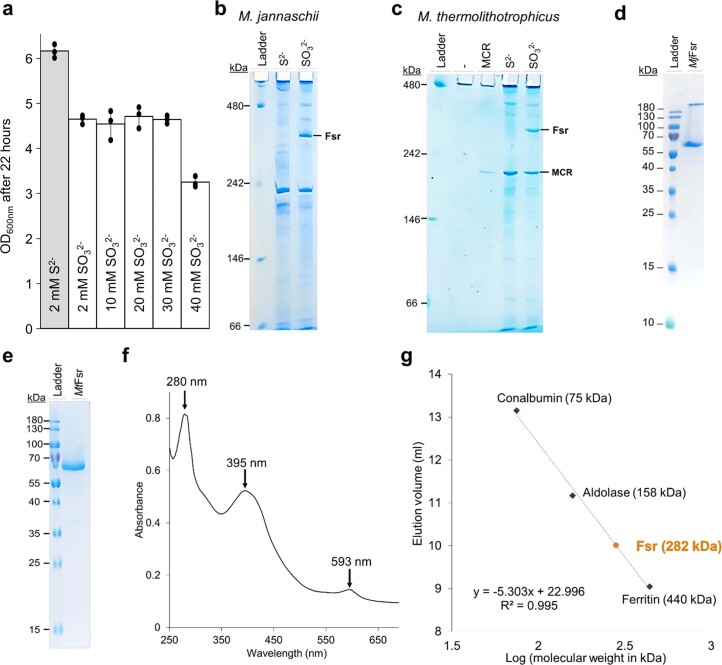
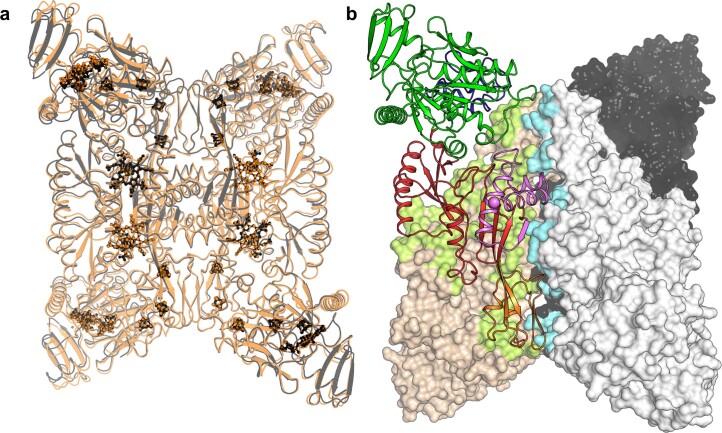
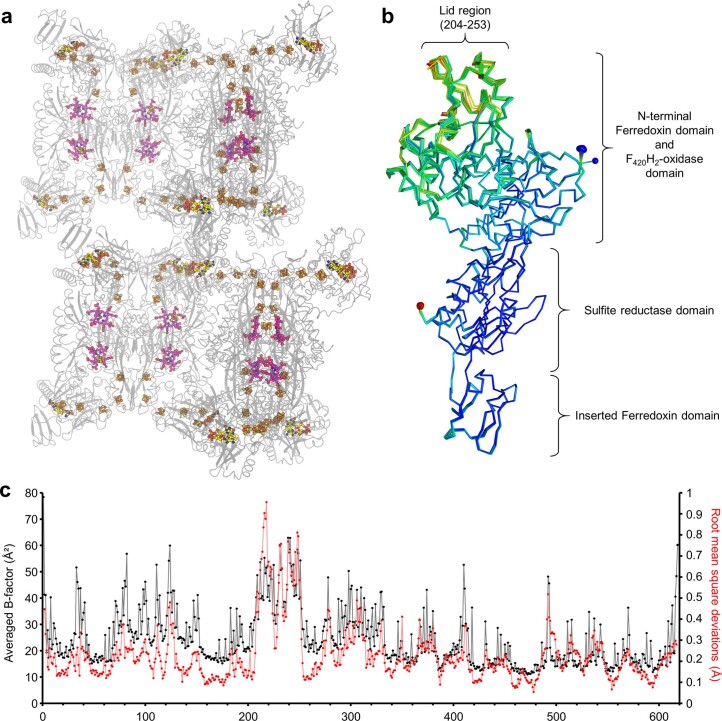
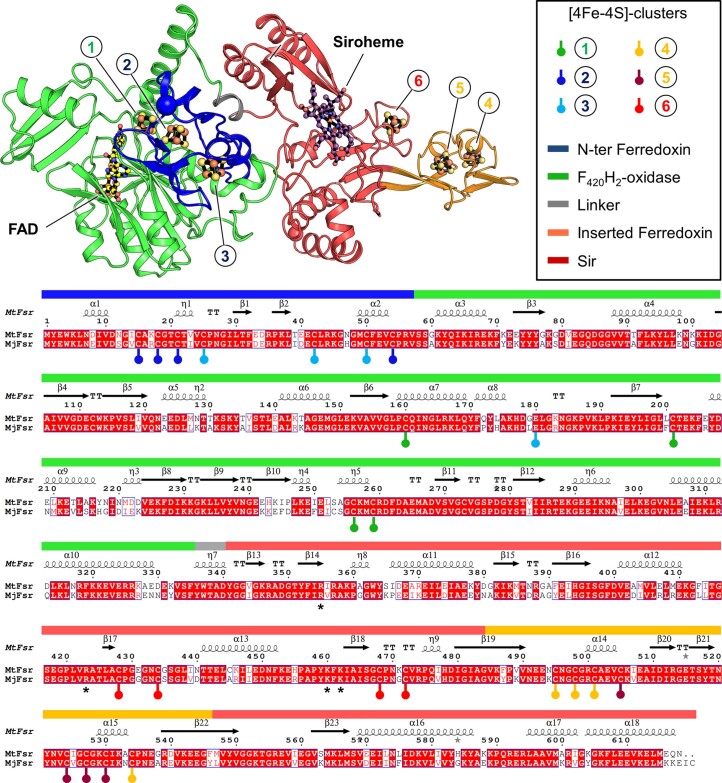
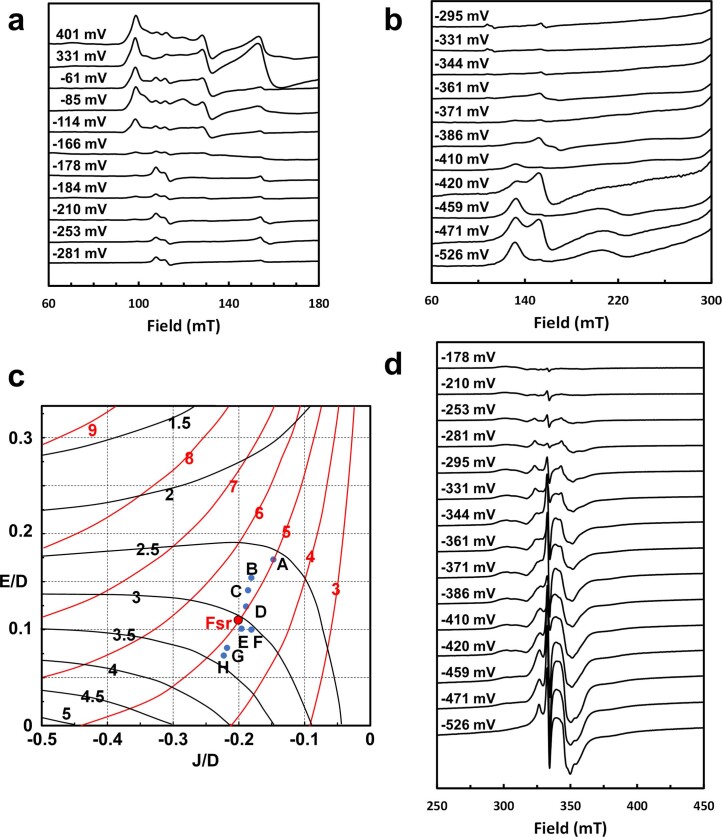
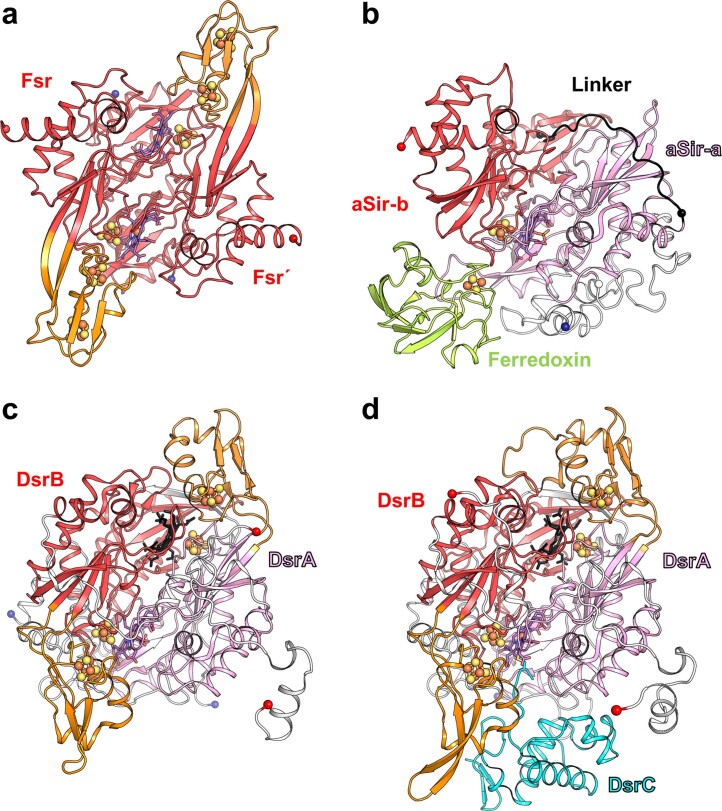
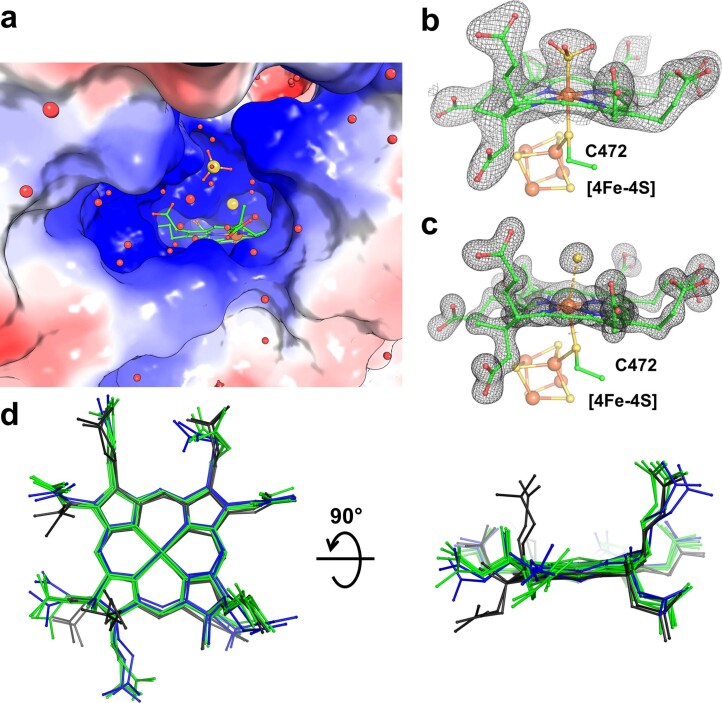
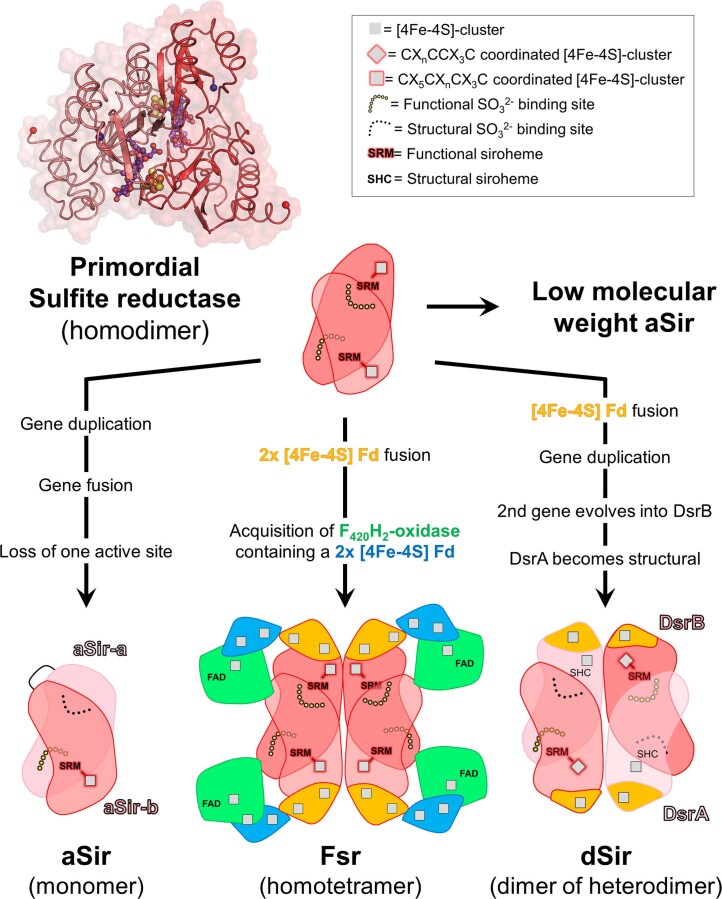
Methanogenic archaea are main actors in the carbon cycle but are sensitive to reactive sulfite. Some methanogens use a sulfite detoxification system that combines an F420H2-oxidase with a sulfite reductase, both of which are proposed precursors of modern enzymes. Here, we present snapshots of this coupled system, named coenzyme F420-dependent sulfite reductase (Group I Fsr), obtained from two marine methanogens. Fsr organizes as a homotetramer, harboring an intertwined six-[4Fe-4S] cluster relay characterized by spectroscopy. The wire, spanning 5.4 nm, electronically connects the flavin to the siroheme center. Despite a structural architecture similar to dissimilatory sulfite reductases, Fsr shows a siroheme coordination and a reaction mechanism identical to assimilatory sulfite reductases. Accordingly, the reaction of Fsr is unidirectional, reducing sulfite or nitrite with F420H2. Our results provide structural insights into this unique fusion, in which a primitive sulfite reductase turns a poison into an elementary block of life.


Conflict of interest statement

The authors declare no competing interests.

Figures

Fig. 1
Fig. 1. Domain and structural organization of MtFsr.
Visualization of MtFsr domains (top panel). The [4Fe‒4S] cluster-binding motif in the proximity of the siroheme is highlighted. The main panel shows the tetrameric arrangement of MtFsr. Three chains are represented in the surface and colored in white, black and cyan. One monomer of MtFsr is represented as a cartoon and colored according to the top panel. [4Fe‒4S] clusters are numbered on the basis of their position in the electron relay going from the FAD to the siroheme. The siroheme, FAD and the [4Fe‒4S] clusters are represented by balls and sticks. Carbon, nitrogen, oxygen, sulfur and iron atoms are colored as purple (siroheme)/light yellow (FAD), blue, red, yellow and orange, respectively. Fd and Sir stand for ferredoxin domain and sulfite reductase domain, respectively.
Fig. 2
Fig. 2. Comparison of the F420H2-oxidase domain between Fsr and Frh.
a, Superposition of the F420H2-oxidase domain in Fsr (MjFsr in dark green, MtFsr in light green) with FrhB from M. barkeri (black, PDB 6QGR) and FrhB from M. marburgensis (white, PDB 4OMF). The extended loops 171–189 in MjFsr and MtFsr are highlighted, as well as the lid, which is static in the Frh structures, but more flexible in Fsr (Extended Data Fig. 4b,c). b, Representation of MtFsr F420H2-oxidase domain (green surface) and its N-terminal ferredoxin domain (blue cartoon residues 1–70). The N terminus of Fsr and C terminus from the F420H2-oxidase domain are highlighted by blue and red spheres, respectively. The inserted ferredoxin domain, provided by the opposing monomer (Fsr′), is shown in white cartoon representation. c, Arrangement of FrhB (green surface) with FrhG (cartoon) from M. marburgensis (PDB 4OMF). The N-terminal part (45–205) of FrhG is colored in white and its C-terminal part (206–275), structurally equivalent to the N-terminal ferredoxin domain of Fsr, is colored in blue. The cyan ball highlights the connection between both FrhG parts.
Fig. 3
Fig. 3. Electron-transfer relay of MtFsr.
MtFsr, shown as cartoon, has the same color code and numbering of its [4Fe‒4S] clusters (balls and sticks) as in the domain representation in Fig. 1. Edge-to-edge distances connecting the clusters are shown as dashes. The distances to the adjacent [4Fe‒4S] clusters of the opposite dimer are shown in red. The primes correspond to the second monomer forming the dimer. The residues binding the clusters are shown as balls and sticks. Carbon atoms are colored by their domain affiliation. Nitrogen, oxygen, sulfur and iron atoms are colored in blue, red, yellow and orange, respectively. Siroheme and FAD are shown as sticks with purple and yellow carbon atoms, respectively.
Fig. 4
Fig. 4. Determination of the redox potential of the metallocofactors in MtFsr via EPR spectroscopy.
a, EPR spectra of as-isolated, methylene blue-oxidized (MB-ox.) and, consecutively, Na2SO3 (10 mM)-treated MtFsr. bd, Dye-mediated redox titrations of indicated EPR signals (or double integral in c). Representative spectra at three selected potentials are shown in the insets, including g values and simulations (see text). EPR spectra for all samples are in Extended Data Fig. 6a,b,d. Nernst fits for n = 1 with Em = −104 mV (b), −275, three times −350 and −435 mV (c) and −445 mV (d) are shown. NHE, normal hydrogen electrode. The fit for g = 2.064 used n = 1 (in red) for −275 mV and n = 2 for −350 mV (in black). EPR conditions: temperature, 10 K; modulation frequency, 100 kHz; modulation amplitude, 1.0 mT; microwave frequency 9.353 GHz; microwave power 20 mW except in c, where 0.2 mW. While one cluster indeed has a measured redox potential of −275 mV and three others are at −350 mV, one of them exhibits a lower potential of −435 mV. The presence of such a low redox potential cluster has already been seen in complex I and does not contradict our hypothesis regarding the electron flow.
Fig. 5
Fig. 5. Overall structural comparison between aSir, dSir and Fsr.
ac, All structures are represented in surface, dimeric partners shown in white transparent and residues from the opposing monomer are labeled with a prime symbol. The black ovals and black dashed lines indicate the twofold symmetry axes. The inserted ferredoxin domains of DsrAB and MtFsr are colored in orange. a, aSir from Zea mays with its [2Fe‒2S] ferredoxin colored in light green (PDB 5H92). b, DsrAB from A. fulgidus (PDB 3MM5). c, MtFsr tetramer. For MtFsr, the green surface indicates the F420H2-oxidase position. df, Active site of sulfite reductases. Close-up of the active site and the functional siroheme surroundings in E. coli aSir (PDB 1AOP) (d), dSir of A. fulgidus (PDB 3MM5) (e) and MtFsr (f) in which HS was tentatively modeled. Residues coordinating the [4Fe‒4S] cluster, the siroheme and the sulfur species are shown as balls and sticks, while sulfur and iron are depicted as spheres. Framed residues highlight the differences between the siroheme‒[4Fe‒4S] binding in aSirs and dSirs.
Extended Data Fig. 1
Extended Data Fig. 1. Structural and functional organization of assimilatory (aSir) and dissimilatory (dSir refer here as DsrAB) sulfite reductases.
Distinct and conserved domains in aSir as well as dSir are shown in the top panel. The [4Fe-4S]-cluster binding motifs in the proximity of the siroheme or sirohydrochlorin are highlighted. Bottom panel: aSirs (left) are functional monomers that probably evolved through a gene duplication event, where one gene lost its cluster binding motif. The N-terminal half abbreviated as aSir-a (light pink) has a structural function and the C-terminal half abbreviated as aSir-b (red) harbours the active [4Fe-4S]-siroheme. aSirs indirectly use electrons from NADPH (bacteria) or directly via a [2Fe-2S]-cluster containing ferredoxin (plants) to reduce SO32− to HS in a six-electron reduction reaction,. The produced sulfide will be used for sulfur assimilation. dSirs (right) are composed of two DsrA (light pink) and two DsrB (red) subunits and receive electrons from reduced ferredoxins (Fdred2−) or so far unknown donors. In absence of DsrC (cyan), DsrAB turns SO32− to thionates (that is S2O32−, S3O62−) and HS. In presence of DsrC, the intermediate sulfur species bound on the siroheme is transferred to DsrC. In the case of Desulfovibrio species, the membrane DsrMKJOP complex (green) fully reduces the DsrC-trisulfide (4 electrons transfer) probably by using the menaquinol pool and generates DsrC and HS via the trisulfide pathway, a key process for energy conservation.
Extended Data Fig. 2
Extended Data Fig. 2. Physiological and biochemical profiles of Fsr from Methanococcales.
a, Final OD600 nm of M. thermolithotrophicus grown on sulfide (S2-) and different sulfite (SO32−) concentrations as a sole sulfur source after 22 hours (mean ± s.d., n = 3 biologically independent replicates). b, c, hrCN-PAGE of cell extracts (12 µg loaded) from M. jannaschii (b, n = 1 independent experiment) and M. thermolithotrophicus (c, n = 3 independent experiments), grown on 2 mM Na2S or 2 mM Na2SO3 as a sole sulfur source. Purified MCR from M. thermolithotrophicus (1.7 µg loaded) was used as a control for the hrCN-PAGE. d, e, SDS-PAGE profile of purified MjFsr (d, n = 1 independent experiment) and MtFsr (e, n = 3 independent experiments). f,. UV-visible spectrum of 0.33 mg MtFsr measured anaerobically (100 % N2) in 25 mM Tris-HCl, pH 7.6, 150 mM NaCl, 10 % v/v glycerol and 2 mM DTT. MtFsr displays the typical spectra of [Fe-S]-cluster and siroheme containing enzymes, similar to the UV spectrum of MjFsr previously determined exhibiting three peaks at 280 nm, 395 nm and 593 nm. g, Molecular weight estimation of MtFsr via size exclusion chromatography (Superdex 200 Increase 10/300 GL from GE Healthcare). Apparent molecular weight of purified MtFsr (monomeric molecular weight = 69.145 kDa) was estimated to 282 kDa. MtFsr is therefore apparently organized as a homotetramer (theoretical molecular weight of the protein in the homotetramer: 276.58 kDa). Source data
Extended Data Fig. 3
Extended Data Fig. 3. Homotetrameric arrangement of Fsr.
a, Superposition of MtFsr (black) with MjFsr (orange, rmsd of 0.456 Å for 544-Cα aligned). Ligands are shown in balls and sticks and coloured in black and orange for MtFsr and MjFsr, respectively. b, Surface area involved in the oligomerization in Fsr. Monomers of MtFsr are shown in surface representation, with one monomer being displayed in cartoon and coloured by its domain composition: the N-terminal ferredoxin domain in dark blue, F420H2-oxidase in green, the sulfite reductase domain in red and its inserted ferredoxin domain in orange. The C-terminal segment involved in the oligomerization is coloured in light pink with the C-terminus highlighted as a ball. The monomer-monomer contacts are shown as a green surface and contacts to the adjacent dimer are visualized by a cyan surface. The basic monomer-monomer interface of 2,902-Å2 for MtFsr and 2,971-Å2 for MjFsr is established by the sulfite reductase domain and the two additional ferredoxin domains. The C-terminal part of the sulfite reductase domain (562–618 in MtFsr, 562–620 in MjFsr), the second ferredoxin domain and the loop 171–189 of the F420H2-oxidase domain generate the dimer-dimer interface, totalling an area of 3,055-Å2 for MtFsr and 3,037-Å2 for MjFsr. Most of these contacts involve salt bridges. In MjFsr, the tetrameric structure is supported by two divalent cations, modelled as calcium ions that are each coordinated by a conserved aspartate from the opposite monomers (Asp511 and water molecules).
Extended Data Fig. 4
Extended Data Fig. 4. Asymmetric unit content and B-factor profile of MtFsr.
a, The four homotetramers contained in the asymmetric unit of MtFsr are shown in cartoon and the 96 [4Fe-4S]-clusters, the 16 FADs (in yellow) and 16 sirohemes (in pink) are shown in balls and sticks. To our knowledge, MtFsr contains the highest number of clusters seen in an asymmetric unit so far. b, Superposition of all sixteen chains from the asymmetric unit in MtFsr, with an average rmsd of 0.14 Å for 514-Cα aligned. The N- and C-terminus of each chain are shown by a blue and red sphere, respectively. The models are coloured according to their B-factor values; blue to red indicate low to high B-factors, respectively. c, Averaged B-factor values (in black) for each residue from the 16 chains composing the asymmetric unit of MtFsr. The averaged root mean square deviations (rmsd, in red) of the corresponding Cα is overlaid on the same graph. Averaged rmsd were calculated by the software superpose. Source data
Extended Data Fig. 5
Extended Data Fig. 5. Cluster coordination in Fsr.
The top panel shows the monomeric arrangement of MtFsr (in cartoon) coloured by domains. The siroheme (purple), FAD (yellow) and the [4Fe-4S]-clusters are represented in balls and sticks. Nitrogen, oxygen, sulfur, and iron atoms are coloured respectively, in blue, red, yellow and orange. In the bottom panel, cysteines and the glutamate involved in direct [4Fe-4S]-cluster binding are highlighted, as well as the different domains of Fsr. Sequence alignment was done by Clustal Omega, secondary structure prediction was performed with ESPript 3.0. Cluster 6 is electronically connected to the siroheme. The black stars (*) indicate residues near the siroheme, proposed to bind SO32−.
Extended Data Fig. 6
Extended Data Fig. 6. EPR spectra of the dye-mediated redox titrations of MtFsr and g-values as function of J/D and E/D as described by J. A. Christner et al. 1984.
a, b and d The redox potentials at which samples were frozen are indicated. EPR intensities were scaled to correct for differences in concentration. EPR conditions: temperature, 10 K; modulation frequency, 100 kHz; modulation amplitude, 1.0 mT; microwave frequency, 9.353 GHz; microwave power, 20 mW (panel d 0.2 mW). c, Contours of the two highest g-values of the coupled ferrous siroheme-[4Fe-4S]1+ system as function of J/D and E/D according to Fig. 4 from. The blue points are from E. coli sulfite reductase: A and B, KCl (two species); C, KF or KBr; E, urea; F, sodium formate; G, (Gdm)2SO4; H, KBr; D, spinach nitrite reductase; MtFsR is shows as red point.
Extended Data Fig. 7
Extended Data Fig. 7. Overall structural comparison between Fsr, aSir and dSir.
Cut-through view shown in cartoon of one dimer for Fsr and DsrAB. Ligands are shown as balls and sticks. a, The sulfite reductase domain with the inserted ferredoxin domain of MtFsr. Fsr´ corresponds to the opposite monomer. b, aSir from Zea mays and its [2Fe-2S]-ferredoxin coloured in light green (PDB 5H92). c, DsrAB from A. fulgidus (PDB 3MM5) and d, DsrABC from D. vulgaris (PDB 2V4J). The inserted ferredoxin domains of Fsr, DsrA and DsrB are coloured in orange. The catalytic siroheme in DsrAB is coloured in purple and the structural siroheme is coloured in black. DsrAB from D. vulgaris contains sirohydrochlorin instead of siroheme.
Extended Data Fig. 8
Extended Data Fig. 8. Siroheme conformation within Fsr.
a, Electrostatic charge profile of MtFsr shown in surface is coloured in red and blue to represent acidic and basic patches, respectively. The siroheme is accessible via a positively charged solvent channel. Carbon, oxygen, nitrogen, sulfur and iron are coloured in green, red, blue, yellow and orange, respectively. b and c, Close up of the axial ligands bound on the siroheme of MjFsr (b) and MtFsr (c). The 2Fo-Fc map of the siroheme and SO32− are contoured to 1.5-σ in MjFsr, while the siroheme and HS is contoured to 3-σ in MtFsr. In MjFsr the Fe-siroheme is equidistant (2.3 Å) to the sulfur from the modelled SO32− and the bridging-sulfur of the cysteine 472, suggesting a tight covalent binding. In MtFsr, the bridging-sulfur of the cysteine 472 is at a distance of 2.6 Å to the Fe-siroheme and the sulfur from the modelled HS is 2.9 Å distant to the Fe-siroheme, indicating a loose binding of the HS, which might result from a reduction event by X-ray radiation. d, Siroheme superposition between aSirs (1AOP, 5H92), dSirs (3MM5, 2V4J) and Fsrs. Siroheme from aSirs and Fsr are coloured in green, structural siroheme/sirohydrochlorin from dSirs in black and dSirs functional sirohemes in blue. Superposition analysis shows that the functional sirohemes are arranged in a highly similar manner, whereas the conformation of the structural siroheme or sirohydrochlorin differ, which highlights the strong influence of the protein environment on the siroheme geometry.
Extended Data Fig. 9
Extended Data Fig. 9. Theoretical evolutionary scenario of sulfite reductases.
The proposed route is based on the assumption that aSir, dSir and Fsr could have evolved from a common ancestor. The primordial sulfite reductase model corresponds to the elementary sulfite reductase core of the MtFsr structure. The different steps that led to the evolution of this progenitor to modern Fsr can be hypothesized based on its modular organization. In a straightforward and simple model, a ferredoxin with 2 × [4Fe‒4 S]-cluster could have been inserted into the elementary sulfite reductase module. Then an F420H2-oxidase with a ferredoxin domain (Fqo/FpoF-like) would have been fused to the N-terminus of the sulfite reductase domain containing the inserted ferredoxin. Some members of the Sir superfamily might have arisen from one of these steps. Such a hypothesis is exemplified by the similarities between the quaternary organization of Fsr and DsrAB and the active site of Fsr and aSir.

References

    1. Jannasch HW, Mottl MJ. Geomicrobiology of deep-sea hydrothermal vents. Science. 1985;229:717–725. doi: 10.1126/science.229.4715.717. - DOI - PubMed
    1. Balderston WL, Payne WJ. Inhibition of methanogenesis in salt marsh sediments and whole-cell suspensions of methanogenic bacteria by nitrogen oxides. Appl. Environ. Microbiol. 1976;32:264–269. doi: 10.1128/aem.32.2.264-269.1976. - DOI - PMC - PubMed
    1. Jones WJ, Leigh JA, Mayer F, Woese CR, Wolfe RS. Methanococcus jannaschii sp. nov., an extremely thermophilic methanogen from a submarine hydrothermal vent. Arch. Microbiol. 1983;136:254–261. doi: 10.1007/BF00425213. - DOI
    1. Daniels L, Belay N, Rajagopal BS. Assimilatory reduction of sulfate and sulfite by methanogenic bacteria. Appl. Environ. Microbiol. 1986;51:703–709. doi: 10.1128/aem.51.4.703-709.1986. - DOI - PMC - PubMed
    1. Johnson EF, Mukhopadhyay B. A new type of sulfite reductase, a novel coenzyme F420-dependent enzyme, from the methanarchaeon Methanocaldococcus jannaschii. J. Biol. Chem. 2005;280:38776–38786. doi: 10.1074/jbc.M503492200. - DOI - PubMed

Publication types

LinkOut - more resources