. 2023 Aug;41(8):1089-1098.
doi: 10.1038/s41587-022-01584-9. Epub 2023 Jan 19.

Engineered live bacteria suppress Pseudomonas aeruginosa infection in mouse lung and dissolve endotracheal-tube biofilms

Affiliations

Engineered live bacteria suppress Pseudomonas aeruginosa infection in mouse lung and dissolve endotracheal-tube biofilms

Rocco Mazzolini et al. Nat Biotechnol. 2023 Aug.

Abstract

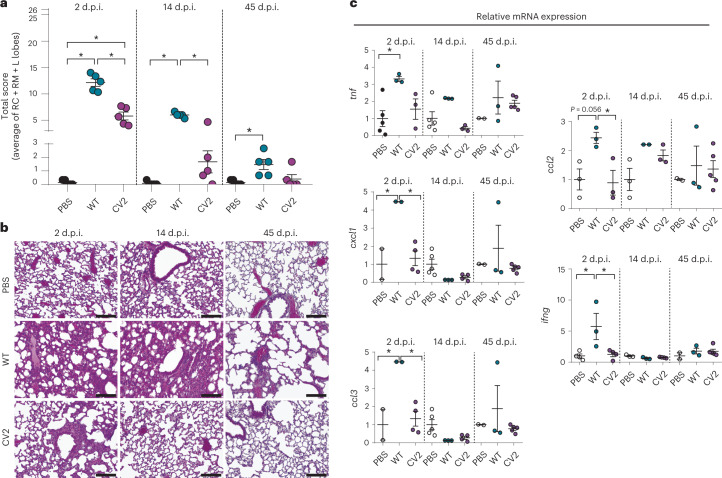
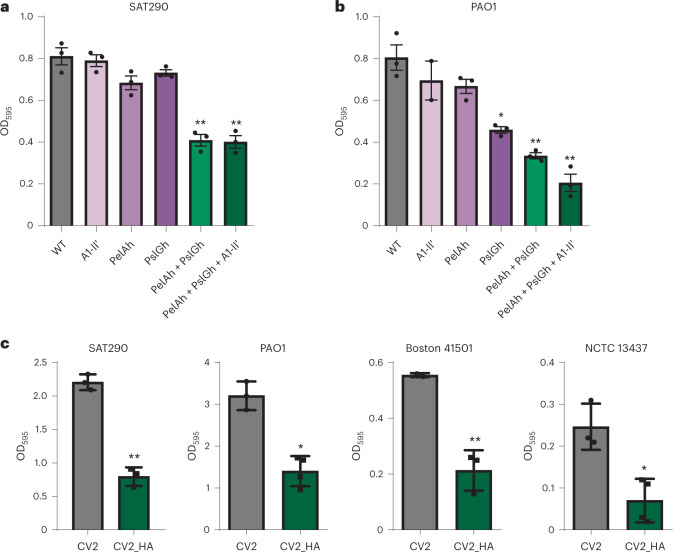
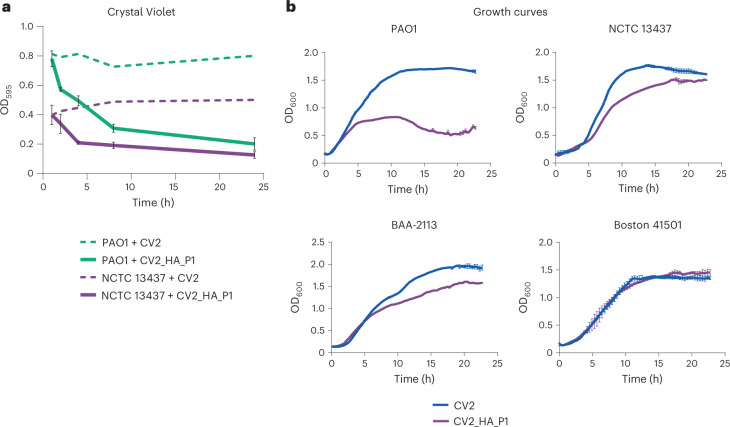
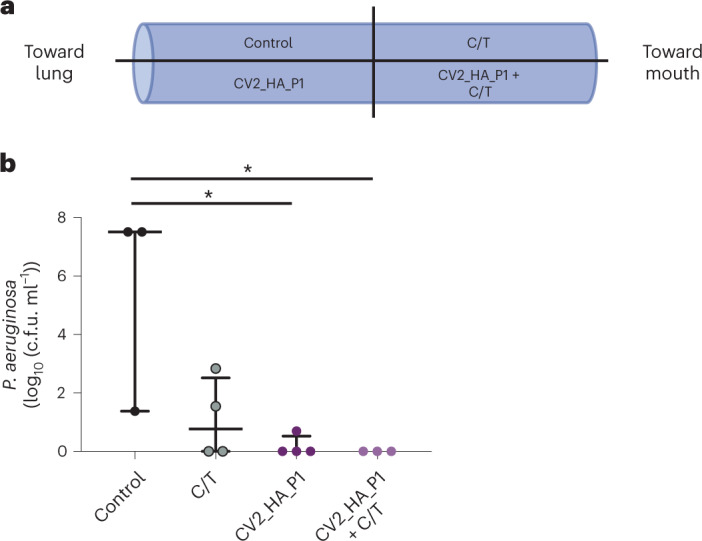
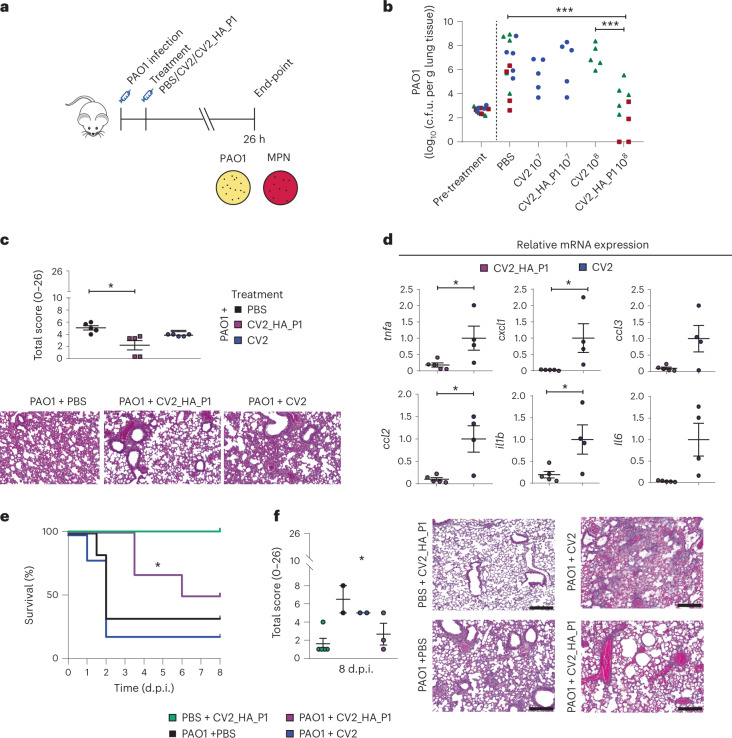
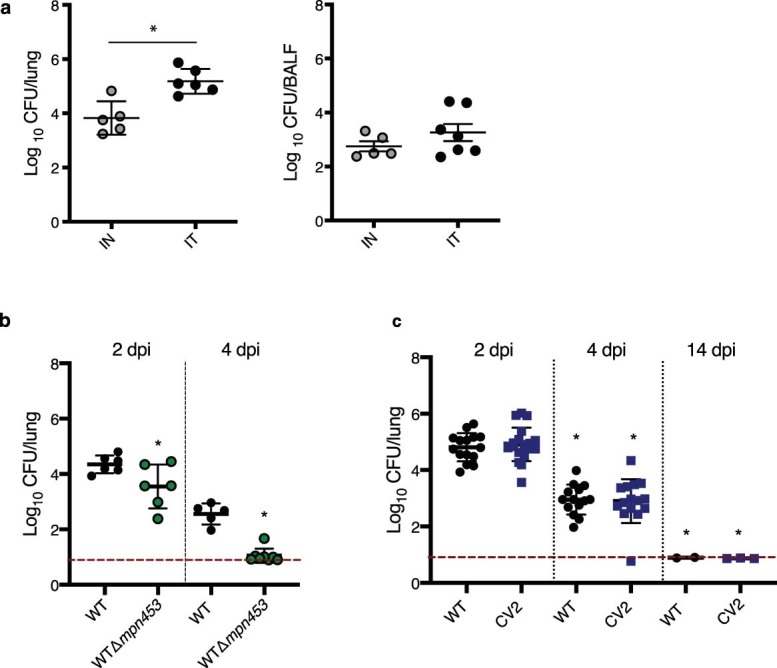
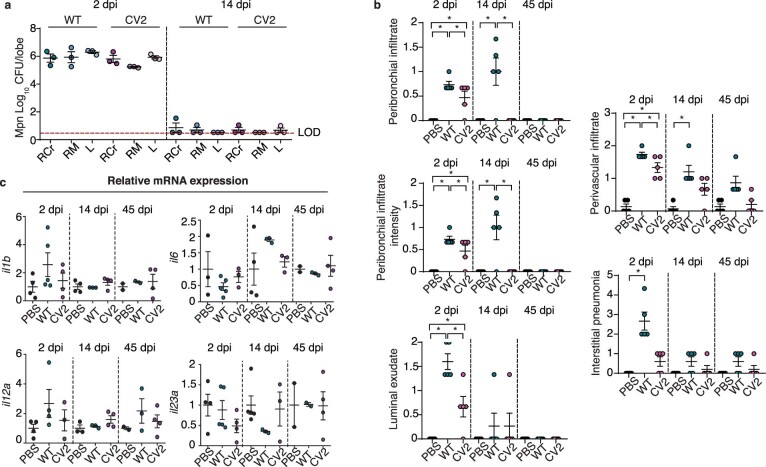
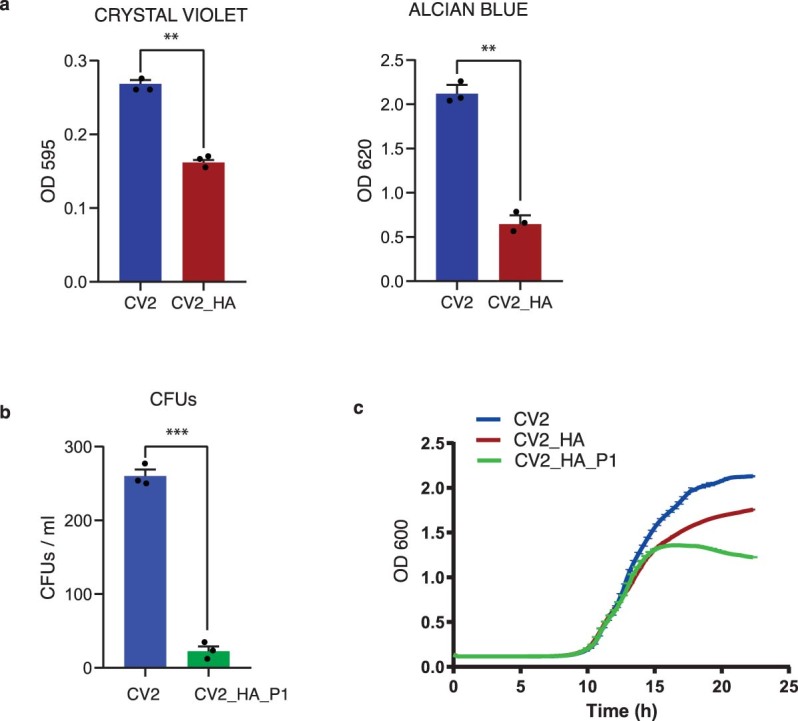
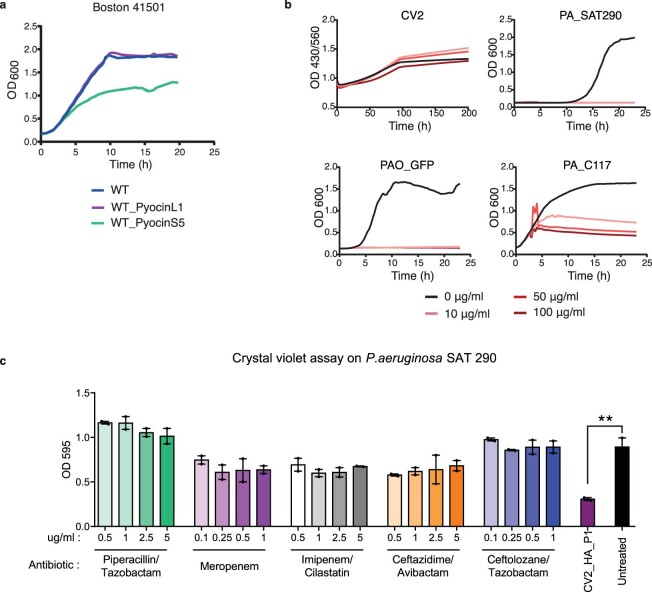
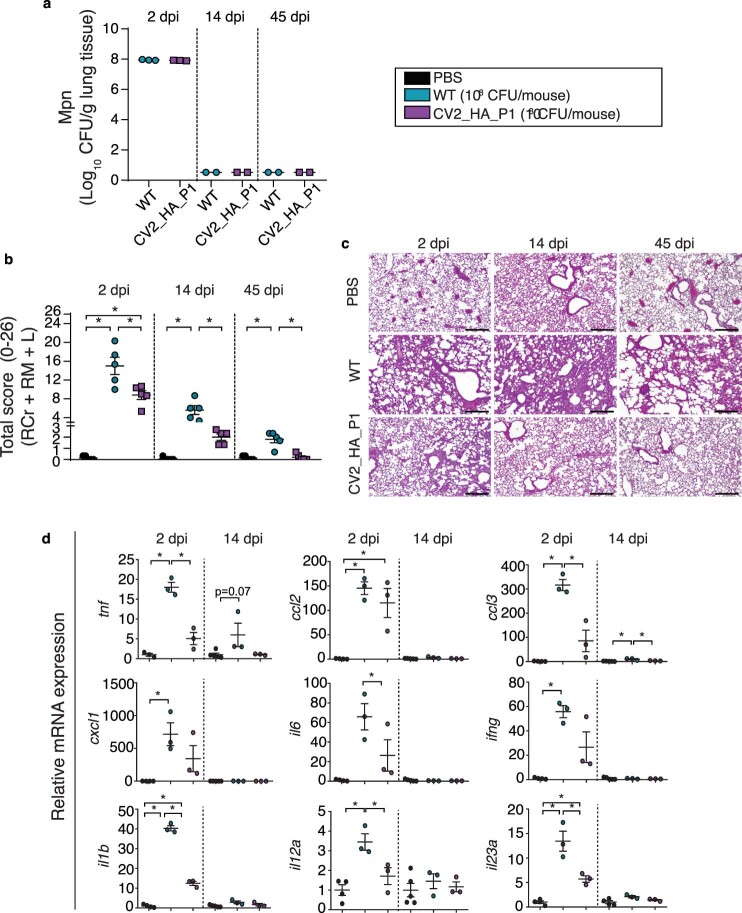
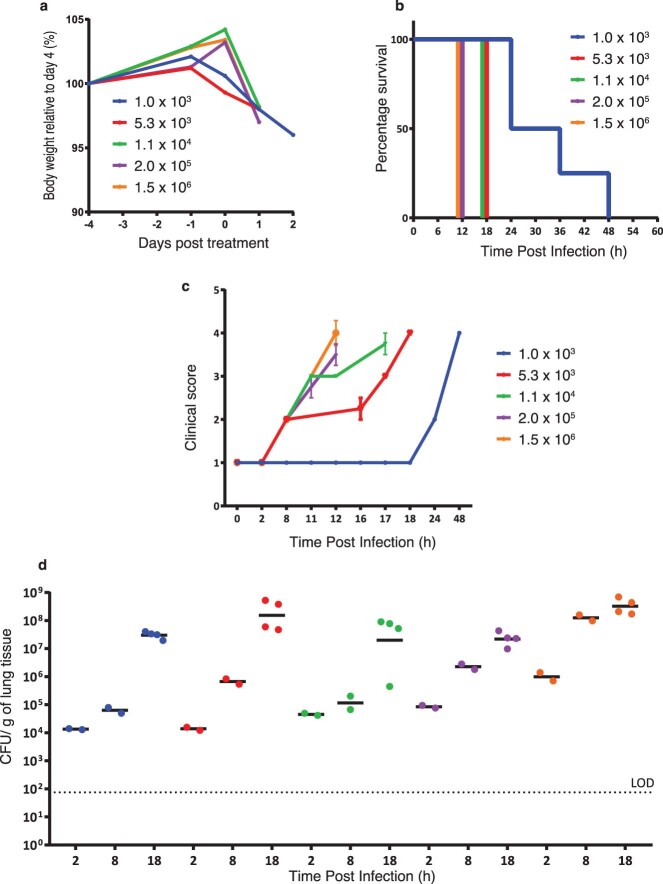
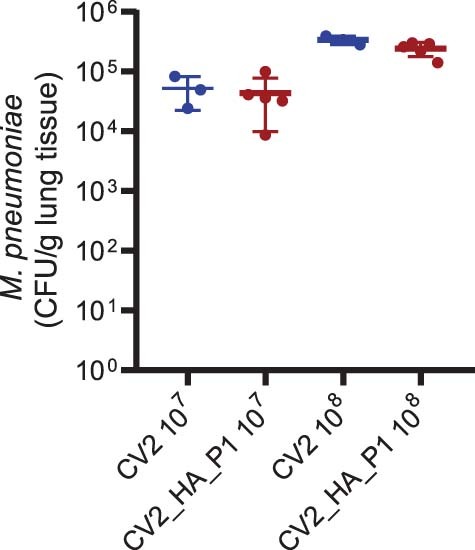
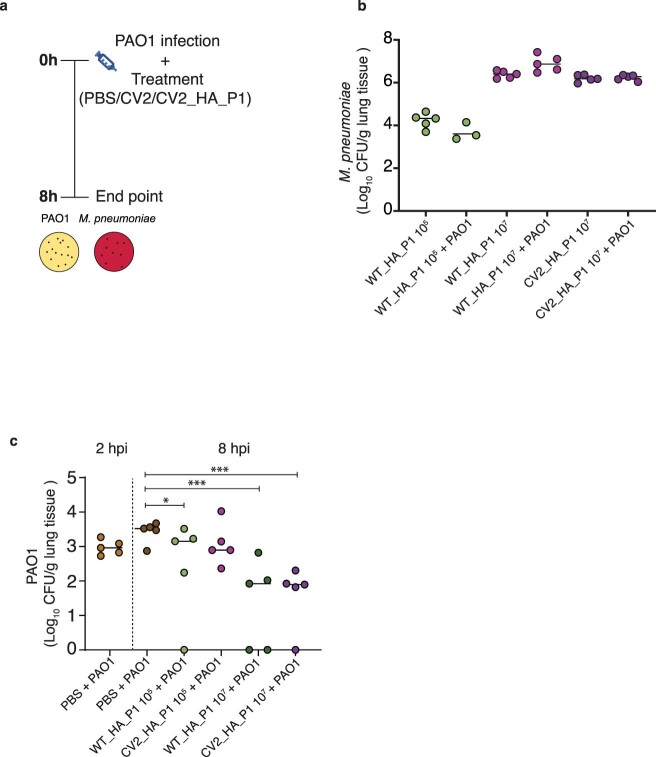
Engineered live bacteria could provide a new modality for treating lung infections, a major cause of mortality worldwide. In the present study, we engineered a genome-reduced human lung bacterium, Mycoplasma pneumoniae, to treat ventilator-associated pneumonia, a disease with high hospital mortality when associated with Pseudomonas aeruginosa biofilms. After validating the biosafety of an attenuated M. pneumoniae chassis in mice, we introduced four transgenes into the chromosome by transposition to implement bactericidal and biofilm degradation activities. We show that this engineered strain has high efficacy against an acute P. aeruginosa lung infection in a mouse model. In addition, we demonstrated that the engineered strain could dissolve biofilms formed in endotracheal tubes of patients with ventilator-associated pneumonia and be combined with antibiotics targeting the peptidoglycan layer to increase efficacy against Gram-positive and Gram-negative bacteria. We expect our M. pneumoniae-engineered strain to be able to treat biofilm-associated infections in the respiratory tract.


Conflict of interest statement

The results published in this article are covered by patents US10745450B2, EP3262061A1 and PCT/EP2021/057122 (licensed to Pulmobiotics S.L) and PCT/EP2021/059142. L.S. and M.L. are shareholders of Pulmobiotics S.L.. R.M., C.P. and M.L. are employees and have stock options of Pulmobiotics S.L. The remaining authors declare no competing interests.

Figures

Fig. 1
Fig. 1. Tissue lesions and inflammatory response of lungs infected with M. pneumoniae WT and CV2 strain.
CD1 mice (n = 5) were inoculated i.t. with M. pneumoniae CV2, WT or PBS (as control), and lungs were analyzed at 2, 14 and 45 d.p.i. a, Lung lesion evaluation, expressed as the total final score of the histological analysis performed on three major lobes. Each datapoint represents the average of the total score of the right cranial (RC), right middle (RM) and left lobes (L lobes). The mean values of each experimental group ± s.d. are indicated. *P < 0.05 by one-way ANOVA + Tukey’s multiple-comparison test. For a detailed description of the scoring system used in the histopathological analysis, see Methods. b, Representative H&E-stained lung sections (200×) from the left lobe. Scale bar, 100 µm. c, Gene expression of inflammatory markers, assessed by RT–qPCR. Data are shown as mean ± s.d. of 2−ΔΔCt. *P < 0.05 by one-way ANOVA + Tukey’s multiple-comparison test.
Fig. 2
Fig. 2. Biofilm dispersion activity of M. pneumoniae strains.
The activity of the supernatants from M. pneumoniae strains against biofilms of the indicated P. aeruginosa strains (SAT290, PAO1, Boston 41501, NCTC3437) was assessed by Crystal Volet assay. Briefly, Pseudomonas biofilms were generated by seeding in 96-well plates and incubating at 37 °C for 24 h. Biofilms were then treated at 37 °C for 4 h with M. pneumoniae supernatants to allow the activity of the dispersal enzymes. More details are given in Methods. a,b, Biofilm dispersal activity of the supernatants of M. pneumoniae strains expressing the indicated heterologous proteins, tested against biofilms of SAT290 (a) or PAO1 (b) strains. c, Biofilm dispersal activity of the supernatants of CV2 and CV2_HA. Data are shown as the mean of three independent experiments ± s.d. *P < 0.05, **P < 0.01 by two-sided Student’s t-test compared with the control strain. For details (for example, inoculum, growth and time), see Methods.
Fig. 3
Fig. 3. Biofilm dispersion and antimicrobial activities of the CV2_HA_P1 strain in vitro.
a, Biofilm dispersal activity of the supernatant of strains CV2 (dashed lines) or CV2_HA_P1 (solid lines), assessed by Crystal Violet assay. Pseudomonas biofilms were generated in 96-well plates at 37 °C for 24 h and then treated at 37 °C with the indicated supernatants. Data are shown as the mean of three independent experiments ± s.d. with three technical replicates at each timepoint. b, Growth curves of different P. aeruginosa strains treated with supernatants from CV2 or CV2_HA_P1. Absorbance of the culture (OD600) was measured every 20 min with a TECAN reader over 24 h. Errors bars indicate the s.d. of four replicates. For details (for example, inoculum, growth and time), see Methods.
Fig. 4
Fig. 4. Dispersion of biofilms of ETTs from patients with VAP.
a, Schematic representation of ETT slices from patients in the ICU who received MV. The 4-cm ETTs were taken from the distal part (for example, the first 10 cm closest to the patient’s lungs) and were sliced into four hemisections. One hemisection was used for each treatment arm: control (Hayflick medium alone without treatment), CV2_HA_P1 (~1 × 108 cells), C/T (5 µg ml−1) or CV2_HA_P1 + C/T. b, Effect on the P. aeruginosa load on ETT biofilm from patients who received MV (see Methods). Significant differences between groups were found: P = 0.049 by two-sided Kruskal–Wallis test. The median and the IQR load (log10(c.f.u. ml−1)) of each treatment group were: (1) control (n = 3): 7.51 (4.44–7.51); (2) C/T (n = 4): 0.77 (0.00–2.52); (3) CV2_HA_P1 (n = 4): 0.00 (0.00–0.52); and (4) CV2_HA_P1 + C/T (n = 3): 0.00 (0.00–0.00). The P values for pairwise comparisons between groups (Wilcoxon’s signed-rank test) are indicated when significant (*P < 0.05). The level of significance for pairwise comparisons was P = 0.008.
Fig. 5
Fig. 5. In vivo treatment of mice with acute respiratory PAO1 infection.
a, CD1 mice immunocompromised with cyclophosphamide and infected i.t. with 1 × 103 c.f.u. of P. aeruginosa PAO1. At 2 h.p.i., mice were treated i.t. with 1 × 107 (experiment (exp.) 1) or 1 × 108 (exp. 2 and 3) c.f.u. of CV2_HA_P1 M. pneumoniae strains or CV2 strain, or PBS. MPN: M. pneumoniae. At 26 h.p.i., mice were sacrificed to determine the PAO1 load in the lungs after the treatments (more details in Methods). b, Colony-forming units for P. aeruginosa PAO1 found in different treatment conditions. Three independent experiments were performed, indicated by different symbols in the graph: exp. 1 (blue circles), exp. 2 (red squares) and exp. 3 (green triangles). In each experiment, five mice were used per treatment group. Five additional mice were kept untreated and sacrificed to determine the PAO1 load in the lungs before the treatments (pretreatment control). ***P < 0.001 by two-sided Student’s t-test. c, Lung lesion evaluation (total score) of mice infected with PAO1 and treated with the indicated M. pneumoniae strains. *P < 0.05 by one-way ANOVA + Tukey’s multiple-comparison test. Histological analysis was performed on three major lobes (right cranial, right middle and left). See Methods for further detailed description of the scoring system used in the histopathological analysis. Below, representative H&E-stained lung sections (100×) from the left lobe. Scale bar, 100 µm. d, Relative gene expression of inflammatory markers, assessed by RT–qPCR of lung homogenates. Each animal used is marked as an individual dot (CV2, n = 4; CV2_HA_P1, n = 5). Data are shown as mean ± s.d. of 2−ΔΔCt. *P < 0.05 by two-sided Student’s t-test. e, Survival of mice infected with PAO1 and treated with CV2_HA_P1 or controls. *P = 0.0357 by Gehan–Breslow–Wilcoxon test with comparison to CV2 control. f, Lung lesions assessed by histological analysis of the lungs of the animals that survived until 8 d.p.i. (n = 5 for PBS + CV2_HA_P1 control; n = 2 for PAO1 + PBS and for PAO1 + CV2 groups; n = 3 for PAO1 + CV2_HA_P1 group). See Methods for details of the scoring. *P = 0.0189 by one-way ANOVA + Bonferroni’s test. Right, representative H&E-stained lung sections (100×) from the left lobe, obtained using a digital camera (MC170 HD, Leica) connected to an optical microscope (DM2000, Leica) using a commercial software (Leica Application Suite, v.4.6.0). Scale bar, 100 µm.
Extended Data Fig. 1
Extended Data Fig. 1. Delivery route and lung infection dynamic of M. pneumoniae WT and mutant strains generated in this study.
a, CFUs per lung (left) or BALF (right) in CD1 mice infected using the same dose (~1× 10⁷ CFU/mice), by intranasal (IN, 20 µl. Five animals) or intratracheal (IT, 100 µl. Six animals) administration. Mice were euthanized at 2 days post-infection (dpi) to determine bacterial load in lungs (left panel, log10 CFU/lung) and in BALF (right panel, log10 CFU/lung or BALF). Data are expressed as mean ± standard deviation (SD). Statistical comparison was performed using two-sided t-test. *P = 0.032. b, The WTΔmpn453 mutant strain is eliminated faster than the WT strain. Two-sided t-test was used (*P = 0.04 and P = 0.02). Data are expressed as mean ± standard deviation (SD). c, Lung infection dynamics of M. pneumoniae WT and CV2 chassis strains. Bacterial counts were obtained at 2 dpi (n = 15), 4 dpi (n = 15) or 14 dpi (n = 3) for both strains. Data are shown as means values ± SD of log10 CFU/lung. Statistical comparisons were performed using two-sided t-test. *P < 0.05. Red line, experimental detection limit (log10 CFU/lung = 0.7–0.9). Infections were performed in all cases in groups of at least five mice per strain and/or time point (n ≥ 5).
Extended Data Fig. 2
Extended Data Fig. 2. Analysis of the lungs of the animals inoculated with WT or CV2.
a, CFUs of the strains WT or CV2, at 2 or 14 days post-inoculation (dpi), found in three major lung lobes (RCr,right cranial; RM, right medium; and L, left. N = 3 animals per group). LOD = limit of detection. Data are expressed as mean ± SD. b, Scoring of the individual parameters analyzed in the histopathologic study of lung sections from mice inoculated with PBS, WT or CV2, analysed at 2, 14 or 45 dpi. See Methods for a detailed description of the histopathological scoring system used. Data are presented as mean values ± SD. Statistical comparisons were performed with One-way ANOVA + Tukey’s multiple comparison test; *P < 0.05. c, Pulmonary inflammatory response to M pneumoniae is independent of il1b, il6, il-12a or il23a. Gene expression was analysed by RT-qPCR at 2-, 4- and 45 dpi from lungs inoculated with PBS or with WT or CV2 M. pneumoniae strains. Data are presented as mean values ± SD. Each animal is represented as an individual plot (At 2 dpi: PBS n = 4; CV2 n = 5; CV2_HA_P1 n = 4; at 14 dpi, PBS n = 5; CV2 n = 4; CV2_HA_P1 n = 4 M; at 45 dpi: PBS n = 2; CV2 n = 4; CV2_HA_P1 n = 4).
Extended Data Fig. 3
Extended Data Fig. 3. Effect of CV2_HA on P. aeruginosa PAO1 biofilm and growth.
a, Dispersal activity of CV2_HA on PAO1 biofilm, quantified after staining with crystal violet or Alcian blue. Pseudomonas biofilms were generated by seeding in 96-well plates and incubating at 37 °C for 24 h. Biofilms were then treated at 37 °C for 4 h with M. pneumoniae CV2_HA supernatants, to allow the activity of the dispersal enzymes. The remaining biofilm was stained with crystal violet or Alcian blue and quantified with a plate reader at the indicated absorbances (OD 595 or OD 620). Three independent experiments performed. Data are presented as mean values ± SD. **P = 0.009 and P = 0.007, two-sided t-test. b. Activity of CV2_HA_P1 on PAO1 biofilm, quantified as CFUs/ml. Pseudomonas biofilms were generated by seeding in 96-well plates and incubating at 37 °C for 24 h. Biofilms were then treated at 37 °C for 4 h with the indicated supernatants, and then the remaining biofilm was resuspended in PBS and seeded on Pseudomonas agar plates. Three independent experiments performed. Data are presented as mean values ± SD. ***P < 0.001, two-sided t-test. c, Growth curves of P. aeruginosa strain PAO1 in presence of supernatant from CV2, CV2_HA or CV2_HA_P1. Results from triplicate samples are shown. Data are presented as mean values ± SD. Details of the assay are given in the Methods.
Extended Data Fig. 4
Extended Data Fig. 4. Study of effect of antibiotics on growth curves and biofilms formation.
a, Effect of treatment with the WT M. pneumoniae strain expressing pyocin L1 or pyocin S5 on the growth of the P. aeruginosa Boston 41501 strain. b, Growth curves of CV2 and different P. aeruginosa strains (SAT290, PAO1 or C117) in the presence of different doses of the antibiotic combination piperacillin/tazobactam. Growth was measured by absorbance determination at OD 430/560 or OD 600. c, Crystal violet assay measuring P. aeruginosa SAT290 biofilm degradation using different antibiotics at different concentrations. Two independent experiments performed. Data are presented as mean values ± SD. **P = 0.004, two-sided t-test. No significant effects on biofilm degradation were observed as compared to the untreated control. Details of the assays are given in the Methods.
Extended Data Fig. 5
Extended Data Fig. 5. Tissue lesions and inflammatory response of lungs infected with M. pneumoniae WT and CV2_HA_P1 strain at 108 CFUs.
CD1 mice were inoculated intratracheally with M. pneumoniae CV2_HA_P1, WT or PBS (as control), and lungs were analysed at 2-, 14- and 45 dpi. a, CFUs of the strains WT or CV2_HA_P1, at 2, 14 or 45 days post-inoculation (dpi) recovered in lungs (n = 3, 2 and 2, respectively). b, Lung lesions evaluation, expressed as the total final score of the histological analysis performed on three major lobes, with five animals per group (each data point is the average of the total score of the Right Cranial, Right Middle and Left of each animal). Data are presented as mean values of each group ± SD. *P < 0.05; One-way ANOVA + Tukey’s multiple comparison test. For detailed description of the scoring system used in the histopathological analysis, see Methods. c, Representative H&E-stained lung sections (100⋅, scale bar 100 µm) from the left lobe, obtained using a digital camera (MC170 HD, Leica) connected to an optical microscope (DM2000, Leica) using a commercial software (Leica Application Suite, version 4.6.0). d, Gene expression of inflammatory markers, assessed by RT-qPCR. Data are shown as mean ± SD of 2-ΔΔCt. Each animal is indicated as an individual plot. Each animal is represented as an individual plot (PBS, n = 4; CV2, n = 3; CV2_HA_P1, n = 3). *P < 0.05, One-way ANOVA + Tukey’s multiple comparison test.
Extended Data Fig. 6
Extended Data Fig. 6. Set up of acute model of P. aeruginosa infection.
CD1 mice were IT infected with different amounts of P. aeruginosa PAO1 (1.0× 10³, 5.3× 10³, 1.1× 10⁴, 2.0× 10⁵ or 1.5× 10⁶ CFU/mouse). a, Evaluation of body weight of mice infected with different doses of P. aeruginosa PAO1. b, Endpoints at which mice were euthanized by pentobarbitone overdose. c, Clinical score (see Methods) of the mice infected with different doses of P. aeruginosa PAO1 (Five animals per groups. Data are presented as mean values ± SD.). d, Number of CFUs recovered from the lung of mice after inoculation with different doses of PAO1 at different time points post-inoculation (2, 8 or 18 hpi. N = two or four animals per group, as indicated by the data points). LOD = Limit of detection.
Extended Data Fig. 7
Extended Data Fig. 7. M. pneumoniae CFUs detected in lungs of animals of the efficacy assays.
Number of CFUs of M. pneumoniae strains CV2 and CV2_HA_P1 strains (inoculated at 1× 10⁷ or 1× 10⁸ CFU/mouse) recovered from the lung at 24 hpi. Animals (n = 3 for CV2 controls, and n = 5 for CV2_HA_P1 group) were sacrificed and the lungs were homogenized and serial diluted on Hayflick-agar plates. Data are presented as mean values ± SD.
Extended Data Fig. 8
Extended Data Fig. 8. Preventive effect of CV2_HA_P1 on pneumonia induced by PAO1.
a, Schematic representation of the experimental design. Two amounts (1× 10⁵ or 1× 10⁷ CFU) of different M. pneumoniae strains, alone or in combination with P. aeruginosa PAO1 cells, were inoculated intratracheally in the animals (five animals per group). After 8 h, mice were sacrificed, and lungs were homogenized and seeded on Hayflick agar plates to quantify the CFU of M. pneumoniae strains (in b) or seeded on Pseudomonas agar to quantify PAO1 (in c). *P < 0.05, ***P < 0.001; P values of Kruskal–Wallis H test compared to the control at 8 h are indicated.

Comment in

References

    1. Wang S, Gao Y, Jin Q, Ji J. Emerging antibacterial nanomedicine for enhanced antibiotic therapy. Biomater. Sci. 2020;8:6825–6839. doi: 10.1039/D0BM00974A. - DOI - PubMed
    1. Helaly AMN, El-Attar YA, Khalil M, Ahmed Ghorab DSE-D, El- Mansoury AM. Antibiotic abuse induced histopathological and neurobehavioral disorders in mice. Curr. Drug Saf. 2019;14:199–208. doi: 10.2174/1574886314666190612130921. - DOI - PMC - PubMed
    1. Høiby N, Bjarnsholt T, Givskov M, Molin S, Ciofu O. Antibiotic resistance of bacterial biofilms. Int. J. Antimicrob. Agents. 2010;35:322–332. doi: 10.1016/j.ijantimicag.2009.12.011. - DOI - PubMed
    1. Obst U, Schwartz T, Volkmann H. Antibiotic resistant pathogenic bacteria and their resistance genes in bacterial biofilms. Int. J. Artif. Organs. 2006;29:387–394. doi: 10.1177/039139880602900408. - DOI - PubMed
    1. Smith AW. Biofilms and antibiotic therapy: is there a role for combating bacterial resistance by the use of novel drug delivery systems? Adv. Drug Deliv. Rev. 2005;57:1539–1550. doi: 10.1016/j.addr.2005.04.007. - DOI - PubMed

Publication types

Substances