. 2023 Sep;41(9):1229-1238.
doi: 10.1038/s41587-022-01637-z. Epub 2023 Jan 19.

Precision targeting of autoantigen-specific B cells in muscle-specific tyrosine kinase myasthenia gravis with chimeric autoantibody receptor T cells

Affiliations

Precision targeting of autoantigen-specific B cells in muscle-specific tyrosine kinase myasthenia gravis with chimeric autoantibody receptor T cells

Sangwook Oh et al. Nat Biotechnol. 2023 Sep.

Erratum in

Abstract

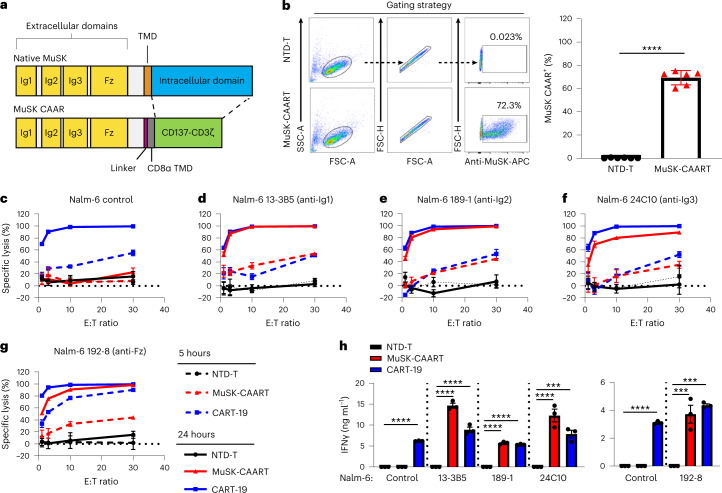
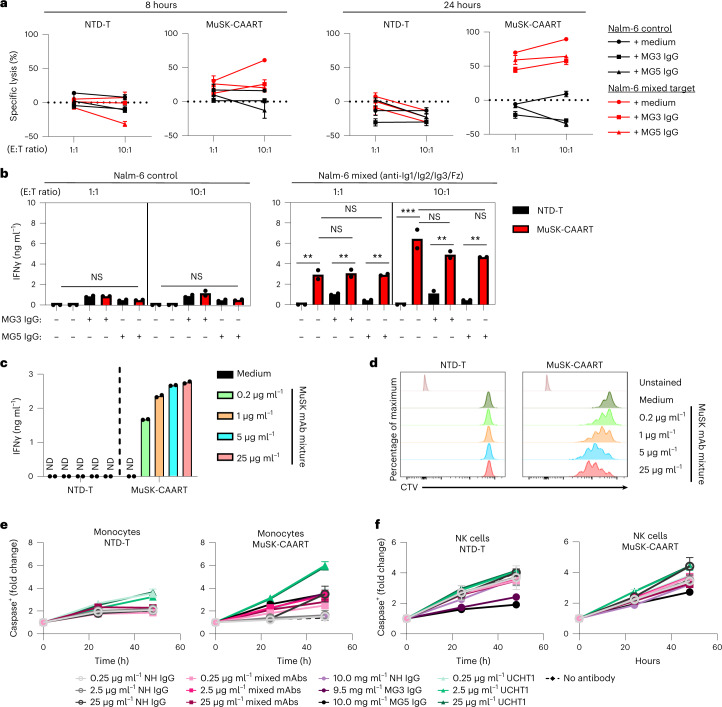
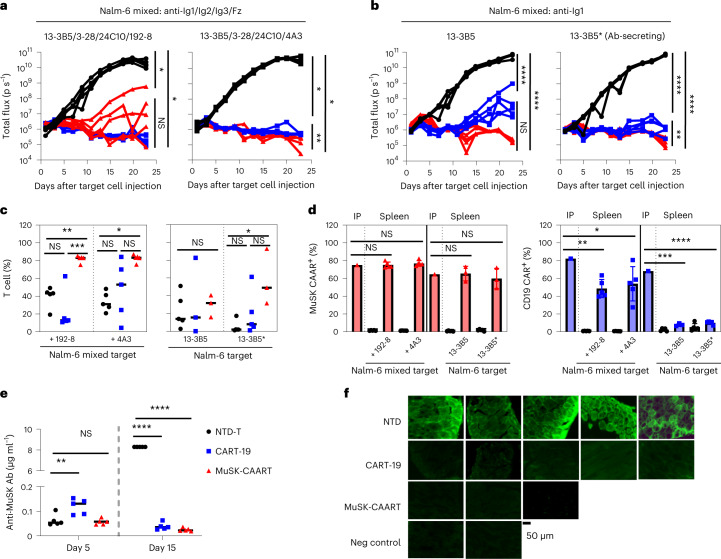
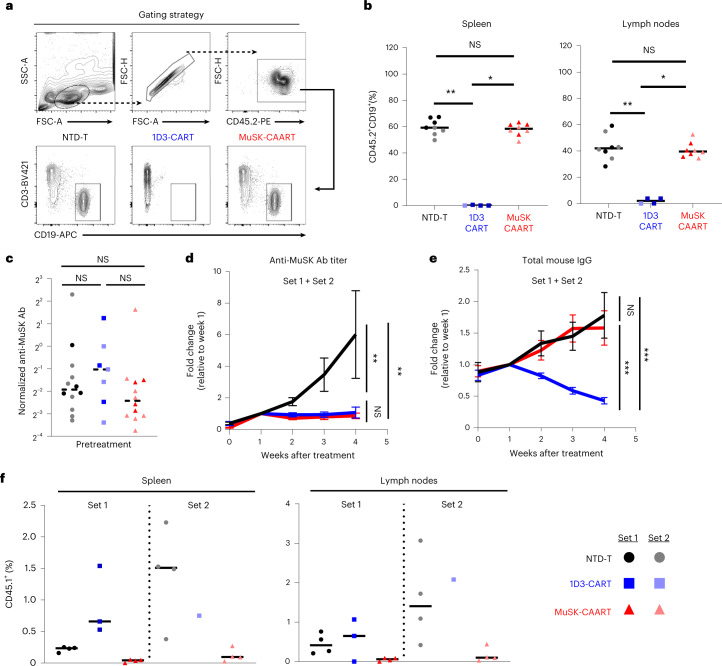
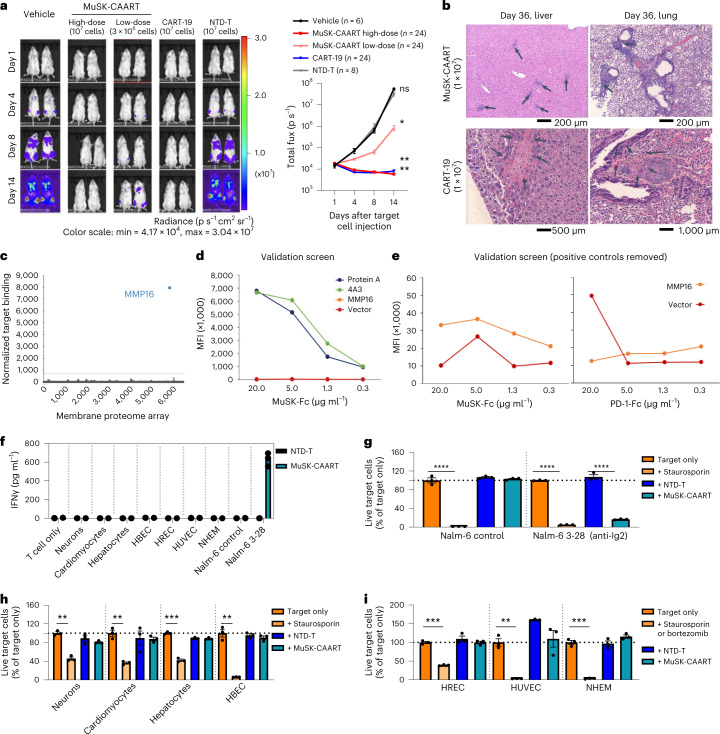
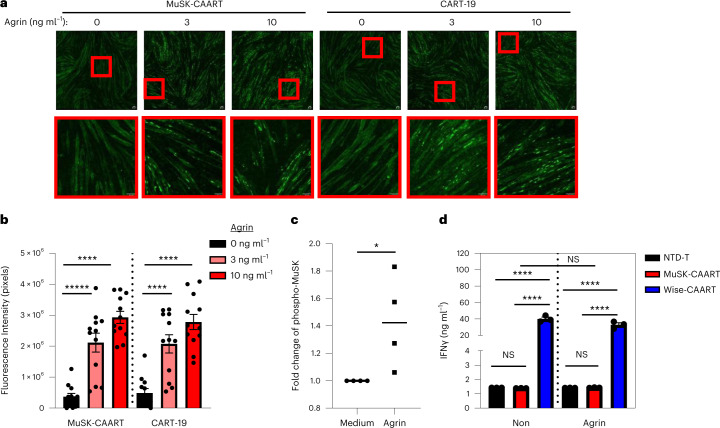
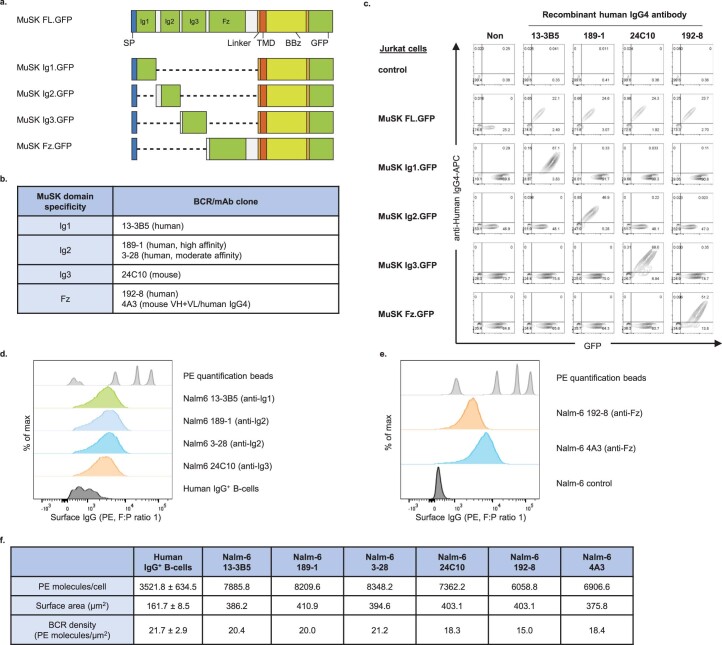
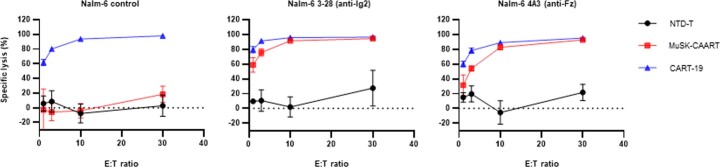
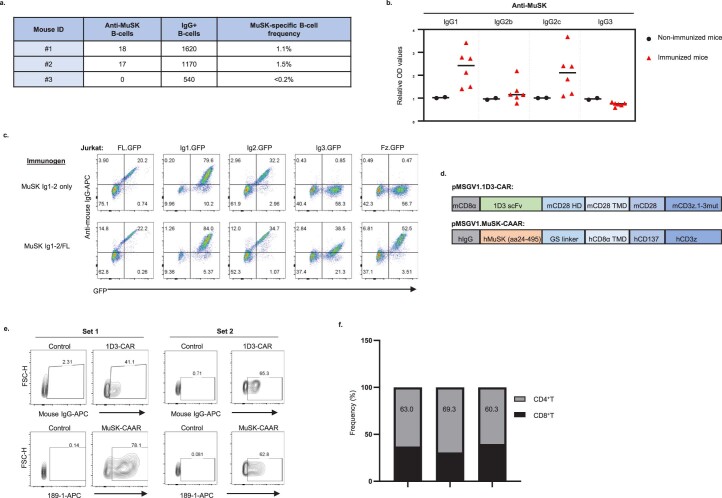
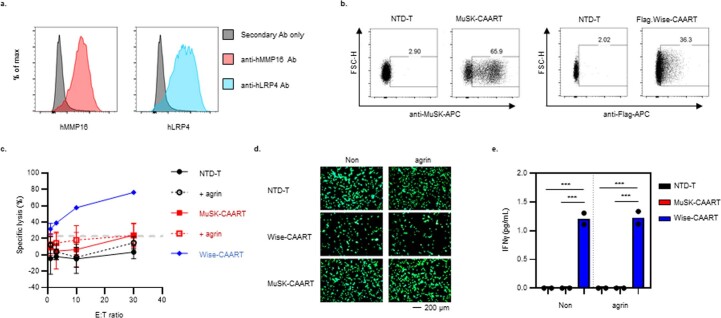
Muscle-specific tyrosine kinase myasthenia gravis (MuSK MG) is an autoimmune disease that causes life-threatening muscle weakness due to anti-MuSK autoantibodies that disrupt neuromuscular junction signaling. To avoid chronic immunosuppression from current therapies, we engineered T cells to express a MuSK chimeric autoantibody receptor with CD137-CD3ζ signaling domains (MuSK-CAART) for precision targeting of B cells expressing anti-MuSK autoantibodies. MuSK-CAART demonstrated similar efficacy as anti-CD19 chimeric antigen receptor T cells for depletion of anti-MuSK B cells and retained cytolytic activity in the presence of soluble anti-MuSK antibodies. In an experimental autoimmune MG mouse model, MuSK-CAART reduced anti-MuSK IgG without decreasing B cells or total IgG levels, reflecting MuSK-specific B cell depletion. Specific off-target interactions of MuSK-CAART were not identified in vivo, in primary human cell screens or by high-throughput human membrane proteome array. These data contributed to an investigational new drug application and phase 1 clinical study design for MuSK-CAART for the treatment of MuSK autoantibody-positive MG.


Conflict of interest statement

S.O. is involved with patent licensing from Cabaletta Bio. J.L., D.P., A.A., E.C.-T., U.H., G.K.B. and S.B. are employed by Cabaletta Bio. C.T.E. is involved with equity and patent licensing from Cabaletta Bio and patent licensing from Novartis. S.L.K. is a consultant for Catalyst, Alexion and Argenx. D.P.R. obtained a research grant from Cabaletta Bio. K.C.O. is involved with equity and obtained a research grant from Cabaletta Bio; is involved with research support, is a consultant and has received speaker fees from Alexion/AstraZeneca; has provided research support and received speaking fees from Viela Bio/Horizon Therapeutics; and is a consultant for and has received speaking fees from Roche and received speaking fees from Genentech and UCB. M.C.M. is involved with equity and has received payment, a research grant and patent licensing from Cabaletta Bio, as well patent licensing from Novartis and Tmunity, and is involved with equity and has received patent licensing from Verismo. A.S.P. is involved with equity, has received payment, research grant and patent licensing from Cabaletta Bio and patent licensing from Novartis, and is a consultant to Janssen. X.M., S.M.-V., E.J.C., D.M. and P.Y.T. declare no competing interests.

Figures

Fig. 1
Fig. 1. MuSK-CAAR expression on primary human T cells directs specific cytolysis of anti-MuSK B cells that target unique epitopes.
a, Native MuSK is a transmembrane tyrosine kinase whose ectodomain comprises three immunoglobulin-like (Ig1–Ig3) and frizzled-like (Fz) domains. MuSK-CAAR comprises the native MuSK ectodomain, followed by a glycine/serine-rich linker, CD8α transmembrane domain (TMD) and CD137-CD3ζ intracellular costimulatory and activation domains. b, Primary human T cells were transduced with MuSK-CAAR lentivirus or NTD-T, and MuSK-CAAR expression was detected using anti-MuSK 4A3 or 189-1 antibody. MuSK-CAAR+ transduction efficiency in six different donor T cell batches (NTD-T and MuSK-CAART). Error bars indicate mean ± s.d. Unpaired t-test (two-tailed). cg, Cytolysis of wild-type (control) Nalm-6 cells (c) and Nalm-6 anti-MuSK target cells 13-3B5/anti-Ig1 (d), 189-1/anti-Ig2 (e), 24C10/anti-Ig3 (f) and 192-8/anti-Fz (g) was measured using a luciferase-based cytotoxicity assay at 5 h (dashed line) and 24 h (solid line) after coculture with NTD-T (black), MuSK-CAART (red) and CART-19 (blue). The effector to target (E:T) ratio is based on total T cell number. h, Human IFNγ was measured in NTD-T, MuSK-CAART or CART-19 coculture supernatants (10:1 E:T, 24 h, experiments run using different T cell batches are shown in separate plots). One-way analysis of variance (ANOVA) with the Holm–Sidak test for multiple comparisons. For ch, error bars indicate mean ± s.d. of triplicate cocultures and are representative of 2–4 independent experiments. NS, P > 0.05; *P < 0.05; ***P < 0.001; ****P < 0.0001. Source data
Fig. 2
Fig. 2. Evaluation of soluble anti-MuSK antibody effects on MuSK-CAART cytotoxicity, IFNγ production and proliferation.
a, NTD-T and MuSK-CAART were coincubated with Nalm-6 control or mixed target cells (13-3B5/3-28/24C10/192-8 (anti-Ig1/Ig2/Ig3/Fz)) at 1:1 or 10:1 E:T ratios in the presence of purified IgGs (10 mg ml−1) from two patients with MuSK MG (MG3 and MG5; details in Methods) or medium alone. Cytotoxicity was evaluated at 8 and 24 h using a luciferase-based cytotoxicity assay. Error bars indicate mean ± s.d. of triplicates. b, Human IFNγ was measured in NTD-T or MuSK-CAART coculture supernatants (24 h) in two independent experiments. Two-way ANOVA with Tukey’s test for multiple comparisons: NS, P > 0.05; **P < 0.01; ***P < 0.001. c,d, NTD-T and MuSK-CAART were incubated with an equimolar mixture of anti-MuSK IgG4 mAbs (13-3B5/3-28/24C10/192-8 (anti-Ig1/Ig2/Ig3/Fz), total mAb concentration shown) and human IFNγ was quantitated by ELISA after 24 h in duplicated samples (c), or proliferation of NTD-T and MuSK-CAART was evaluated using CTV dye dilution by flow cytometry at 96 h (d). Representative flow plots from two individual experiments are shown. e,f, NTD-T or MuSK-CAART were coincubated with monocytes (e) or NK cells (f) at a 5:1 E:T ratio in the presence of normal human IgG, mixed anti-MuSK mAbs (13-3B5/3-28/192-8 (anti-Ig1/Ig2/Fz), total mAb concentration shown), purified polyclonal IgG from plasma from patients with MuSK MG (MG3 and MG5) or an anti-CD3 positive-control mAb (clone UCHT1) for 48 h. Monocyte/NK cell death was detected by incorporation of caspase-3/7 dye over time. Fold change of caspase+ cells relative to the 0 hour timepoint is plotted. Error bars indicate mean ± s.d. of triplicates. Source data
Fig. 3
Fig. 3. Targeting of anti-MuSK B cells through the BCR with MuSK-CAART demonstrates comparable efficacy as anti-CD19 CAR-mediated cytolysis, in the presence or absence of soluble anti-MuSK antibody.
a,b, Total flux (p s−1, photons per second) after injection of 1:1:1:1 mixed 13-3B5/3-28/24C10/192-8 or 13-3B5/3-28/24C10/4A3 (anti-Ig1/Ig2/Ig3/Fz) (a), 13-3B5 (anti-Ig1) or 13-3B5* (anti-Ig1, antibody-secreting) Nalm-6 cells (b), followed 4 days later by treatment with 1 × 107 NTD-T (black, n = 5), CART-19 (blue, n = 5) or MuSK-CAART (red, n = 5). Bioluminescence images appear in Extended Data Fig. 6a. One-way ANOVA with the Holm–Sidak test for multiple comparisons, day 23. c,d, Splenocytes were analyzed on days 24 or 25 after target cell injection for CD3+ T cell frequency (c) (median values are indicated; Kruskal–Wallis test with Dunnett’s test for multiple comparisons), and percentage of MuSK-CAAR+ and anti-CD19 CAR+ T cells relative to the infusion product (IP) (d). Error bars indicate mean ± s.e.m. One-sample t-test. Two MuSK-CAART-treated mice in Nalm-6 13-3B5/13-3B5* and two CART-19-treated mice in Nalm-6 13-3B5 experiments that were used for long-term follow-up were excluded from analysis. e, Anti-MuSK antibody titer in blood samples was measured on days 5 and 15 after target cell injection and quantitated relative to a 13-3B5 IgG4 mAb standard. Two-way ANOVA with Dunnett’s test for multiple comparisons. f, Direct immunofluorescence analysis of diaphragm muscle harvested on day 25, stained with antihuman IgG to detect 13-3B5 IgG4 binding to MuSK on the muscle cell surface. Diaphragms from 13-3B5/NTD-T-treated mice served as a negative control. Scale bar, 50 µm. Representative images are shown from two independent staining experiments. NS, P > 0.05; *P < 0.05; **P < 0.01; ***P < 0.001; ****P < 0.0001. Source data
Fig. 4
Fig. 4. MuSK-CAART reduces anti-MuSK IgG but not total IgG or B cell counts in a syngeneic MuSK EAMG model.
CD45.2+ C57BL/6J mice were immunized with MuSK Ig1-2 protein (30 μg in complete Freund’s adjuvant) on day 0 and boosted with MuSK Ig1-Fz protein (30 μg in incomplete Freund’s adjuvant) on day 26. Results of two independent experiments are shown (total numbers NTD-T, n = 12, 1D3-CART, n = 8, MuSK-CAART, n = 12). Equivalent numbers of transduced CD45.1+ T cells or a matching number of NTD CD45.1+ cells were injected on day 35. a,b, Host B cells (CD45.2+CD3-CD19+) were analyzed in spleen and lymph nodes at days 49–63 (2–4 weeks after treatment). Representative flow plot (a) and the frequency of CD45.2+CD19+ B cells in the spleen and lymph nodes (b) are shown. Kruskal–Wallis test with Dunnett’s test for multiple comparisons. c, Anti-MuSK antibody titer was measured in individual mouse blood samples drawn on the day of treatment, normalized to 4A3 mouse antihuman MuSK mAb standard (µg ml−1). Kruskal–Wallis with Dunnett’s test for multiple comparisons. d,e, Anti-MuSK antibody titer and total mouse IgG were measured in mouse blood samples drawn weekly after treatment. Graphs indicate fold change of anti-MuSK antibody titer (d) or total mouse IgG (e) relative to week 1 after treatment (NTD-T, n = 8; 1D3-CART, n = 7 (d) and n = 6 (e); MuSK-CAART, n = 8 to include all mice with longitudinal samples through week 4 after treatment; one 1D3-CART mouse was excluded in e due to low blood sample volume precluding analysis). Error bars indicate mean ± s.e.m. Multiple linear regression-coefficient test for difference between the slopes. f, Frequency of CD45.1+ T cells were analyzed in the spleen and lymph nodes on day 49–63. Statistical analysis was not performed since absolute number of CD45.1+ T cells varied among treatment groups to achieve the same transduced cell dose in set 1. NS, P > 0.05; *P < 0.05; **P < 0.01; ***P < 0.001. Source data
Fig. 5
Fig. 5. Off-target cytotoxic interactions of MuSK-CAART were not identified in mouse tissue or using human MPAs.
a, Representative bioluminescence images from the MuSK-CAART biodistribution study in mice injected with 3-28/anti-Ig2 Nalm-6 cells, then treated with vehicle only (n = 6), NTD-T (n = 8), CART-19 (n = 24) or MuSK-CAART (high- and low-dose, n = 24 per each dose). Graph indicates total bioluminescence flux for all mice in each treatment group. Error bars indicate mean ± s.e.m. One-way ANOVA with the Holm–Sidak test for multiple comparisons, day 14. b, Example images from liver and lung on day 36 after treatment (MuSK-CAART, n = 8; CART-19, n = 8). Liver and lung sections from high-dose MuSK-CAART-treated mice show lymphocytic infiltration without cytotoxic effect (black arrows). CART-19-treated mice demonstrated focal hepatocellular necrosis and focal pulmonary thrombus (black arrows). c, Human MPA screened with MuSK-Fc protein identified a potential binding signal with MMP16. d, MuSK-Fc binding to MMP16 demonstrated low mean fluorescence intensity (MFI) relative to protein A and anti-MuSK 4A3 positive controls in validation screening (MMP16 curve overlaps with vector control). A representative graph from two validation screens is shown in e. e, Positive controls are removed in validation screens shown in d and the y axis is rescaled. One of two validation screens confirmed MuSK-Fc binding to MMP16, defined as MFI at least twofold higher than isotype (PD-1-Fc) control at two or more concentrations. fi, Cytotoxicity of MuSK-CAART from two donor T cell batches was measured after coincubation for 24 hours (5:1 E:T ratio) with Nalm-6 wild-type (negative control), Nalm-6 3-28/anti-Ig2 (positive control) or seven primary human cell types from each of two different donors. Representative results are shown. IFNγ production was not detected in MuSK-CAART cocultures with primary human cells (f). Viability was analyzed using high-content imaging analysis (HCA) for Nalm-6 control and anti-MuSK 3-28 cells (g) and human-derived cells (h) or by flow cytometry (i) at 24 hours, using staurosporin or bortezomib as toxicity controls. Error bars indicate mean ± s.d. of triplicates (fi). Multiple t-test (two-tailed), Holm–Sidak correction for multiple comparisons. NS, P > 0.05; *P < 0.05; **P < 0.01; ***P < 0.001; ****P < 0.0001. Source data
Fig. 6
Fig. 6. MuSK-CAART off-target effects on muscle are not observed.
a, Effects of MuSK-CAART or CART-19 (E:T 10:1) on agrin-induced AChR clustering in C2C12 mouse myotubes were visualized by α-bungarotoxin staining (×25 magnification, top row, plus bottom inset (red boxes); scale bar, 50 µm). Representative images are shown from two individual experiments. b, AChR clustering was quantitated by fluorescence intensity, measured at six different sites in each image (error bars indicate mean ± s.e.m.). One-way ANOVA with the Holm–Sidak test for multiple comparisons. c, Differentiated primary human myotubes were incubated with agrin (5 ng ml−1) or medium alone. Agrin-induced MuSK phosphorylation was confirmed by phospho-MuSK ELISA. OD450/570 value relative to medium-alone control is shown. Mann–Whitney U-test (two-tailed). d, Human myotubes were coincubated with NTD-T, MuSK-CAART or Wise-CAART in the presence or absence of agrin for 24 hours. IFNγ production was measured in cell-culture supernatants by ELISA. Error bars indicate mean ± s.d. of triplicates. One-way ANOVA with the Holm–Sidak test for multiple comparisons. NS, P > 0.05; *P < 0.05; ****P < 0.0001. Source data
Extended Data Fig. 1
Extended Data Fig. 1. Anti-MuSK target cell characterization.
a) Schematic diagram of individual MuSK domain CAARs with a cytoplasmic linker to green fluorescent protein (GFP), generated for epitope mapping. FL, full-length; SP, signal peptide; TMD, transmembrane domain; BBζ, CD137(4-1BB)-CD3ζ. b) Summary of recombinant anti-MuSK B cell receptor (BCR) or mAb specificities. c) MuSK domain CAAR+ Jurkat cells were stained with anti-MuSK mAbs to confirm the domain mapping. d, e) BCRs in primary human IgG+ B cells and Nalm-6 cells expressing each MuSK domain-specific BCR were stained with PE mouse anti-human IgG. f) BCR density was calculated by dividing the number of PE molecules/cell by the surface area (μm2). Mean ± standard deviation of IgG+ B-cells from three individual experiments is shown.
Extended Data Fig. 2
Extended Data Fig. 2. MuSK-CAAR directs specific cytolysis of anti-MuSK B-cells.
NTD-T cells, anti-CD19 CART (CART-19), and MuSK-CAART were co-incubated with Nalm-6 control, Nalm-6 3−28 (anti-MuSK Ig2), and Nalm-6 4A3 (anti-MuSK Fz) cell lines at indicated E:T ratios. Cytotoxicity was evaluated at 24 hours using a luciferase-based assay. Error bars indicate mean ± standard deviation of triplicates.
Extended Data Fig. 3
Extended Data Fig. 3. Relative titers of anti-MuSK mAbs and MG IgG.
Anti-MuSK antibody titer was evaluated using a Luminex-based assay. Recombinant anti-MuSK mAbs (a) or purified IgG from two MuSK MG patients (MG3 and MG5) (b) were incubated with MuSK ectodomain-coupled microspheres and stained with anti-human IgG-biotin. Mean fluorescence intensity (MFI) was normalized per 50 beads. Error bars indicate mean ± SEM of duplicates.
Extended Data Fig. 4
Extended Data Fig. 4. Evaluation of soluble anti-MuSK monoclonal antibody effects on MuSK-CAART cytotoxicity, IFNγ production, and proliferation.
a) Non-transduced T cells (NTD-T) or MuSK-CAART were co-incubated with Nalm-6 control or individual MuSK domain-specific Nalm-6 target cells at an E:T ratio of 10:1 in the absence (0 μg/mL) or presence of matching soluble anti-MuSK IgG4 mAb at 1.25 or 6.25 μg/mL, in a total of 10 mg/mL normal human IgG. Cytotoxicity was evaluated at 24 hours using a luciferase-based assay. Error bars indicate mean ± standard deviation of triplicates. b) NTD-T or MuSK-CAART cells were incubated with each anti-MuSK IgG4 mAb (0.2, 1, 5, or 25 μg/mL) and human IFNγ was quantitated by ELISA in cell culture supernatants after 24 hours. Error bars indicate mean ± standard deviation of triplicates. c) Proliferation of NTD-T (top) and MuSK-CAART (bottom) was evaluated 96 hours after the addition of the indicated anti-MuSK mAbs using Cell Trace Violet (CTV) cellular labeling dye dilution by flow cytometry. (a-c) Representative plots from two (b,c) or three (a) individual experiments using different donor T-cells are shown.
Extended Data Fig. 5
Extended Data Fig. 5. Generation and validation of 13-3B5* antibody-secreting Nalm-6 cells.
a) Nalm-6 13-3B5* anti-Ig1 antibody-secreting cells were generated by transducing soluble 13-3B5/anti-Ig1 antibody heavy chain plasmid into Nalm-6 13-3B5 BCR−expressing cells. Jurkat cells expressing individual MuSK extracellular domains linked with GFP were stained with cell-culture supernatants from Nalm-6 13-3B5* for epitope mapping. Soluble 13-3B5 antibody binding was detected using anti-human IgG4-APC. b, c) Nalm-6 13-3B5 (red) and Nalm-6 13-3B5* (green) were stained with PE-conjugated mouse anti-human IgG to quantify BCR density. The mean fluorescence intensity of BCR expression is shown by histogram (b) and bar graph (c). d) Nalm-6 13-3B5 or Nalm-6 13-3B5* cells were co-incubated with either NTD-T or MuSK-CAART cells at indicated E:T ratios for 8 hours. MuSK-CAART cytotoxicity was measured using a luciferase-based assay. Error bars indicate mean ± standard deviation of triplicates.
Extended Data Fig. 6
Extended Data Fig. 6. Evaluation of Nalm-6 outgrowth in a subset of MuSK-CAART-treated mice.
a, b) Bioluminescence images from Fig. 3a, b. c) Enlarged bioluminescence image from (a, red box). d, e) T-cell and Nalm-6 cell percentage in the cranial bone marrow in NTD-T treated mice (n = 2) and MuSK-CAART treated mice (n = 5) were analyzed by flow cytometry. f) Representative plot showing the mean fluorescence intensity (MFI) of IgG BCR expression in residual Nalm-6 cells (dotted line indicates cutoff for positive surface IgG expression). g) Graphs indicate the percent of residual Nalm-6 cells that are IgG BCR + and the MFI of IgG BCR expression in residual Nalm-6 cells in NTD-T (n = 2) and MuSK-CAART (n = 3) treated mice. Error bars indicate mean ± SEM. Unpaired t-test (two-tailed): ns, p > 0.05; *, p < 0.05; **, p < 0.01. Source data
Extended Data Fig. 7
Extended Data Fig. 7. Immunologic characterization of the MuSK EAMG syngeneic MuSK-CAART treatment model.
a) Splenocytes were harvested from select MuSK-immunized mice, and purified B-cells were evaluated using a MuSK-specific and total IgG B-cell ELISpot assay to quantitate the MuSK-specific B-cell frequency. Dots from duplicated wells were summarized after normalization with seeded cells (dots per 100,000 cells). MuSK-specific B-cell frequency is calculated by dividing anti-MuSK B-cells by total IgG+ B-cells. b) IgG subclasses of anti-MuSK antibodies were detected in sera from MuSK-immunized mice in reference to sera from negative controls (non-immunized C57BL/6 and Rag2IL2rγ-deficient mice) and median value was plotted. c) Epitope mapping of serum from a mouse immunized and boosted with MuSK Ig1-Ig2, or MuSK Ig1-Ig2 followed by MuSK full length (FL) boost, using Jurkat CAAR T-cells expressing individual MuSK domain CAARs linked to GFP. Representative FACS plots are shown from three independent experiments. d) Schematic of pMSGV1-1D3-CAR (mouse CD8α signal peptide, 1D3 anti-mouse CD19 single chain variable fragment (scFv), mouse CD28 hinge (HD)/transmembrane domain (TMD)/costimulatory domain, and a mouse CD3ζ.1-3mut domain to confer enhanced persistence. Schematic of pMSGV1-MuSK-CAAR (human MuSK extracellular domains (amino acids 24-495), glycine-serine (GS) linker, hCD8α TMD, and human CD137-CD3ζ). e, f) Transduction efficiency of 1D3-CAR and MuSK-CAAR in primary mouse T-cells (Set 1 and Set 2) and g) percentage of CD4+/CD8+ T-cells in Set 1 was evaluated on day 4 after T-cell activation (one day prior to injection).
Extended Data Fig. 8
Extended Data Fig. 8. Off-target cytotoxicity of MuSK-CAART against MMP16+LRP4+ U87-MG cells was not detected.
a) LRP4 (blue) and MMP16 (red) expression in U87-MG cells was confirmed using flow cytometry. b) MuSK-CAAR and Flag-tagged Wise-CAAR expression were confirmed in primary human T-cells. c) Luciferase+ U87-MG cells were co-incubated with human T-cells at the indicated E:T ratio in the presence (dashed line) or absence (solid line) of agrin. Cytotoxicity was measured using a luciferase-based killing assay. Error bars indicate mean ± standard deviation from two individual experiments (NTD-T, n = 5; NTD-T+ agrin, n = 4; MuSK-CAART, n = 5; MuSK-CAART+ agrin, n = 5; Wise-CAART, n = 2). d) U87-MG cells were stained with Calcein-AM before co-culture with T-cells. Viable cells (GFP+) were detected by fluorescence microscopy at 16 hours after co-culture with T-cells in the presence or absence of agrin. Representative images are shown from two individual experiments. e) Human IFNγ production was detected by ELISA in 16-hour co-culture supernatants from two individual experiments. One-way ANOVA with Holm-Sidak test for multiple comparisons: ***, p < 0.001. Source data

References

    1. Rodriguez Cruz, P. M., Cossins, J., Beeson, D. & Vincent, A. The neuromuscular junction in health and disease: molecular mechanisms governing synaptic formation and homeostasis. Front. Mol. Neurosci.13, 610964 (2020). - PMC - PubMed
    1. Stathopoulos, P. et al. Mechanisms underlying B cell immune dysregulation and autoantibody production in MuSK myasthenia gravis. Ann. N. Y. Acad. Sci.1412, 154–165 (2018). - PMC - PubMed
    1. Borges, L. S. & Richman, D. P. Muscle-specific kinase myasthenia gravis. Front. Immunol.11, 707 (2020). - PMC - PubMed
    1. Kim, N. et al. Lrp4 is a receptor for Agrin and forms a complex with MuSK. Cell135, 334–342 (2008). - PMC - PubMed
    1. Zhang, B. et al. LRP4 serves as a coreceptor of agrin. Neuron60, 285–297 (2008). - PMC - PubMed

Publication types