. 2023 Sep;41(9):1320-1331.
doi: 10.1038/s41587-022-01628-0. Epub 2023 Jan 19.

Genome-scale metabolic reconstruction of 7,302 human microorganisms for personalized medicine

Affiliations

Genome-scale metabolic reconstruction of 7,302 human microorganisms for personalized medicine

Almut Heinken et al. Nat Biotechnol. 2023 Sep.

Abstract

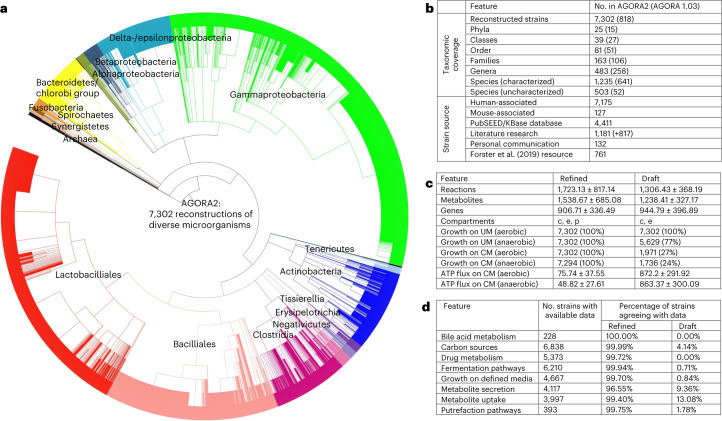
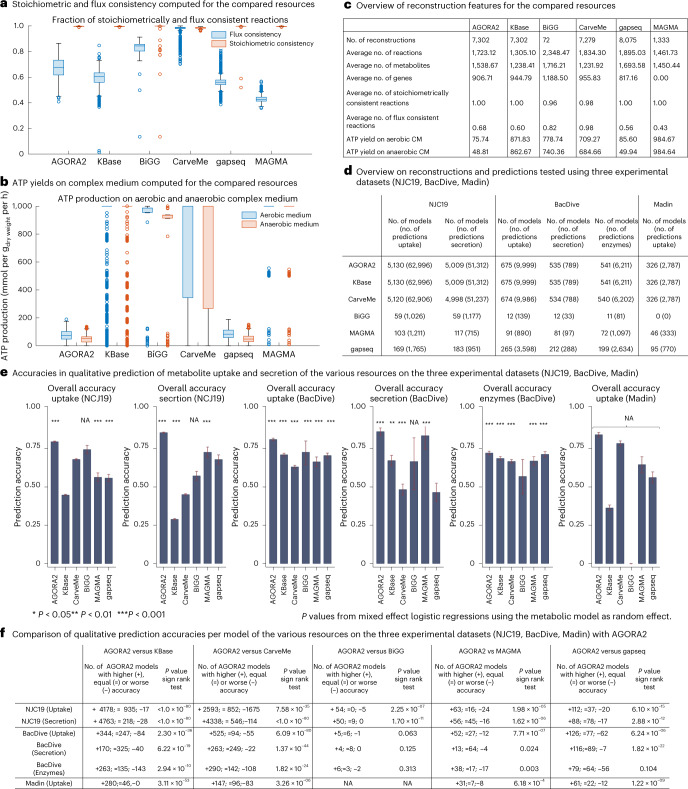
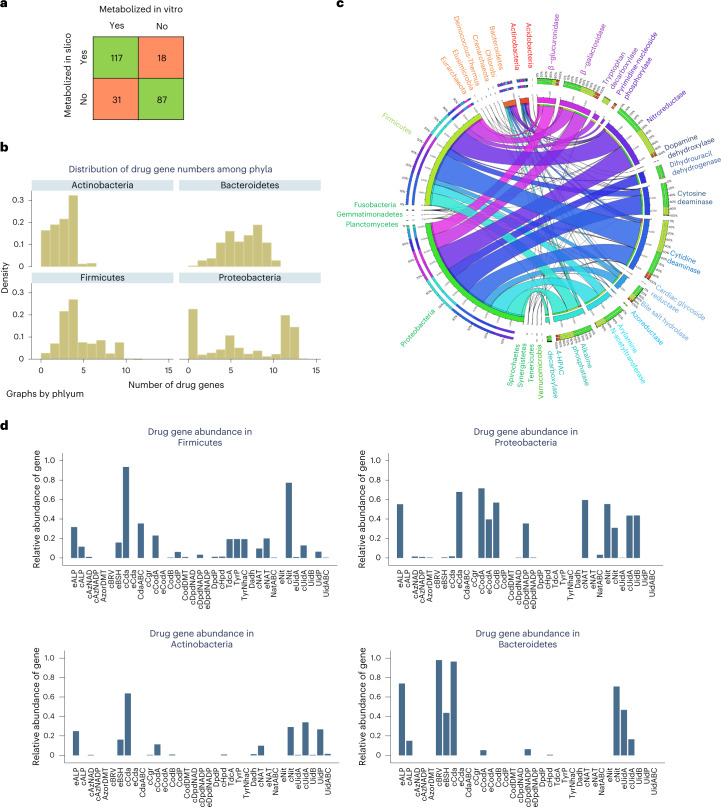
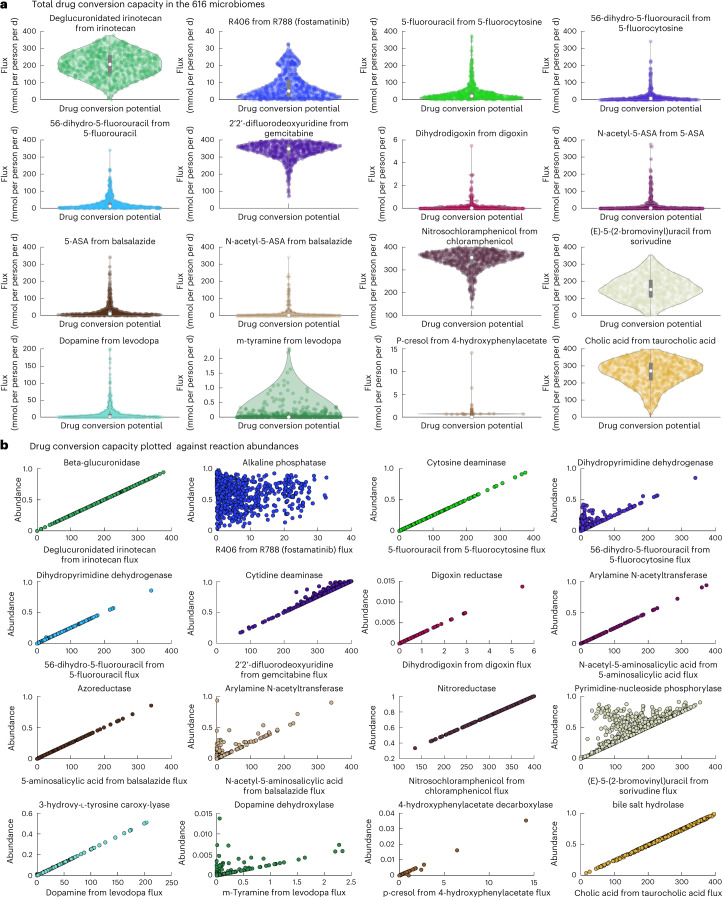
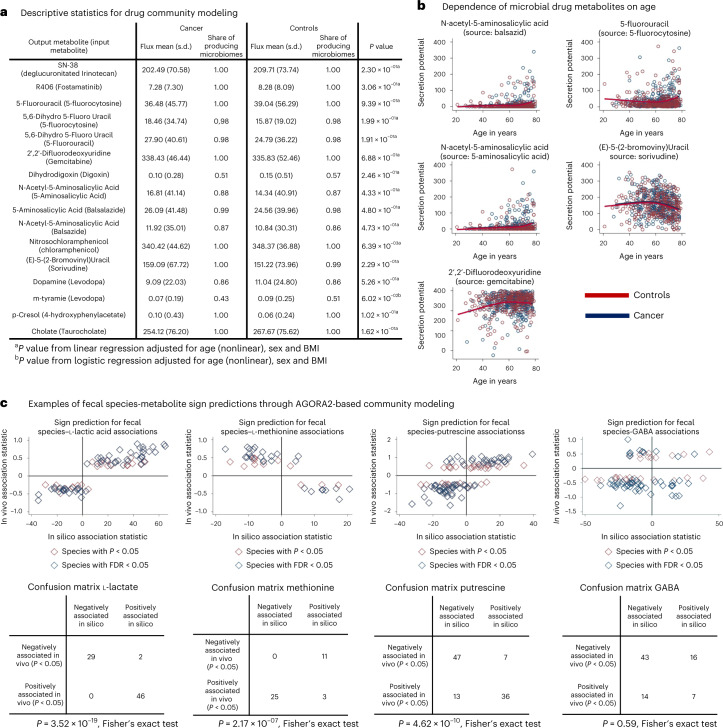
The human microbiome influences the efficacy and safety of a wide variety of commonly prescribed drugs. Designing precision medicine approaches that incorporate microbial metabolism would require strain- and molecule-resolved, scalable computational modeling. Here, we extend our previous resource of genome-scale metabolic reconstructions of human gut microorganisms with a greatly expanded version. AGORA2 (assembly of gut organisms through reconstruction and analysis, version 2) accounts for 7,302 strains, includes strain-resolved drug degradation and biotransformation capabilities for 98 drugs, and was extensively curated based on comparative genomics and literature searches. The microbial reconstructions performed very well against three independently assembled experimental datasets with an accuracy of 0.72 to 0.84, surpassing other reconstruction resources and predicted known microbial drug transformations with an accuracy of 0.81. We demonstrate that AGORA2 enables personalized, strain-resolved modeling by predicting the drug conversion potential of the gut microbiomes from 616 patients with colorectal cancer and controls, which greatly varied between individuals and correlated with age, sex, body mass index and disease stages. AGORA2 serves as a knowledge base for the human microbiome and paves the way to personalized, predictive analysis of host-microbiome metabolic interactions.


Conflict of interest statement

The authors declare no competing interests.

Figures

Fig. 1
Fig. 1. Features of AGORA2.
a, Taxonomic coverage and sources of reconstructed strains. b, Taxonomic distribution of the included 7,302 strains. c, Features of the AGORA2 reconstructions and KBase draft reconstructions. c, cytosol; e, extracellular space; p, periplasm. Growth rates on Western diet (WD) and unlimited medium (UM) are given in  h−1 (Methods). ATP production potential on WD is given in mmol per gdry weight per h. Shown are averages across all models ±standard deviations. d, Number of reconstructions with available positive findings from comparative genomics and literature, and percentage of curated and draft reconstructions agreeing with the findings for the respective organism. N/A, not applicable as the pathway was absent in draft reconstructions. CM, chemically defined medium.
Fig. 2
Fig. 2. Taxonomically related strains are similar in their AGORA2 reconstruction content.
ad, Clustering through t-SNE of reaction presence across all pathways per reconstruction. Coordinates were statistically different across taxonomic units (Kruskal–Wallis test, P = 0.0001 in all cases). a, Members of the largest classes. b, Members of the largest families. c, Members of the Bacilli class by genus. d, Members of the Gammaproteobacteria class by genus. eh, Features of all AGORA2 reconstructions across phyla: e, Number of reactions. f, Number of metabolites. g, Number of genes. h, growth rate in h−1 on aerobic Western diet.
Fig. 3
Fig. 3. Comparison of AGORA2-refined reconstructions, draft reconstructions and three other reconstructions resources.
Compared were the 7,302 AGORA2 and KBase draft reconstructions, 72 manually curated reconstructions from the BiGG database, 5,587 reconstructions built through CarveMe, 8,075 reconstructions built through gapseq and 1,333 MAGMA reconstructions. a, Fraction of reactions that are stoichiometrically and flux consistent as defined in ref. for each model derived from the five compared resources. Exchange and demand reactions, which are stoichiometrically inconsistent by definition, were excluded. b, Aerobic and anaerobic ATP production on complex medium (mmol per gdry weight per h) by each model derived from the five compared resources. c, Overview of reconstruction properties for the compared resources. d, Overview of number of models and number of predictions tested in validating AGORA2, KBase, BiGG, CarveMe, gapseq and MAGMA against three independent experimental datasets,,. e, Bar plots with 95% confidence intervals of overall accuracies of the five resources in predicting uptake and secretion in the three experimental datasets. Significance of prediction accuracy was determined by mixed effect logistic regressions using the metabolic model as random effect variable to account for the statistical dependence of predictions stemming from the same model. NA indicates a missing P value due to empty categories (for example, no true negatives detected). f, Comparison of accuracies per model of the various resources on the three experimental datasets. P values were derived by sign rank tests.
Fig. 4
Fig. 4. Overview of reconstructed drugs and annotated drug enzymes present in AGORA2.
a, Overlap between independent, experimentally demonstrated activity of drug-metabolizing enzymes and predictions by models derived from the AGORA2 reconstructions for 253 drug–microbe pairs (Supplementary Table 7). b, Distribution of the number of strains carrying each drug enzyme over the 14 analyzed phyla. c, Fraction of strains carrying each gene encoding drug enzymes or transport proteins in the four main phyla in the human microbiome. d, Distribution of the number of drug genes per strain for the four main phyla. For the list of abbreviations, see Supplementary Table 3b.
Fig. 5
Fig. 5. Drug conversion capacity of 616 microbiomes.
a, Drug conversion potential in the microbiomes of 365 Japanese patients with CRC and 251 controls on the Average Japanese Diet. The violin plots show the distribution of drug metabolite flux in mmol per person per d. b, Drug conversion potential (mmol per person per d) plotted against the total relative abundance of the reaction producing the shown drug metabolite in the 616 microbiomes. See Supplementary Table 5a for a description of each drug-metabolizing enzyme.
Fig. 6
Fig. 6. Descriptive statistics for the modeled drug metabolites and fecal species–metabolite associations.
a, Overview of descriptive statistics for the modeled drug metabolites. b, Scatter plots (red, controls; blue, cancer) of various drug metabolites in dependence on age with nonlinear regression lines for cases and controls. Regression lines were estimated with restricted cubic splines. All regression models had P < 0.0001 (FDR < 0.05) and regression coefficients were virtually the same for cases and controls. c, Fecal species metabolite sign prediction for l-lactic acid, l-methionine and gamma-aminobutyrate. Upper panel represents scatter plots of in silico change in microbial community net secretion flux derived from community modeling against the change in measured fecal concentration in dependence on microbial species presence. Each dot represents one microbial species having an effect on metabolite concentration with at least P < 0.05. Lower panel depicts the confusion matrix of sign prediction through in silico modeling. P values derived from Fisher’s exact test should be treated with care due to species–species and metabolite–metabolite interdependencies.

References

    1. Lynch SV, Pedersen O. The human intestinal microbiome in health and disease. N. Engl. J. Med. 2016;375:2369–2379. doi: 10.1056/NEJMra1600266. - DOI - PubMed
    1. Nebert DW, Zhang G, Vesell ES. From human genetics and genomics to pharmacogenetics and pharmacogenomics: past lessons, future directions. Drug Metab. Rev. 2008;40:187–224. doi: 10.1080/03602530801952864. - DOI - PMC - PubMed
    1. Tralau T, Sowada J, Luch A. Insights on the human microbiome and its xenobiotic metabolism: what is known about its effects on human physiology? Expert Opin. Drug Metab. Toxicol. 2015;11:411–425. doi: 10.1517/17425255.2015.990437. - DOI - PubMed
    1. Spanogiannopoulos P, Bess EN, Carmody RN, Turnbaugh PJ. The microbial pharmacists within us: a metagenomic view of xenobiotic metabolism. Nat. Rev. Microbiol. 2016;14:273–287. doi: 10.1038/nrmicro.2016.17. - DOI - PMC - PubMed
    1. Zimmermann M, Zimmermann-Kogadeeva M, Wegmann R, Goodman AL. Mapping human microbiome drug metabolism by gut bacteria and their genes. Nature. 2019;570:462–467. doi: 10.1038/s41586-019-1291-3. - DOI - PMC - PubMed

Publication types

LinkOut - more resources