. 2023 Feb;8(2):231-245.
doi: 10.1038/s41564-022-01297-4. Epub 2023 Jan 19.

Evolutionary diversification of methanotrophic ANME-1 archaea and their expansive virome

Affiliations

Evolutionary diversification of methanotrophic ANME-1 archaea and their expansive virome

Rafael Laso-Pérez et al. Nat Microbiol. 2023 Feb.

Abstract

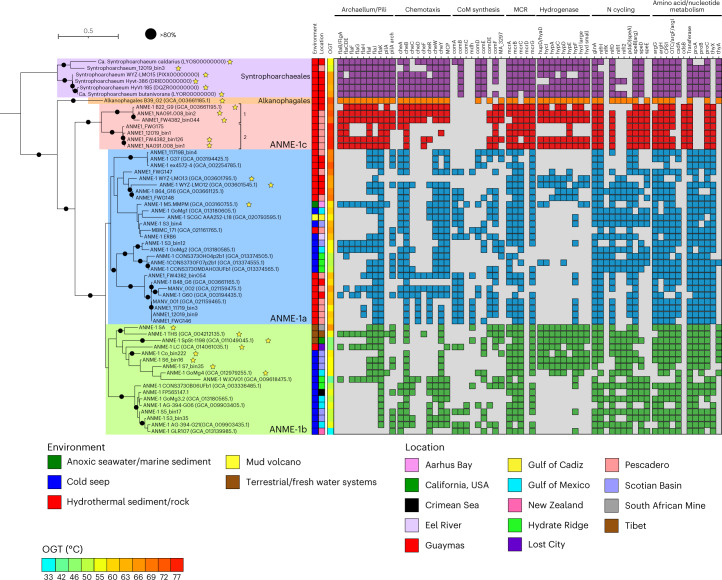
'Candidatus Methanophagales' (ANME-1) is an order-level clade of archaea responsible for anaerobic methane oxidation in deep-sea sediments. The diversity, ecology and evolution of ANME-1 remain poorly understood. In this study, we use metagenomics on deep-sea hydrothermal samples to expand ANME-1 diversity and uncover the effect of virus-host dynamics. Phylogenetic analyses reveal a deep-branching, thermophilic family, 'Candidatus Methanospirareceae', closely related to short-chain alkane oxidizers. Global phylogeny and near-complete genomes show that hydrogen metabolism within ANME-1 is an ancient trait that was vertically inherited but differentially lost during lineage diversification. Metagenomics also uncovered 16 undescribed virus families so far exclusively targeting ANME-1 archaea, showing unique structural and replicative signatures. The expansive ANME-1 virome contains a metabolic gene repertoire that can influence host ecology and evolution through virus-mediated gene displacement. Our results suggest an evolutionary continuum between anaerobic methane and short-chain alkane oxidizers and underscore the effects of viruses on the dynamics and evolution of methane-driven ecosystems.


Conflict of interest statement

The authors declare no competing interests.

Figures

Fig. 1
Fig. 1. Phylogenomic tree and lineage differentiation of the ANME-1 order.
In bold, genomes retrieved from the South Pescadero Basin. The colour bars indicate from left to right: environment, location, predicted OGT (in °C) and a genomic comparison of some metabolic features (main text and Supplementary Information). Numbers after the ANME-1c names indicate the two species of ANME-1c and the stars after the names denote MAGs containing at least the large subunit of a NiFe hydrogenase. Black circles indicate bootstrap support values over 80%. The scale bar represents the number of nucleotide substitutions per site. CoM, Coenzyme M.
Fig. 2
Fig. 2. Distribution and morphology of ANME-1 in South Pescadero sediment and rock samples.
a, Relative abundance of MAGs from ANME and other bacteria and archaeal lineages (left). Genomic abundance for archaea at the species level is on the right, highlighting a variation ANME-1 lineages in rocks and sediments (right). Colour background indicates rock (grey) or sediment (brown) samples. The total abundance does not reach 100% because unmapped reads are not included. Note the different scales of the y axes between panels. b, Fluorescence in situ hybridization of ANME-1 cells recovered from rock sample NA091.008 (n = 2). Cells targeted by the general ANME-1-350 probe are shown in red (left). Cells targeted by the general bacterial probe 338 are in green (middle). A composite overlay showing bacteria (green), ANME-1 cells (red) and DAPI staining of all microbial cells in blue (right). Scale bar, 5 µm.
Fig. 3
Fig. 3. Vertical inheritance and differential loss of hydrogenases across ANME-1.
a, Phylogenetic tree of the large subunit of the NiFe hydrogenase present in ANME-1 genomes (left) and the corresponding phylogenomic tree of those genomes (right). A few NiFe hydrogenases of ANME-1 genomes were also affiliated with NiFe Group 3 and 4 (not shown, see Extended Data Fig. 5). Colour bars/backgrounds indicate the phylogenetic affiliation of hydrogenases of interest. Black circles indicate bootstrap support values over 70% (left) and equal to 100% (right). Scale bars represent the number of amino acid substitutions per site. b, Read coverage distribution of the hydrogenase operon of ANME-1c genomes FW4382_bin126 and NA091.008_bin1. Metagenomic read libraries are indicated on the right. The blue shade indicates where the hydrogenase operon is located within the corresponding contig.
Fig. 4
Fig. 4. Expansive ANME-1 mobilome includes 16 undescribed viral families and structurally predicted MCPs.
a, Histograms showing the number of CRISPR spacers from South Pescadero and Guaymas basin metagenomes matching the South Pescadero ANME-1 MGEs. b, Gene sharing network of diverse ANME-1 MGEs of different origins. c, ANME-1 MGEs, exhibited in the same network as b, are found to encompass major archaeal virus diversity and non-viral elements. Solid or open circles indicate viral assemblies with/without identifiable MCPs. In (b) and (c), dashed lines encircle five proposed viral families containing complete genome representatives. The proposed names of viral families (black) and orders (purple) are indicated in (c). df, Gene synteny of three proposed families of tailless icosahedral viruses targeting ANME-1. Different colours indicate 83 different protein groups. Grey shading denotes singletons. The scale bar and precent identity shading are indicated in (f). g, Alphafold2-predicted structures of DJR MCPs in ANME-1 viruses shown in (d) and (e). Blue indicates β barrels, and red α helices. h, Maximum-likelihood analysis of proposed MCP families indicates their long evolutionary distances. i, Maximum-likelihood analysis of PolB found in different clades of the tailless Chaacviruses targeting ANME-1 archaea are related to two clades of spindle-shaped Wyrdviruses targeting Asgard archaea. SJR, single jelly-roll.
Fig. 5
Fig. 5. ANME-1 viral genomes encode complex structures.
a, Evolutionary division between head-tailed viruses targeting ANME-1 and haloarchaea revealed by global proteome-based phylogenetic analyses. ANME-1 viruses with complete circular genomes are highlighted in purple, those with unconfirmed completeness are in blue. b,c, Genome organization and gene content of the complete genomes representing two families of ANME-1 head-tailed viruses Ahpuchviridae (b) and Ekchuahviridae (c). Blue and purple shading represents forward and reverse strands, respectively. MCP, PolB and ThyX genes are highlighted in pink and red. d, Circular alignment of the two genomes of ekchuahviruses. Black arrowheads indicate the original contig start/end sites in each assembly. e, Gene content of the complete linear genome of a representative of the rod-shaped virus familyAhmunviridae. f, Gene synteny of three families of spindle-shaped viruses targeting ANME-1, where complete, circularized genomes of Itzamnaviridae were found to occur in two genome sizes, where Demiitzamnavirus representatives align with a section of the larger Pletoitzamnavirus genomes (illustrated on the top right). Different colours indicate 76 different protein groups. Grey shading denotes singletons. The scale bar and percent identity shading are indicated in the bottom right. g, Gene content of the complete linear genome of a representative of the spindle-shaped virus family Itzamnaviridae. Dashed red box in (f) and (g) highlights an example of a multigene cluster insertion. In (d) and (f), the structural arm denotes the genome fraction where all viral structural genes reside; the enzymatic arm denotes the fraction where there are no structural genes and only enzyme-encoding genes reside.
Fig. 6
Fig. 6. A viral origin of thymidylate synthase in ANME-1.
Maximum-likelihood analysis of ThyX related to ANME-1 encoded ThyX proteins, with expanded views of ThyX from ANME-1 viruses on the right. Legends for the branch colours for ThyX from ANME-1 viruses and ANME-1 genomes are indicated below the main phylogenetic tree.
Extended Data Fig. 1
Extended Data Fig. 1. 16S rRNA gene phylogeny for the ANME-1 clade (Methanophagales).
Color shading highlights the three main groups of ANME-1 archaea. The purple bars note 16S rRNA gene sequences retrieved from MAGs shown in Fig. 1. Sequences retrieved from Pescadero MAGs are in bold. Bootstrap values over 50% are indicated with a black circle. Scale bar indicates the number of nucleotide substitutions per site.
Extended Data Fig. 2
Extended Data Fig. 2. Correlation between estimated genome size (in Mb and after calculation considering contamination and completeness see Material and Methods) and the predicted optimum growth temperature (°C).
Each point and number represents the average values for one ANME genera/species (see Supplementary Table 2), except in the case of Syntrophoarchaeales and Alkanophagales where the point represent the average values for the whole clade. Color indicates the corresponding taxonomy. Dotted line indicates the regression model (R2 = 0.3858).
Extended Data Fig. 3
Extended Data Fig. 3. Phylogenetic tree of McrD genes from archaea, including the McrD in ANME-1 genomes (only found in ANME-1c).
Black circles indicate bootstrap support values over 70%. Scale bar represents the number of amino acid substitutions per site.
Extended Data Fig. 4
Extended Data Fig. 4. Circos plot comparing homologous regions of the ANME-1c genomes, NA091.008_bin1 and FW4382_bin126 (both with hydrogenase operons) to the predicted completed genome FWG175 that was assembled as a single contiguous scaffold and belongs to the same species.
Contigs corresponding to the query genomes (NA091.008, FW4382_bin126) are marked in green and the genome scaffold of FWG175 are in orange. The contig containing the hydrogenase operon is shown in purple and the corresponding homology sections between the reference and query genomes are highlighted in blue. The region between these homology sections corresponds to the hydrogenase operon that was not detected in genome FWG175.
Extended Data Fig. 5
Extended Data Fig. 5. Phylogenetic tree of the large subunit of the NiFe hydrogenase present in ANME-1 genomes associated with NiFe Groups 3 and 4.
The green and blue shading indicates the taxonomic identity of the ANME-1 MAG containing the corresponding hydrogenase. Black circles indicate bootstrap support values over 70%. The scale bar represents the number of amino acid substitutions per site.
Extended Data Fig. 6
Extended Data Fig. 6. Features of ANME-1 CRISPR/Cas and spacer-mobilome mapping.
(a) CRISPR/Cas features in the two most contiguous ANME-1c MAGs characterized using CCtyper. Black bars indicate CRISPR arrays. (b) Contig lengths of all ANME-1 mobile genetic elements (MGEs) found in this study. Note that contig length does not necessarily indicate completeness as IMG/VR v.3 is more enriched with head-tailed viruses (with genomes sized up 80 kb) whereas the contigs obtained directly from Pescadero/Guaymas basin metagenomic assemblies contain many tailless icosahedral viruses whose genomes are sized around 10 kb. (c) Distribution of protospacers within the ANME-1 mobile elements found in S. Pescadero and Guaymas basins.
Extended Data Fig. 7
Gene-sharing networks produced via vCONTACT2 indicate that all ANME-1 mobile genetic elements (magenta) are well distinguished from the known haloarchaeal viruses, or Haloviruses, (blue) and other viruses with known hosts (orange).
Extended Data Fig. 8
Extended Data Fig. 8. Maximum-likelihood analyses of MCPs encoded by head-tailed viruses.
On the right: Blue, ANME-1 virus families; black, haloarchaeal virus families. MCPs from complete genomes of ANME-1 viruses are indicated in blue, and their respective families in bold.
Extended Data Fig. 9
Extended Data Fig. 9. Sequence alignment of representatives of ANME-1 viruses.
Colors indicates protein families encoded by at least 2 representative viral genomes here. Gray indicates singleton proteins without apparent homologs. Scale bars for protein identity scores and genome sizes are indicated at the bottom. Viral contig names and sizes are indicated on the left side and their respective family names are indicated on the right.
Extended Data Fig. 10
Extended Data Fig. 10. Spindle-shaped viruses encode ThyX at the root of ANME-1 ThyX.
a, unrooted phylogeny suggests that ANME-1 thyX may have evolved from thyX genes originated in ANME-1 viruses. The two versions of of ThyX in the ANME-1c bin B22_G9 are highlighted. b, Distribution of ThyX gene in various spindle-shaped viruses indicated on the gene-sharing network. c, Sequence alignment showing the conservation and variation of gene content around the thyX gene in the genomes of spindle-shaped viruses.

References

    1. Reeburgh WS. Oceanic methane biogeochemistry. Chem. Rev. 2007;107:486–513. - PubMed
    1. Chadwick GL, et al. Comparative genomics reveals electron transfer and syntrophic mechanisms differentiating methanotrophic and methanogenic archaea. PLoS Biol. 2022;20:e3001508. - PMC - PubMed
    1. Wegener G, Laso-Pérez R, Orphan VJ, Boetius A. Anaerobic degradation of alkanes by marine archaea. Annu. Rev. Microbiol. 2022;76:553–577. - PubMed
    1. Holler T, et al. Thermophilic anaerobic oxidation of methane by marine microbial consortia. ISME J. 2011;5:1946. - PMC - PubMed
    1. Orphan VJ, House CH, Hinrichs K-U, McKeegan KD, DeLong EF. Multiple archaeal groups mediate methane oxidation in anoxic cold seep sediments. Proc. Natl Acad. Sci. 2002;99:7663–7668. - PMC - PubMed

Publication types