. 2023 Jan 20;80(2):47.
doi: 10.1007/s00018-022-04659-7.

Chromodomain on Y-like 2 (CDYL2) implicated in mitosis and genome stability regulation via interaction with CHAMP1 and POGZ

Affiliations

Chromodomain on Y-like 2 (CDYL2) implicated in mitosis and genome stability regulation via interaction with CHAMP1 and POGZ

Maha Siouda et al. Cell Mol Life Sci. .

Abstract

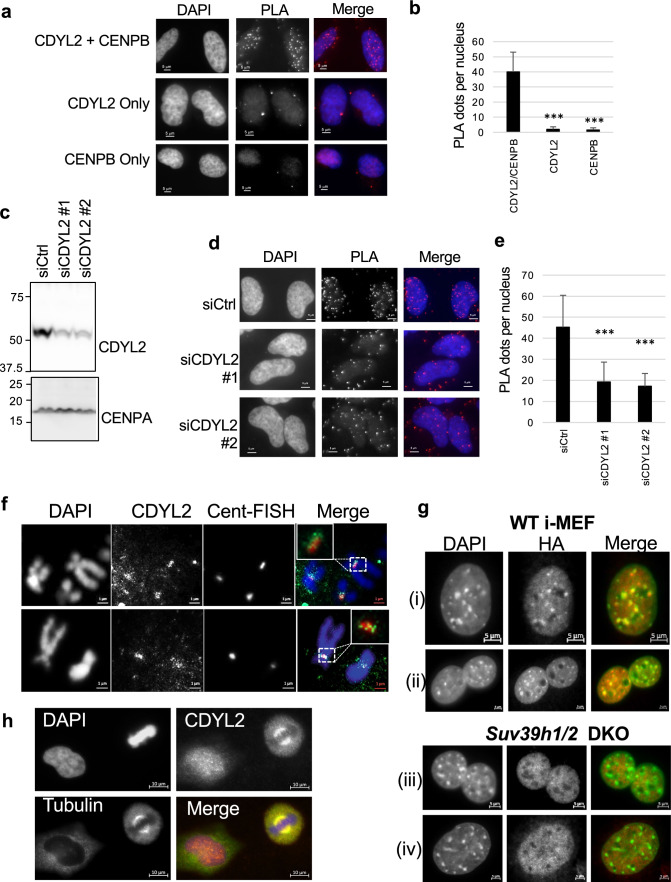
Histone H3 trimethylation on lysine 9 (H3K9me3) is a defining feature of mammalian pericentromeres, loss of which results in genome instability. Here we show that CDYL2 is recruited to pericentromeres in an H3K9me3-dependent manner and is required for faithful mitosis and genome stability. CDYL2 RNAi in MCF-7 breast cancer cells and Hela cervical cancer cells inhibited their growth, induced apoptosis, and provoked both nuclear and mitotic aberrations. Mass spectrometry analysis of CDYL2-interacting proteins identified the neurodevelopmental disease-linked mitotic regulators CHAMP1 and POGZ, which are associated with a central non-conserved region of CDYL2. RNAi rescue assays identified both the CDYL2 chromodomain and the CHAMP1-POGZ interacting region as required and, together, sufficient for CDYL2 regulation of mitosis and genome stability. CDYL2 RNAi caused loss of CHAMP1 localization at pericentromeres. We propose that CDYL2 functions as an adaptor protein that connects pericentromeric H3K9me3 with CHAMP1 and POGZ to ensure mitotic fidelity and genome stability.

Keywords: C13orf8; CAMP; Centromere; Epigenetics; ZNF828.


Conflict of interest statement

The authors have no competing interests to declare.

Figures

Fig. 1
Fig. 1
CDYL2 RNAi inhibits cell growth, induces apoptosis and results in genome aberrations. a RT-PCR validation of CDYL2 RNAi knock-down in MCF-7 cells. CDYL2 mRNA was normalized to GAPDH levels. Shown is the mean of three replicates and standard deviation (S.D.) b Western blot validation of CDYL2 RNAi. c Images of wells of crystal violet stained adherent MCF-7 colonies treated with control or CDYL2 RNAi (left), Colonies were counted (top chart) and measured for average size, expressed as arbitrary units (lower chart). Shown are the mean and standard deviation of the three experiments. d Live cell imaging analysis of MCF-7 growth after treatment with control (yellow) or CDYL2 (green) RNAi. e, f RT-PCR and western blot validation of CDYL2 shRNA knockdown in clonal MCF-7 cultures compared to shLuciferase (shLuc) controls was performed as in (a) and (b) respectively. g, h Adherent colony growth (g) and live cell imaging (h) analysis of the growth of MCF-7 clones carrying shCDYL2 or control shLuc was performed as in (c) and (d) respectively. i FACS analysis of the early apoptosis marker Annexin V-PE and the vital dye 7-AAD in MCF-7 cells treated with shCDYL2 or control shRNA. A representative pair of control and CDYL2 RNAi FACS plots are shown (top), along with quantitation of non-apoptotic cells (AV-/7AAD-), cells in early apoptosis (AV + /7AAD-), and cells in late or post-apoptosis (AV + /7AAD +) (lower chart). Shown are the mean and S.D. of three experiments. T test p < 0.001 (***). j Propidium iodide (PI) FACS analysis of MCF-7 cells treated with control or CDYL2 siRNA. The peaks corresponding to 2n and 4n genomic content are indicated in controls. The experiment was repeated three times with similar results. k, l RT-PCR and western blot validation of RNAi knockdown of CDYL2 in Hela cells performed as per (a) and (b) respectively. m, n Colony growth assay (m) and PI-FACS (n) was performed on Hela treated with control or CDYL2 RNAi, as per (c) and (j) respectively
Fig. 2
Fig. 2
CDYL2 RNAi induces mitotic defects and genome instability. a IF staining of beta-tubulin and DAPI staining of Hela cells treated with siControl (i) or siCDYL2 (ii–vi) revealing micronuclei and DNA bridges between daughter nuclei ((ii), and a zoom of (ii) shown in (iii)), multinuclear cells (iv, v) and fragmented nuclei (vi). Arrows added to highlight certain defects. b Hela cells treated with control siRNA showed normal metaphase (i) organization of chromosomes and the spindle. However, those treated with siCDYL2 revealed a variety of abnormal spindle organization patterns as well as misaligned chromosomes (ii–v). c Mitotic spindle stability was assayed by cold-shock of Hela cells treated with either control (i) or CDYL2 (ii, iii) siRNA. Metaphase cells were enriched by pre-treatment with MG-132 for 2 h before cold-shock and fixation. IF was performed as in (a). d Selected still images from video microscopy analysis of Hela H2B-GFP cells treated with siControl (top) or siCDYL2 (lower). The times indicated correspond to the elapsed time after the first image shown in the time-lapse series. The experiment was repeated three times with similar results
Fig. 3
Fig. 3
Immunofluorescence analysis of CDYL2 sub-cellular localization. a CDYL2 IF in paraformaldehyde-fixed Hela cells with DAPI, CREST and beta-tubulin co-staining. Merged images of CDYL2 (red), CREST (green), and beta-tubulin (cyan) are also shown. Representative images from interphase, prometaphase, metaphase, and both early and late anaphase and telophase are shown. The staining was repeated three times with similar results. b Deconvolution microscopy analysis of interphase Hela or MCF-7 cells, pre-extracted or not before fixation with a triton X-100-based buffer, and stained with CDYL2, CREST, and DAPI. These are colorized as red, white, and blue respectively in the merged images. Selected intensity scans of putative co-localizing foci are also shown in the rightmost three panels. The foci analyzed in each intensity scan are indicated by the yellow arrows in the CDYL2/CREST merged image. c As in (b), except metaphase cells are shown, and staining includes anti-CENPE (green). Selected intensity scans of putative co-localizing foci are shown in the rightmost three panels. The foci analyzed in each intensity scan are indicated by the yellow arrows in the CDYL2/CREST/CENPE merged image
Fig. 4
Fig. 4
CDYL2 colocalization with pericentromeres and the mitotic spindle. a Proximity ligation assay (PLA) of CDYL2 and CENP-B, with concomitant DAPI nuclear staining. Single antibody PLA controls are also shown. Representative images are shown. The experiment was repeated three times with similar results. b Quantification of the PLA dots in the respective conditions tested in (a). The mean number of dots per nucleus and S.D. are shown. T tests comparing single antibody controls to anti-CDYL2/CENP-B PLA were performed (***p < 0.001). c Immunoblot validation of CDYL2 siRNA knockdown corresponding to PLA in (d). d PLA of CDYL2 and CENP-B in Hela cells treated with control siRNA or two independent siCDYL2 sequences, performed as in (a). e Quantification of PLA dots from (d) was performed as in (b). f IF-FISH showing DAPI-stained metaphase chromosomes, immunostained CDYL2, and centromere repeats stained with a labeled FISH probe (Cent-FISH). Two representative images are shown. The white boxes in the merged images indicate a zoom on the co-stained regions. The staining was repeated three times with similar results. g Wild-type (WT) or Suv39h1/2 DKO i-MEF were transduced with HA-mCdyl2 expression vectors (i, iii) or HA-mCdyl1 expression vectors (ii, iv), then stained with anti-HA antibodies (red) and DAPI, shown in green to facilitate analysis of co-localization analysis in the merged images. Shown are representative images from three independent experiments. h CDYL2 and gamma-tubulin IF in Hela cells fixed with methanol. Shown is a representative image of a metaphase cell (right of frame) and interphase cell (left of frame). Staining was repeated three times with similar results
Fig. 5
Fig. 5
CDYL2 interacts with CHAMP1 and POGZ. a Number of unique CDYL2, CHAMP1, POGZ, EHMT2 and EHMT1 peptides in mass spectrometry analysis of triplicate FLAG-CDYL2 IPs and their paired mock IP controls. b, c Western blot analysis of Gal4-CDYL2 IP from transfected Hela nuclear extracts (b) or MCF7 nuclear extracts (c) along with control IgG IP. Shown are representative images from three independent assays. The positions of molecular weight markers are shown to the left of each blot (kDa). The position of bands of the expected molecular weight is indicated with an asterisk (*), and the signal from the IP antibody heavy chain is shown with a double asterisk (**). d Anti-CHAMP1 or control IgG IP in nuclear extracts prepared from non-transfected Hela cells (upper panels) or MCF-7 cells (lower panels), followed by either CHAMP1 or CDYL2 western blot. The assay was repeated three times with similar results. The position of bands of the expected molecular weight is indicated with an asterisk (*), and the signal from the IP antibody heavy chain is shown with a double asterisk (**). e PLA indicating CHAMP1 localization proximal to CDYL2 (top row). Single antibody controls are shown below. Representative images are shown. The experiment was repeated three times with similar results. f Quantification of the PLA dots from (e), expressed as the mean number of dots per nucleus and S.D. T test compared to CDYL2/CHAMP1 PLA (***p < 0.001). g CDYL2/CHAMP1 PLA was performed as in (e) but on cells treated with a control siRNA or two independent siRNA targeting CDYL2. Representative images are shown. The experiment was repeated three times with similar results. h Quantification of the nuclear PLA dots from (g) performed as in (f)
Fig. 6
Fig. 6
A CHAMP1-POGZ interacting region and intact chromodomain are required for CDYL2 regulation of mitosis and genome stability. a Graphic representation of Gal4 DBD (G4)-tagged CDYL2 full-length (FL) and deletion or triple point mutants. b CHAMP1, POGZ and Gal4 immunoblot of anti-Gal4 or control IgG IP performed on nuclear extracts from Hela cells transfected with the indicated plasmids. An excerpt of the Gal4-CDYL2 blot is shown at lower exposure in the image below that of the full blot, to facilitate visualization of the Gal4-CD construct which is obscured by the antibody light chain signal in the higher exposure blot. Reactive bands of the expected molecular weight are indicated by single asterisks (*). Cross-reactive bands from the light chain of the IP antibodies in the lower panel are indicated (**). The experiment was repeated three times with similar results. c Western blot validation of CDYL2 RNAi knockdown and expression of the Gal4-CDYL2 constructs indicated above each lane. Shown are CDYL2, Gal4, and actin blots on the same membrane. Reactive bands of the expected molecular weight are indicated by single asterisks (*). d The indicated phenotypes were counted in Hela cells treated with control (siCtrl) or siCDYL2 along with an empty vector (EV) or one of the CDYL2 cDNAs indicated in (a). Cells were incubated with MG-132 for 2 h before analysis to enrich in metaphase cells. Shown is the mean of three independent assays and S.D. T test of differences between siCDYL2/EV and siCtrl/EV, or siCDYL2/EV co-transfected with one of the five rescue plasmids indicated in (a) (*p < 0.05; **p < 0.01). e PLA using CHAMP1 and CENP-B antibodies was performed on Hela cells treated with Control or CDYL2 siRNA, with co-transfection of either pcDNA3-Gal4 or Gal4-CDYL2-FL expression plasmid, as indicated. Representative images are shown. The experiment was repeated three times with similar results. f Hela cells were treated as in panels (c) and (d), fixed, and PLA assay for CHAMP1 proximity to CENP-B was performed, as in (e). Shown is the mean number of PLA dots per nucleus of three independent assays and S.D. T test compared each condition to the siCDYL2/G4 sample (***p < 0.001)

References

    1. Hirano T. Chromosome dynamics during mitosis. Cold Spring Harb Perspect Biol. 2015;7:a015792. doi: 10.1101/cshperspect.a015792. - DOI - PMC - PubMed
    1. Matthews HK, Bertoli C, de Bruin RAM. Cell cycle control in cancer. Nat Rev Mol Cell Biol. 2022;23:74–88. doi: 10.1038/s41580-021-00404-3. - DOI - PubMed
    1. Degrassi F, Damizia M, Lavia P. The mitotic apparatus and kinetochores in microcephaly and neurodevelopmental diseases. Cells. 2020;9:49. doi: 10.3390/cells9010049. - DOI - PMC - PubMed
    1. Saksouk N, Simboeck E, Dejardin J. Constitutive heterochromatin formation and transcription in mammals. Epigenetics Chromatin. 2015;8:3. doi: 10.1186/1756-8935-8-3. - DOI - PMC - PubMed
    1. Smurova K, De Wulf P. Centromere and pericentromere transcription: roles and regulation in sickness and in health. Front Genet. 2018 doi: 10.3389/fgene.2018.00674. - DOI - PMC - PubMed

LinkOut - more resources