. 2023 Jan;29(1):180-189.
doi: 10.1038/s41591-022-02142-1. Epub 2023 Jan 19.

Genomic autopsy to identify underlying causes of pregnancy loss and perinatal death

Collaborators, Affiliations

Genomic autopsy to identify underlying causes of pregnancy loss and perinatal death

Alicia B Byrne et al. Nat Med. 2023 Jan.

Erratum in

  • Author Correction: Genomic autopsy to identify underlying causes of pregnancy loss and perinatal death.
    Byrne AB, Arts P, Ha TT, Kassahn KS, Pais LS, O'Donnell-Luria A; Broad Institute Center for Mendelian Genomics; Babic M, Frank MSB, Feng J, Wang P, Lawrence DM, Eshraghi L, Arriola L, Toubia J, Nguyen H; Genomic Autopsy Study Research Network; McGillivray G, Pinner J, McKenzie F, Morrow R, Lipsett J, Manton N, Khong TY, Moore L, Liebelt JE, Schreiber AW, King-Smith SL, Hardy TSE, Jackson MR, Barnett CP, Scott HS. Byrne AB, et al. Nat Med. 2024 Jan;30(1):302. doi: 10.1038/s41591-023-02487-1. Nat Med. 2024. PMID: 37429925 No abstract available.

Abstract

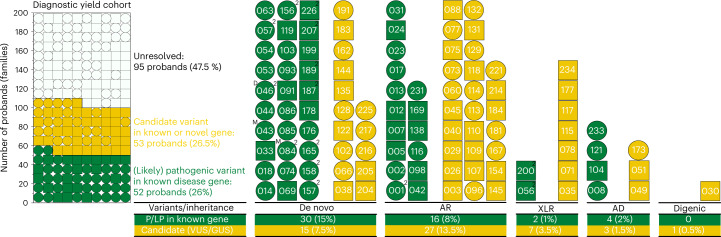
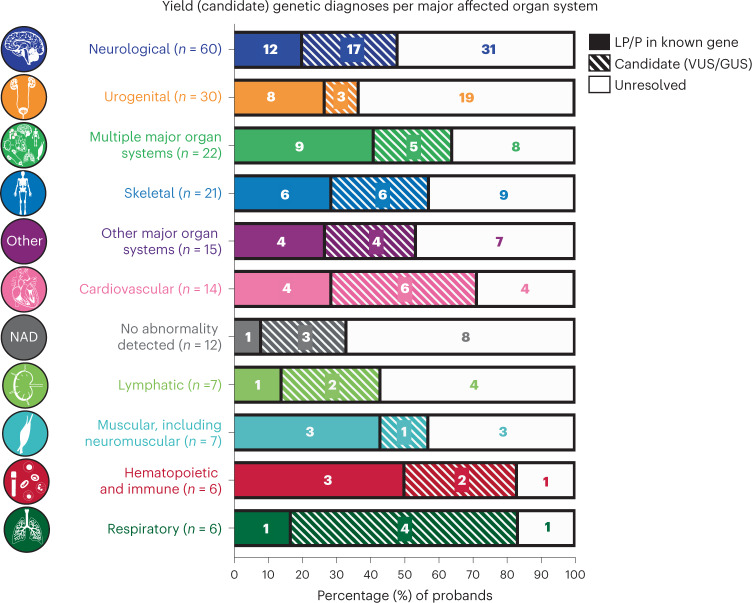
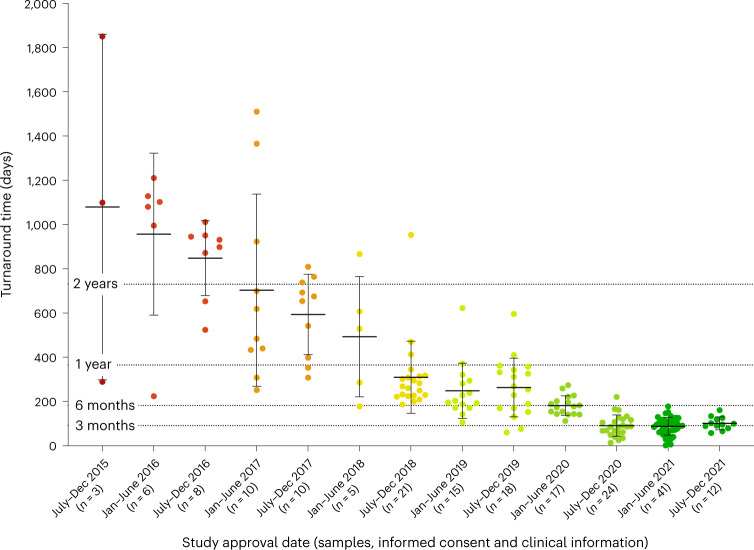
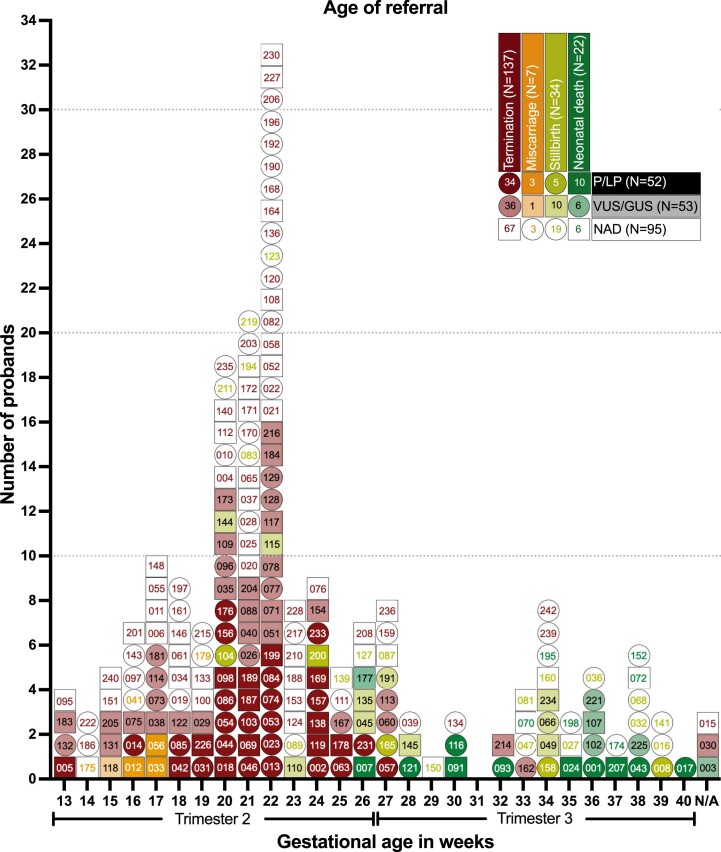
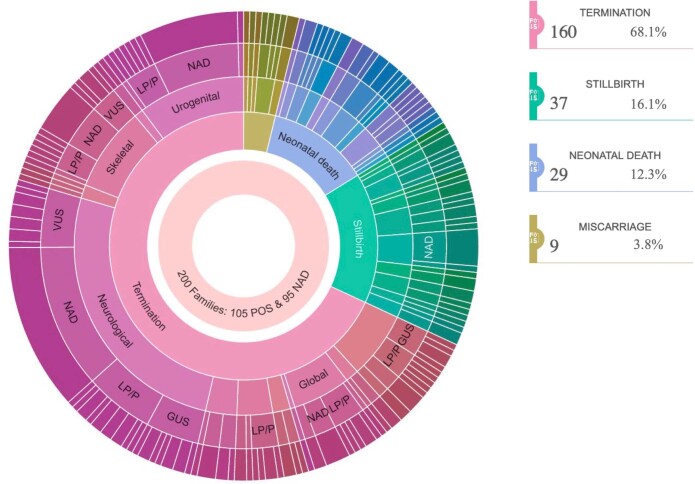
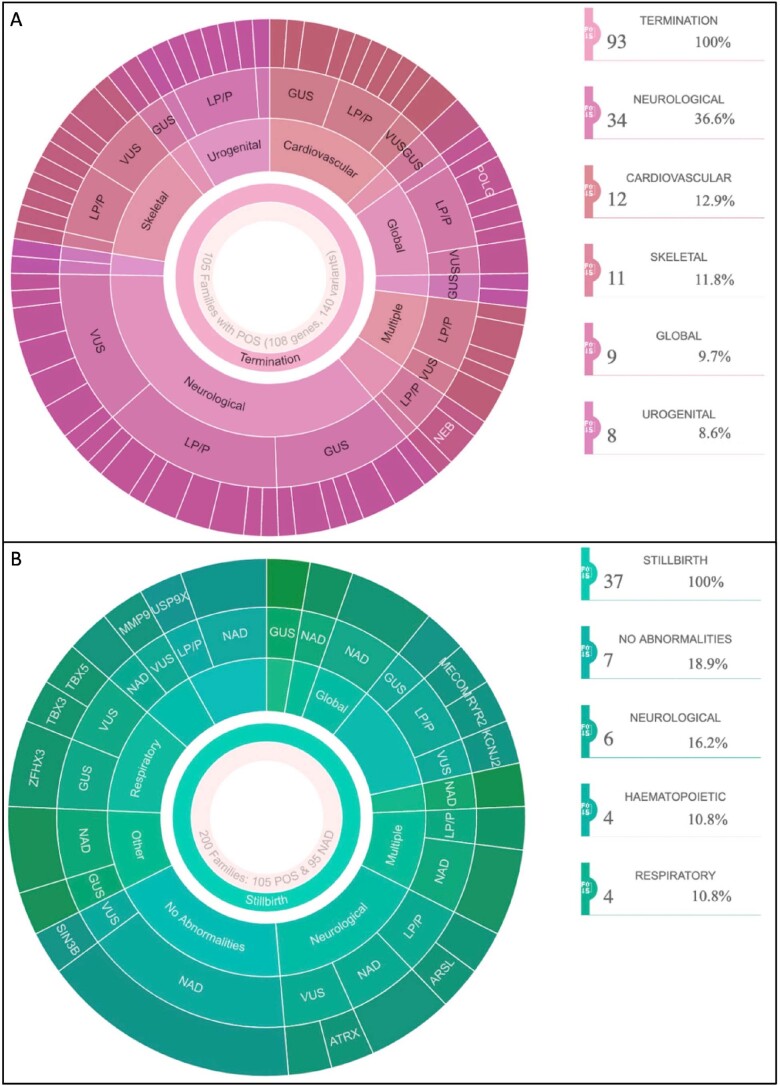
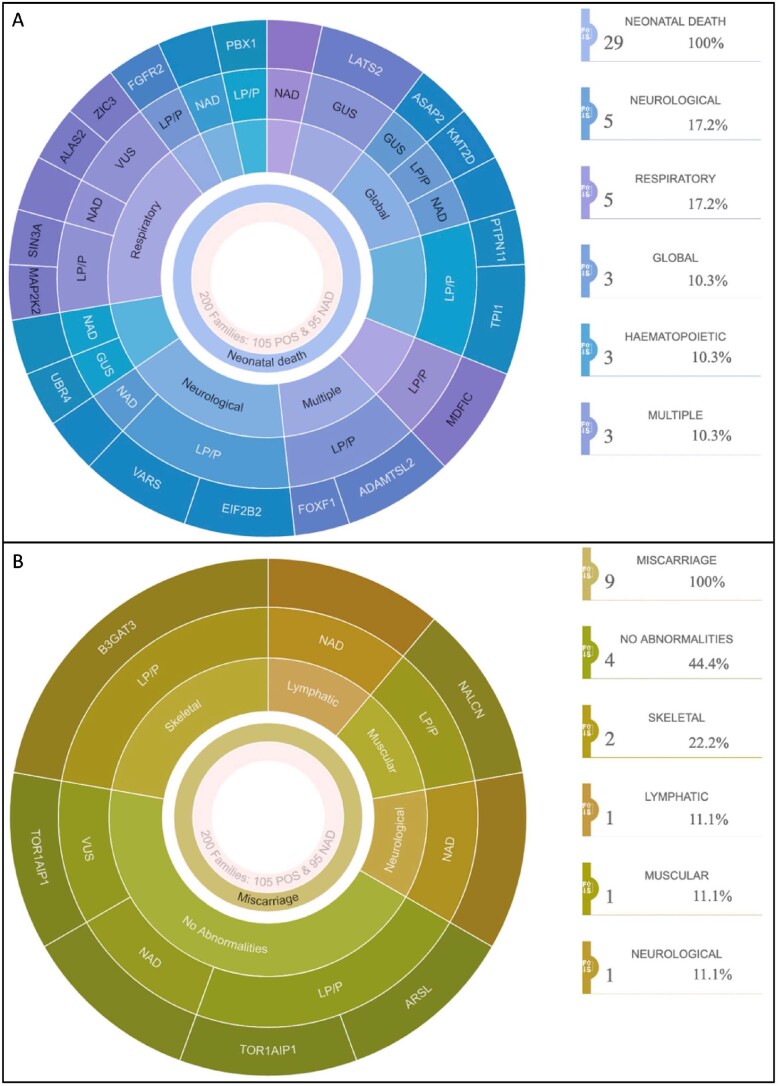
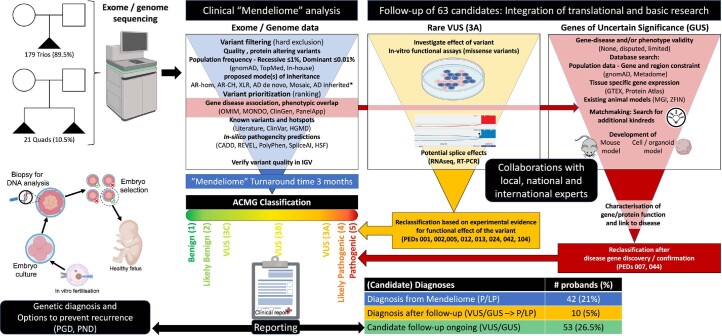
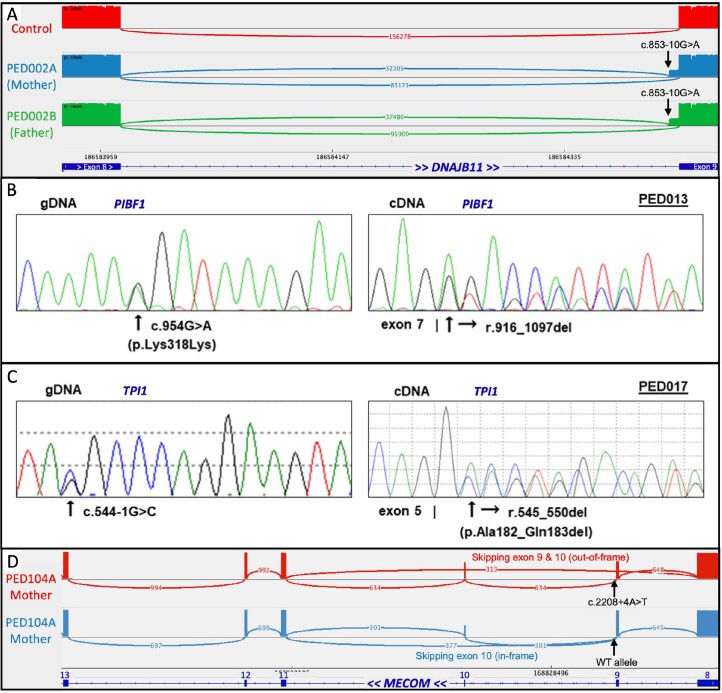
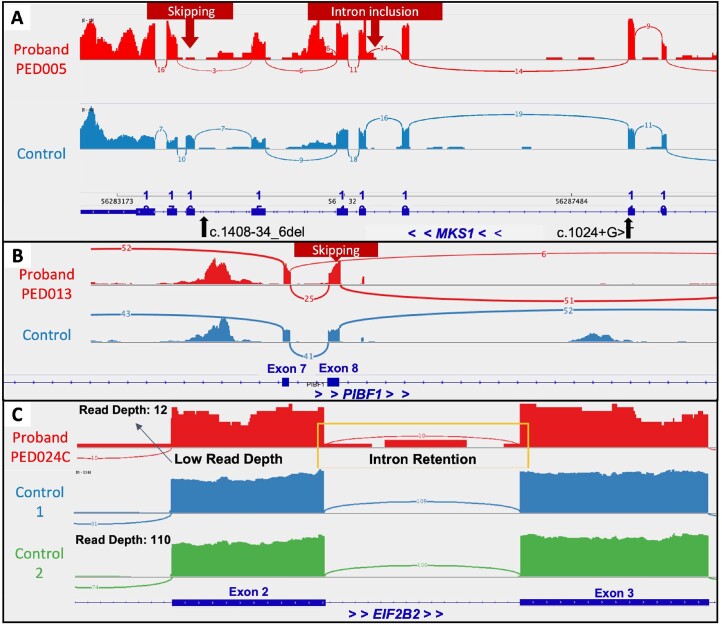
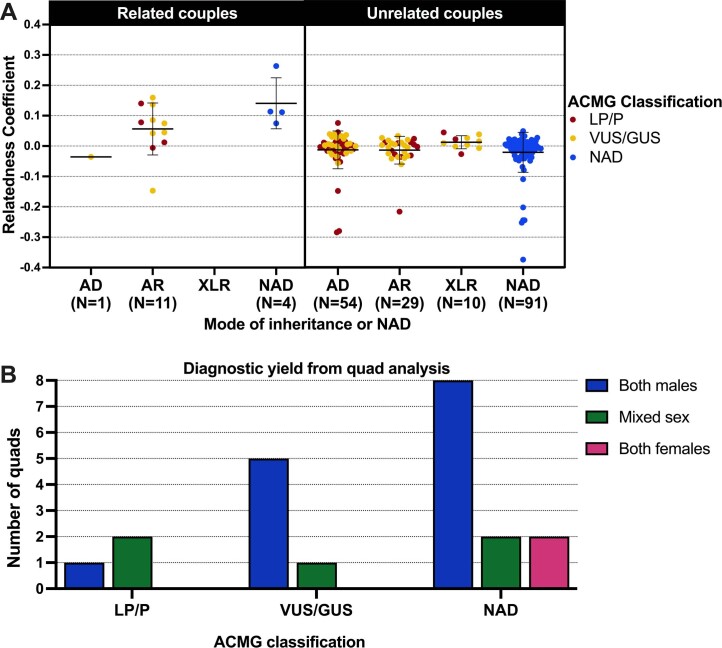
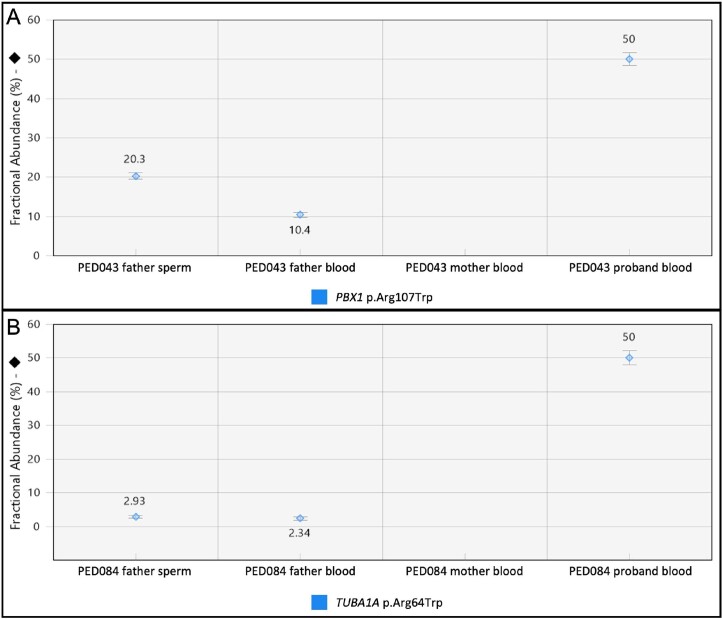
Pregnancy loss and perinatal death are devastating events for families. We assessed 'genomic autopsy' as an adjunct to standard autopsy for 200 families who had experienced fetal or newborn death, providing a definitive or candidate genetic diagnosis in 105 families. Our cohort provides evidence of severe atypical in utero presentations of known genetic disorders and identifies novel phenotypes and disease genes. Inheritance of 42% of definitive diagnoses were either autosomal recessive (30.8%), X-linked recessive (3.8%) or autosomal dominant (excluding de novos, 7.7%), with risk of recurrence in future pregnancies. We report that at least ten families (5%) used their diagnosis for preimplantation (5) or prenatal diagnosis (5) of 12 pregnancies. We emphasize the clinical importance of genomic investigations of pregnancy loss and perinatal death, with short turnaround times for diagnostic reporting and followed by systematic research follow-up investigations. This approach has the potential to enable accurate counseling for future pregnancies.


Conflict of interest statement

The authors declare no competing interests.

Figures

Fig. 1
Fig. 1. Diagnostic yield of pregnancy loss and perinatal death cohort with observed inheritance models.
Corresponding pedigree number is contained within each proband symbol. AD, autosomal dominant; AR, autosomal recessive; GUS, gene of uncertain significance; LP, likely pathogenic; P, pathogenic; XLR, X-linked recessive; VUS, variant of uncertain significance; D, dual diagnosis; M, parental mosaic indicates recurrence risk >1%; 2, families with recurrently mutated genes; circles, female probands; squares, male probands; green, LP/P variant; yellow, candidate variant; white, unresolved.
Fig. 2
Fig. 2. Diagnoses per major organ system affected.
Distribution of probands and percentage (candidate) diagnoses per major affected organ system based on ACMG classification. LP, likely pathogenic; P, pathogenic; VUS, variant of uncertain significance; GUS, gene of uncertain significance (that is, novel gene); filled color, LP/P variant; hashed color, candidate variant; no color, no variant. Icons adapted from BioRender.com.
Fig. 3
Fig. 3
Turnaround between consent and reporting. Reduction in turnaround times as our research study progressed towards a diagnostically accredited test for the genomic investigation of perinatal death. For each specified time range, the number of probands and mean with s.d. of turnaround times are provided. Each dot represents one proband. n, number of probands.
Extended Data Fig. 1
Extended Data Fig. 1. Cohort distribution of (gestational) age, sex and classification of death.
Shows the distribution in (gestational) age, sex and death classification within the perinatal period of the 200 probands in our cohort. Only completed gestational weeks are displayed. Circle, female proband; square, male proband; red, termination of pregnancy; orange, miscarriage; light green, stillbirth; dark green, neonatal death; darker shading, LP/P variant; lighter shading, Variant or Gene of Uncertain Significance (VUS/GUS);, open box, no abnormality detected (NAD).
Extended Data Fig. 2
Extended Data Fig. 2. Sunburst diagram of the complete cohort.
A sunburst plot representing all 200 families separated by the type of pregnancy loss (2nd, most inner ring), across different organ systems (third ring), the genomic findings (fourth ring) and candidate disease genes (fifth, most outer ring). The genomic findings are separated by LP/P ((Likely) pathogenic), VUS (variant of uncertain significance), GUS (gene of uncertain significance), and NAD (no abnormalities detected). The percentages in the right-side legend represent the number of variants identified across the different pregnancy groups. This plot shows that the study cohort mostly consisted of termination of pregnancies. The input data for the sunburst plot was generated from Supplementary Table 2. All sunburst plots were generated using the sunburstR package (https://github.com/timelyportfolio/sunburstR).
Extended Data Fig. 3
Extended Data Fig. 3. Sunburst diagrams showing the characteristics of the terminated pregnancies and stillbirths.
(a) Sunburst plot representing the group of pregnancies terminated, due to in utero abnormalities, and the subsequent genomic findings. The five most affected organ systems within this subgroup are shown, with the neurological phenotypes yielding the highest number of diagnoses (36.6%). Multiple refers to two or more different organ systems affected. The genomic findings are separated by LP,P (Likely pathogenic, pathogenic), VUS (variant of uncertain significance), GUS (gene of uncertain significance), and NAD (no abnormalities detected). (b) Sunburst plot representing the group of pregnancies with stillbirth cases; pregnancy losses beyond 20 weeks of gestation. This plot shows that a majority of stillbirth cases with no genomic findings (NAD) are those with no congenital abnormalities (18.9%) identified, meanwhile stillbirth cases with affected respiratory or hematopoietic systems are more likely to yield a candidate disease gene; 7/7 POS (100%).
Extended Data Fig. 4
Extended Data Fig. 4. Sunburst diagrams showing the characteristics of the Neonatal deaths and miscarriages.
(a) Sunburst plot representing families with neonatal death; loss of an infant up to 28 days old. This plot shows that out of the four subgroups of fetal and neonatal loss, cases with neonatal deaths have the highest number of genomic findings (23/29 POS and 6/29 NAD). Neonates with respiratory and neurological abnormalities represent one third of this subgroup. Neonates with two or more major organ systems affected, and hematopoietic abnormalities, have 100% genomic findings in known and established disease genes (ADAMTSL2, FOXF1, PTPN11 and TPI1 respectively). (b) Sunburst plot representing the smallest subgroup within the study cohort, miscarriages; pregnancy losses before 20 weeks of gestation. This plot shows that there is a 66.7% chance of discovering candidate disease genes (6/9 POS) from early pregnancy loss, with and without congenital abnormalities detected in utero.
Extended Data Fig. 5
Extended Data Fig. 5. Workflow schematic of the first 200 families in the Genomic Autopsy study.
Schematic diagram of the workflow and analysis of the Genomic Autopsy Study with the goal to provide answers to families and prevent recurrence of pregnancy loss and perinatal death. Highlighting the separate clinical-grade analysis and integrated research follow-up. Mendeliome, OMIM morbid genes; AR:,Autosomal Recessive; hom, homozygous; CH, Compound Heterozygous,;XLR, X-Linked Recessive; AD, Autosomal Dominant,;VUS, Variant of Uncertain Significance; GUS, Gene of Uncertain Significance; ACMG, American College of Medical Genetics; P, Pathogenic; LP, Likely Pathogenic; PGD, Preimplantation Genetic Diagnosis; PND, Prenatal Diagnosis. Figure created using BioRender.com.
Extended Data Fig. 6
Extended Data Fig. 6. Evaluation of potential splice effects by RT-PCR and Sanger or Nanopore sequencing of PED002, PED013, PED017 and PED104.
RNA analysis for interpretation of variant effect in PED002, PED013, PED017 and PED104. (a) RT-PCR and nanopore sequencing results for PED002A (mother; blue) and PED002B (father; green) versus a control blood sample (red). The Sashimi plot shows retention of 8 intronic bases (black arrow) of the 8th intron of DNAJB11 as a result from the intronic c.853-10 G > A variant in both parents. (b) RT-PCR and Sanger sequencing of paternal cDNA shows the synonymous PIBF1 c.954 G > A p.(Lys318 = ) variant identified in PED013 causes skipping of exon 8, predicted to result in a downstream frameshift and premature termination. The right (cDNA) figure shows the initiation of a heteroduplex after exon 7, with the mutant allele continuing to exon 9. (c) RT-PCR and Sanger sequencing of fetal cDNA shows the TPI1 c.544-1 G > C variant identified in PED017 alters the canonical splice acceptor site of exon 6, resulting in an in-frame deletion of 2 amino acids. The right (cDNA) figure shows the start of a heteroduplex after exon 5, with the mutant sequence displaying a 6 bp deletion from the start of exon 6. (d) RT-PCR and nanopore sequencing on a maternal blood sample of PED104 A shows skipping of the (out-of-frame) exon 9 in MECOM as a result from the intronic c.2208 + 4A > T variant (red). The long reads included a synonymous SNP (c.2667 G > A) in exon 14, which allowed separation and comparison of the mutant (red) versus wildtype (blue) alleles.
Extended Data Fig. 7
Extended Data Fig. 7. Interpretation of Poly(A) RNA sequencing data for PED005, PED013 and PED024.
RNA sequencing analysis for interpretation of variant effect in PED005, PED013 and PED024 (a) RNA-seq confirmed that the paternal MKS1 c.1408-34_1408-6del variant results in skipping of exon 16 in the proband (red) versus control (blue) sample. The novel maternal c.1024 + 1 G > T variant revealed altered splicing downstream of exon 11, resulting in partial inclusion of intron 12. (b) RNA-seq for PED013, showing skipping of exon 8 in the proband sample (red) versus control (blue) as a result from the synonymous PIBF1 c.954 G > A p.(Lys318=) variant. (c) RNA-seq results for PED024, showing retention of intron 2 (yellow box) in the proband sample (red) verus control samples (blue and green), and much lower expression values which are likely due to nonsense mediated decay as a result from the intronic EIF2B2 c.284 + 5 G > T variant.
Extended Data Fig. 8
Extended Data Fig. 8. Relatedness and quad analysis diagrams.
(a) Boxplot shows the relatedness coefficients (y-axis) of all families (dots) and their diagnostic findings based on mode of inheritance (x-axis). The relatedness coefficients were calculated using Peddy, and required a minimum of 1000 shared heterozygous alternate calls per sample. This boxplot indicates that families that are related are more likely to yield a (candidate) diagnosis (12/16, 75%), compared to unrelated families (93/184, 50.5%), not statistically significant (P value = 0.0710, Two-sided Fisher’s exact test). (b) Diagnostic yield from families with two affected individuals. This bar plot shows the sex of the two affected individuals per family and the exome findings categorised by their ACMG classifications. There is a slightly higher proportion of families, where both affected individuals are males, with no diagnostic finding (8/14, 57.1%) versus mixed sex siblings (2/5, 40%). Abbreviations: ACMG, American College of Medical Genetics; AD, Autosomal dominant; AR, Autosomal recessive; XLR, X-linked recessive; NAD, no abnormalities detected; LP/P, likely pathogenic or pathogenic; VUS, variant of uncertain significance; GUS, Gene of uncertain significance.
Extended Data Fig. 9
Extended Data Fig. 9. Interpretation of droplet digital PCR results for parents with mosaicism >1%.
(a) ddPCR shows the PBX1 p.Arg107Trp variant in PED043 is present at different allelic ratios in paternal sperm (20.1%) compared to paternal blood (10.4%). The mother does not carry the variant and s and the proband is heterozygous. (b) ddPCR of the TUBA1A p.Arg64Trp variant in PED084 is present at an allelic ratio of 2.9% in paternal sperm and at 2.3% in paternal blood. The maternal sample is negative for the mutation, and the proband is heterozygous. Figures are generated by the original QuantasoftTM software for ddPCR analysis (BioRad). The concentration (copies/µl) of the WT and the Mutant allele are used to calculate the fractional abundance (mean with 95% CI).

Comment in

References

    1. AIHW. Stillbirths and Neonatal Deaths in Australia. https://www.aihw.gov.au/reports/mothers-babies/stillbirths-and-neonatal-... (2020).
    1. Flenady V, et al. Stillbirths: recall to action in high-income countries. Lancet. 2016;387:691–702. doi: 10.1016/S0140-6736(15)01020-X. - DOI - PubMed
    1. Hug L, Alexander M, You D, Alkema L, Inter-agency UN. Group for Child Mortality Estimation. National, regional, and global levels and trends in neonatal mortality between 1990 and 2017, with scenario-based projections to 2030: a systematic analysis. Lancet Glob. Health. 2019;7:e710–e720. doi: 10.1016/S2214-109X(19)30163-9. - DOI - PMC - PubMed
    1. Hoyert, D. L. & Gregory, C. W. Cause of Fetal Death: Data From the Fetal Death Report, 2014. https://www.cdc.gov/nchs/data/nvsr/nvsr65/nvsr65_07.pdf (2016). - PubMed
    1. Homer CSE, Malata A, Ten Hoope-Bender P. Supporting women, families, and care providers after stillbirths. Lancet. 2016;387:516–517. doi: 10.1016/S0140-6736(15)01278-7. - DOI - PubMed

Publication types