. 2023 Feb;55(2):268-279.
doi: 10.1038/s41588-022-01279-6. Epub 2023 Jan 19.

Genome-wide RNA polymerase stalling shapes the transcriptome during aging

Affiliations

Genome-wide RNA polymerase stalling shapes the transcriptome during aging

Akos Gyenis et al. Nat Genet. 2023 Feb.

Abstract

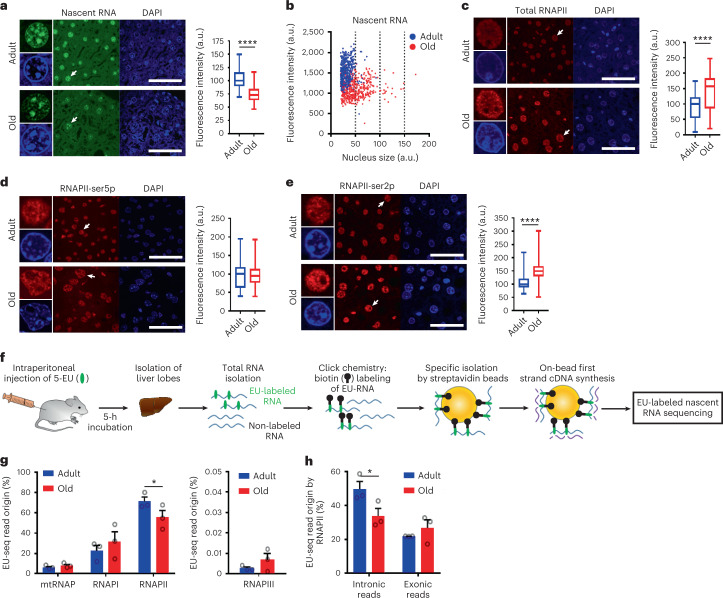
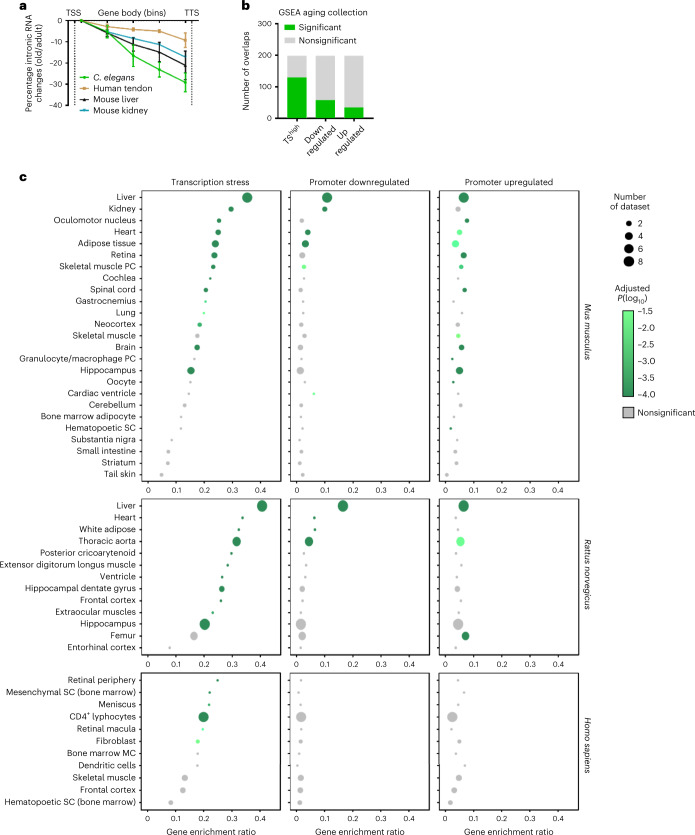
Gene expression profiling has identified numerous processes altered in aging, but how these changes arise is largely unknown. Here we combined nascent RNA sequencing and RNA polymerase II chromatin immunoprecipitation followed by sequencing to elucidate the underlying mechanisms triggering gene expression changes in wild-type aged mice. We found that in 2-year-old liver, 40% of elongating RNA polymerases are stalled, lowering productive transcription and skewing transcriptional output in a gene-length-dependent fashion. We demonstrate that this transcriptional stress is caused by endogenous DNA damage and explains the majority of gene expression changes in aging in most mainly postmitotic organs, specifically affecting aging hallmark pathways such as nutrient sensing, autophagy, proteostasis, energy metabolism, immune function and cellular stress resilience. Age-related transcriptional stress is evolutionary conserved from nematodes to humans. Thus, accumulation of stochastic endogenous DNA damage during aging deteriorates basal transcription, which establishes the age-related transcriptome and causes dysfunction of key aging hallmark pathways, disclosing how DNA damage functionally underlies major aspects of normal aging.


Conflict of interest statement

The authors declare no competing interests.

Figures

Fig. 1
Fig. 1. Reduced RNA synthesis and increased RNAPII levels in aged liver.
a, EU-labeled nascent RNA (green) in hepatocyte nuclei (DAPI counterstain, blue) in adult (blue) and old mouse liver (red). Right, Fluorescence intensities quantified in box and whisker plots. The center lines show the medians, the box limits mark the IQR, and the whiskers indicate the minimum and maximum values. P = 2.1129 × 10−129 (two-sided unpaired t-test). Counted nuclei: adult n = 506; old n = 500; n = 3 mice per group. b, XY scatterplot of fluorescence intensity of EU-labeled nascent RNA (arbitrary units (a.u.)) and corresponding nuclear sizes measured in individual hepatocytes of WT adult (blue) and old (red) liver. ce, Total RNAPII (c), RNAPII phosphorylated at ser5p (d) and RNAPII phosphorylated at ser2p (e) immunofluorescence staining (red) in hepatocytes (counterstained by DAPI, blue) in adult and old liver. Box and whisker plots of fluorescence intensities. The center lines show the medians, the box limits mark the IQR, and the whiskers indicate the minimum and maximum values. P values by two-sided unpaired t-test, n = 3 mice per group. Counted nuclei and P values: c, adult: n = 206; old: n = 155, P = 6.64186 × 10−21; d, adult n = 2,926; old n = 2,643, P = 0.323195587; e, adult n = 2,697; old n = 2,708. P = 0. Scale bar, 50 μm. f, Flow chart of the experimental procedure for EU-labeled nascent RNA sequencing. g, Fraction (%) of EU-seq reads synthesized by different RNA polymerases. RNAPI–II and mtRNAP (left) and RNAPIII (right), with total sequence reads of adult and old normalized to 100%. Data are the mean ± s.e.m. n = 3 mice per group. P = 0.012868073 (two-sided unpaired t-test). h, Fraction (%) of EU-seq reads by RNAPII from intronic and exonic regions. Data are the mean ± s.e.m. n = 3 mice per group. P = 0.013520897 (two-sided unpaired t-test). Source data
Fig. 2
Fig. 2. RNAPII promoter activity in aged liver.
a,b, Mean total RNAPII and RNAPII ser5p ChIP–seq read abundance around TSS (TSS ± 750 bp region) of all genes in adult (blue) and old (red) livers. The gray line represents input DNA control ChIP–seq. c, XY scatterplot of RNAPII travel ratio of all expressed genes from adult (x axis) and old (y axis) liver in total RNAPII ChIP–seq data. Each dot represents a gene. Each gene is the average of n = 3 mice per group. d,e, XY scatterplot depicting nascent RNA synthesis the first 1 kb of introns from the TSS (d) or from the TSS to 1 kb downstream (e) of all genes in adult (y axis) and old (x axis) livers. Each dot represents a gene in which the signal represents the mean of n = 3 mice. f, Three-bin heatmap of log2 fold changes (old/adult) of nascent RNA (left) and total RNAPII (right) on gene bodies of promoter-upregulated and downregulated clusters genes. Each row represents one gene. g,h, Bar diagram showing the overlap between all GSEA aging datasets from mice (g) or rat (h) and the transcriptionally upregulated and downregulated clusters. The significance and FDR for each overlap were calculated by Fisher’s exact test and multiple testing correction by Benjamini–Hochberg method. FDR < 0.05 defined as significant. Source data
Fig. 3
Fig. 3. Gene-length-dependent RNAPII stalling in old mouse livers.
a, Three-bin heatmap of log2 fold changes (old/adult) of nascent RNA and ChIP–seq of total RNAPII on gene bodies, sorted by level of transcriptional decline on all expressed genes. bd, Relative sequencing densities of the transcription elongation phase between TSS and TTS. b, Nascent RNA sequencing in adult (blue) and aged (red) liver. c, Total RNAPII ChIP–seq in adult (blue) and aged (red) liver. d, RNAPII-ser2p ChIP–seq in adult (blue) and aged (red) liver. All expressed genes; n = 3 mice per group. P values: unpaired two-sided t-test with 32 d.f. Data are presented as the mean ± s.e.m. e,f, Percentage sequencing read density change in the transcription elongation phase in aging between TSS and TTS of gene categories based on genomic gene length: EU-seq (e) and total RNAPII ChIP–seq (f). g, Percentage sequencing read density change (old/adult) in EU-seq as seen in Fig. 2e, in which the x axis is the average gene length of each category. h, Scatter plot depicting all expressed gene lengths >20 kb (x axis) and percentage change between old and adult in EU-seq densities from TSS to 20 kb downstream (y axis) (n = 3,308). i, Percentage stalled RNAPII in gene bodies. The colors indicate the gene-length classes as in Fig. 2e. Data are the mean ± s.d. (10–22 kb: n = 662; 22–30 kb: n = 644; 30–50 kb: n = 788; 50–70 kb: n = 587; 70–110 kb: n = 643; and >110 kb: n = 646). Source data
Fig. 4
Fig. 4. Age-related RNAPII stalling on DNA damage.
a, EU-labeled nascent RNA (green) in liver nuclei from 7- and 14-week-old Xpg−/− mice compared to 7-week-old WT mice. b, Box and whisker plot quantification of Fig. 4a. The center lines show the medians, the box limits mark the IQR, and the whiskers indicate the minimum and maximum values. P values: 7-week-old Xpg−/− versus WT P = 2.4688 × 10−285; 14-week-old Xpg−/− versus WT P = 0; two-sided unpaired t-test, 3 mice per group; counted nuclei n = 916, 864 and 738 for WT, Xpg−/− aged 7 and 14 weeks. c,d, Percentage EU-seq read density changes between TSS and TTS in Xpg−/− (c) and Ercc1Δ/− mice (d) compared to WT liver aging (104 weeks, black line). e, Percentage decline in nascent RNA production in Xpg−/−, Ercc1Δ/− and WT quiescent MDFs after 1, 2 and 4 weeks of culturing under hypoxic (3%) and normoxic (20%) conditions. Data are the mean ± s.d. P values (two-sided unpaired t-test) are: week 2: Ercc1Δ/− versus WT: P = 0.002353336; week 4, Xpg−/− versus WT: P = 6.13324 × 10−9; Ercc1Δ/− versus WT: P = 1.21727 × 10−9. Number of nuclei: 3% O2, week 1: 14 Xpg−/− and 14 WT; 17 Ercc1Δ/− and 14 WT; week 2: 15 Xpg−/− and 16 WT; 17 Ercc1Δ/− and 13 WT; week 4: 29 Xpg−/− and 27 WT; 34 Ercc1Δ/− and 28 WT. f, Box and whisker plot of fluorescent EU-labeled nascent RNA in Ercc1Δ/− MDFs 24 h after UVC irradiation. The center lines show the medians, the box limits mark the IQR, and the whiskers indicate the minimum and maximum values. P values (two-sided unpaired t-test): 2 J m2 versus 0 J m2 = 5.66445 × 10−8; 4 J m2 versus 0 J m2 = 2.92531 × 10−28; 6 J m2 versus 0 J m2 = 5.59594 × 10−52. Counted nuclei: 0 J m2, n = 146; 2 J m2, n = 118; 4 J m2, n = 132; 0 J m2, n = 137. g, Percentage of EU-seq read densities of genes >110 kb from the TSS to 10 kb upstream in Ercc1Δ/− MDFs 24 h after UVC irradiation compared to nonirradiated cells. Black line: >110 kb gene class from normal liver aging data. h, Bias (fraction) of sequencing reads mapping to the coding strand during WT aging from total RNAPII and RNAPII-ser2p ChIP–seq data across all genes (n = 3,809), short (10–22 kb, n = 512) and longest genes (>110 kb, n = 779). P < 0.0001, two-sided unpaired t-test compared to genes with gene length 1–10 kb, 3 mice per group. Data are the mean ± s.e.m. i, Bias (fraction) of sequencing reads mapping to the coding strand during WT aging from total RNAPII and RNAPII-ser2p ChIP–seq data through gene body (3 bins) in all genes and the longest genes (>110 kb, n = 779). Data are the mean ± s.e.m. j, Sequencing read density profiles of the Ghr gene from EU-seq, total RNAPII (all reads aggregated) and total RNAPII split in coding and template strand in WT adult (blue) and aged (red) liver. k, Phosphorylated ATM (red) and γH2A.X (green) in adult and aged mouse liver. Right, Fluorescence intensities shown as box and whisker plots. The center lines show the medians, the box limits mark the IQR, and the whiskers indicate the minimum and maximum values. P = 7.19752 × 10−27 (two-sided unpaired t-test). Counted nuclei: adult n = 313; old n = 315; n = 3 mice per group. Scale bar, 50 μm. Source data
Fig. 5
Fig. 5. Transcriptional stress affects mRNA output and aging-related pathways.
a,b, Sequencing density profiles of the entire Igf1 gene (mm10, chr10:87,858,265–87,937,047), including RNAPII coding strand bias (a) and exons only (b) from EU-seq of adult (blue) and aged (red) WT mouse liver. Exons 1a and 1b are alternative start sites. c, EU-seq density ratios between last and first exons for all expressed genes (P = 5.06731 × 10−9), short (10–22 kb) and long genes (>110 kb, P = 0.000482946). Data are the mean ± s.e.m. P values are from a two-sided unpaired t-test (old versus adult). d, Full transcript abundances (relative to adult) estimated by reads covering 3′UTR from EU-seq of all expressed genes (P = 0.048761825), short (10–22 kb) and long genes (>110 kb, P = 1.78654 × 10−6). Data are the mean ± s.e.m., P values are from a two-sided unpaired t-test. e, Significant overrepresented pathways in TShigh genes by IPA, KEGG, Reactome and GSEA-hallmarks classified by main process category (bold). Aggregated P values were obtained from a Fisher’s exact test. See Supplementary Table 2 for detailed pathway information. Source data
Fig. 6
Fig. 6. Transcriptional stress in different species and tissues.
a, Percentage EU-seq read density changes of transcription elongation between TSS and TTS of expressed genes (5-bin distribution) in EU-seq data from WT aged mouse liver (black, this study, n = 3 per group, n = 3,970 genes), aged mouse kidney (n = 2 per group, n = 2,135 genes, 7.5 weeks versus 104 weeks, blue) and total RNA-seq of human tendon (n = 4 per group, n = 773 genes, 69.5 ± 7.3 years versus 19 ± 5.8 years; brown) and C. elegans (n = 3 per group, n = 2,872 genes, day 10 versus day 1 after young adult stage; green). Data are the mean ± s.e.m. b, Bar diagram of the overlap between GSEA aging datasets and TShigh, promoter-upregulated and downregulated gene classes identified in our study. Significance and FDR were calculated by Fisher’s exact test and Benjamini–Hochberg method. c, Gene enrichment ratio (x axis) between identified gene groups and GSEA aging datasets in three species: mouse (top), rat (middle) and human (bottom); TShigh (left), promoter-downregulated (middle) and promoter-upregulated (right). Dot size represents the number of GEO aging datasets. If >1 dataset of a tissue was present, the mean ± s.d. and aggregated P value (Fisher’s exact test) are shown. Source data
Fig. 7
Fig. 7. Age-related transcriptional stress model.
Model describing RNAPII stalling by DNA damage and its consequences in aging.
Extended Data Fig. 1
Extended Data Fig. 1. Relation between RNAPII fluorescent intensity and corresponding nuclear sizes measured in individual hepatocytes, related to Fig. 1.
ac, XY-scatterplots of (a) total RNAPII, (b) RNAPII-ser5p and (c) RNAPII-ser2p; A.U.: arbitrary units. blue: wildtype adult livers; red= old liver. n = 3 mice/group. Total number of counted nuclei: a, adult: n = 206, old: n = 155. b, adult, n = 748; old n = 701. c, adult: n = 984; old, n = 674. Source data
Extended Data Fig. 2
Extended Data Fig. 2. Nascent RNA sequencing (EU-Seq) computational analysis and controls, related to Fig. 1.
a, EU-labelled nascent RNA sequencing (EU-seq) analyses flowchart. b, c, Sequence read distribution in EU-seq and total-RNA sequencing in introns and exons (b) and mapped on genes (c), showing increased number of intronic reads in EU-seq, indicating nascent RNA enrichment. d, Bioanalyzer plots of on-bead synthesized cDNA to generate EU-seq libraries. Since reverse transcriptase cannot synthesize cDNA through biotin covalently bound to DNA, cDNA is only generated between covalently EU-bound biotins or from EU-bound biotin to the RNA end. Adult and old cDNA is almost identical, indicating similar EU incorporation rates. e, table depicting EU incorporation for a range of distances between EU molecules as modelled by Poisson process. Three groups of RNA species were examined: 1) ≤300 nucleotides (n = 7932), 2) 1000 to 3000 nucleotides (n = 1983), and 3) 2000 to 4000 nucleotides (n = 1802). Shown is median and Interquartile Range (IQR). f, statistical and probabilistic framework table depicting 1.5-fold reduction for a range of EU incorporation distance differences. If EU incorporation differs between adult and old, it is expected that in RNA species ≤300 nucleotides the probability of at least one EU incorporation is significantly lower. For each specified pair of 1.5-fold apart intensities, the expected fold change in aged liver was calculated and the corresponding 7932-dimensional vectors of probabilities were compared by Mann-Whitney U-test. There is a very high, significant probability that a difference should be observed between adult and old (p < 2.2 × 10⁻¹⁶, column 3) if there is a 1.5-fold reduction in EU incorporation in aged liver. g, percentage sequence reads in EU-seq datasets mapping to RNA species length categories i) ≤300 nucleotides, ii) 1000 to 3000 nucleotides, and iii) 2000 to 4000 nucleotides. The ≤300 nucleotides length category shows a non-significant (p-value = 0.061093, two-sided unpaired t-test) 1.2-fold increase in aged liver, indicating that it is unlikely that EU availability is different between adult and aged livers. Data are mean ± SEM. h, percentage EU-labelled nascent RNA reads synthesized by different RNA polymerases (RNAPI-II-III, and mitochondrial RNAP (RNAP-MT)). Adjusted old values (orange) were calculated by proportional compensation of nascent transcription reduction as observed in Fig. 1a. n = 3 mice/group. Data are mean ± SEM. i, Alternative splicing in EU-seq data. n = 3 mice/group. Data are mean ± SEM. j, Ratios of splice donor and acceptor sites in EU-seq. n = 3 mice/group. Data are mean ± SEM. Source data
Extended Data Fig. 3
Extended Data Fig. 3. Gene category classification, transcription characteristics of gene classes and RNAPII stalling calculation, related to Figs. 2 and 3.
a, Schematic representation of k-means clustering-based identification of putative regulatory mechanisms behind the aging-related gene expression changes. b, c, The mean Log2-fold change of EU-seq and total RNAPII ChIP-seq reads in aging liver throughout the gene bodies (3 bins) of (b) ‘Promoter-upregulated’ genes (n = 778) and (c) ‘Promoter downregulated’ genes (n = 394). Calculated from main Fig. 2 f. Data are mean ± SEM. d, Average gene length (left panel) of all expressed genes, promoter-upregulated genes, promoter-downregulated genes, and genes with a high gradual loss of productive transcription (GLPThigh) as seen in Fig. 2a and classified by gene length (right panel) Groups: 10–22 kb (blue; n = 662); 22–32 kb (black; n = 644); 32–50 kb (pink; n = 788), 50–70 kb (yellow; n = 587), 70–110 kb (orange; n = 643) and >110 kb (red; n = 646). Data are mean ± SEM. P-value = 7.84163*10−22, two-sided unpaired t-test. e, The contribution (%) of each gene-length class to the total nascent RNA pool in adult samples. f, Calculation of the fraction of unproductive RNAPII complexes in aged liver. g, Estimation of the number of stalling RNAPII complexes in aged liver. Source data
Extended Data Fig. 4
Extended Data Fig. 4. Correlation of transcriptional parameters to defined functional gene clusters, related to Fig. 4.
Transcriptional parameters in the identified functional gene clusters (as described in Extended Fig. 3a): ad, average nucleotide composition per kb gene length in the template strand for the first 70 kb from TSS of top 50 GLPThigh genes 70–80 kb (black line) compared to 50 remainder genes 70–80 kb that contain low GLPT levels (red line). Data are mean ± SEM. e, Transcriptional error rates in EU-seq data from wildtype adult (blue) and old (red) livers in 4 different gene sets: ‘Promoter-upregulated’ (n = 778), ‘Promoter-downregulated’ (n = 394), GLPThigh (n = 914), remainder (n = 1884). Data are mean ± SEM. f, Bar diagram showing the ratio between EU-seq reads mapped to splice donor and acceptor sites of genes in each functional gene cluster in e. Average of n = 3 / group shown. Data are mean ± SD. Source data
Extended Data Fig. 5
Extended Data Fig. 5. Levels of RNAPII or epigenetic markers around the TSS (±750 bp) of each defined functional gene cluster, related to Fig. 4.
Functional gene clusters: promoter-upregulated genes, promoter-downregulated genes, genes with a high gradual loss of productive transcription (GLPThigh) and remainder. Data are mean ± s.d. Blue lines represent adult liver, red lines represent old liver. Average of n = 3 / group shown for: a, Total RNAPII. b, serine 5 phosphorylated (ser5p) RNAPII. c, histone 3 lysine 27 acetylation (H3K27Ac; open chromatin). d, histone 3 lysine 4 trimethylation (H3K4Me3; open chromatin). e, inaccessible chromatin as MNase digests only DNA not bound to proteins including nucleosomes. Source data
Extended Data Fig. 6
Extended Data Fig. 6. Levels of epigenetic markers throughout gene bodies of each defined functional gene cluster, related to Fig. 4.
Functional gene clusters: promoter-upregulated genes, promoter-downregulated genes, genes with a high gradual loss of productive transcription (GLPThigh) and remainder. Blue lines represent adult liver, red lines represent old liver. Average of n = 3 / group shown of sequencing read density from TSS + 750 bp to TTS + 4 kb for: a, histone 3 lysine 27 acetylation (H3K27Ac; open chromatin). b, histone 3 lysine 4 trimethylation (H3K4Me3; open chromatin). c, inaccessible chromatin as MNase digests only DNA not bound to proteins including nucleosomes. d, DNA methylation status. Source data
Extended Data Fig. 7
Extended Data Fig. 7. DNA damage-induced coding strand bias detection control, related to Fig. 4.
a, Bar diagram representing the coding strand bias in total RNAPII ChIP-seq data 1 hour and 6 hours after irradiating MCF7 cells with 55 J/m2 UVB (data from). All genes (n = 18224), short genes (10–22 kb) and long genes (>110 kb). Data are mean ± SEM. Note that the strand bias is only present in MCF7 cells 1 hour after UVB treatment, when RNAPII is still stalled on DNA lesions and DNA repair is ongoing. After 6 hours, most of the stalled RNAPII has been removed from the DNA lesions. This shows that i) the protocol used is able to detect a bias towards the coding strand and therefore can be used to analyze aging samples, ii) the coding strand bias is a transient phenotype after UVB. Based on published amounts of coding strand bias after a known UVC-induced DNA lesion density, we estimate that livers from wildtype aged mice display a coding strand bias fraction in the range of 0.05–0.10. b–f, Mean local DNA methylation coverage (b) and (c–f) local nucleotide composition status in template strands of 50 genes with that exhibit the highest coding strand bias in general. The intragenic intronic region is chosen with the highest coding strand bias (high strand bias loci). This loci gene set is compared t i) random selected intragenic loci of similar size: 6 times 50 random intronic locations in the template strand, and ii) the complete intronic transcriptome; all introns from transcriptome (including high strand bias locations). Average of n = 50 / group shown. Data are mean ± SD. Source data

References

    1. López-Otín C, Blasco MA, Partridge L, Serrano M, Kroemer G. The hallmarks of aging. Cell. 2013;153:1194–1217. doi: 10.1016/j.cell.2013.05.039. - DOI - PMC - PubMed
    1. Lindholm DB. Decreased transcription of neuronal polyadenylated RNA during senescence in nuclei from rat brain cortex. J. Neurochem. 1986;47:1503–1506. doi: 10.1111/j.1471-4159.1986.tb00785.x. - DOI - PubMed
    1. Davie K, et al. A single-cell transcriptome atlas of the aging Drosophila brain. Cell. 2018;174:982–998. doi: 10.1016/j.cell.2018.05.057. - DOI - PMC - PubMed
    1. Martinez-Jimenez CP, et al. Aging increases cell-to-cell transcriptional variability upon immune stimulation. Science. 2017;355:1433–1436. doi: 10.1126/science.aah4115. - DOI - PMC - PubMed
    1. Işıldak U, Somel M, Thornton JM, Donertas HM. Temporal changes in the gene expression heterogeneity during brain development and aging. Sci. Rep. 2020;10:4080. doi: 10.1038/s41598-020-60998-0. - DOI - PMC - PubMed

Publication types

Substances

LinkOut - more resources