. 2023 Feb;55(2):232-245.
doi: 10.1038/s41588-022-01280-z. Epub 2023 Jan 19.

Notch1 mutations drive clonal expansion in normal esophageal epithelium but impair tumor growth

Affiliations

Notch1 mutations drive clonal expansion in normal esophageal epithelium but impair tumor growth

Emilie Abby et al. Nat Genet. 2023 Feb.

Abstract

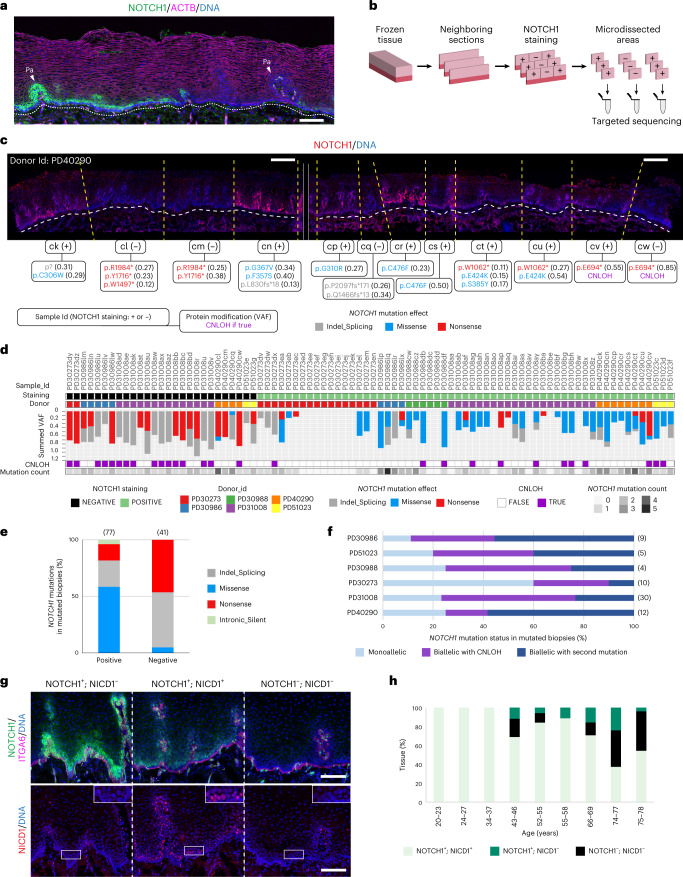
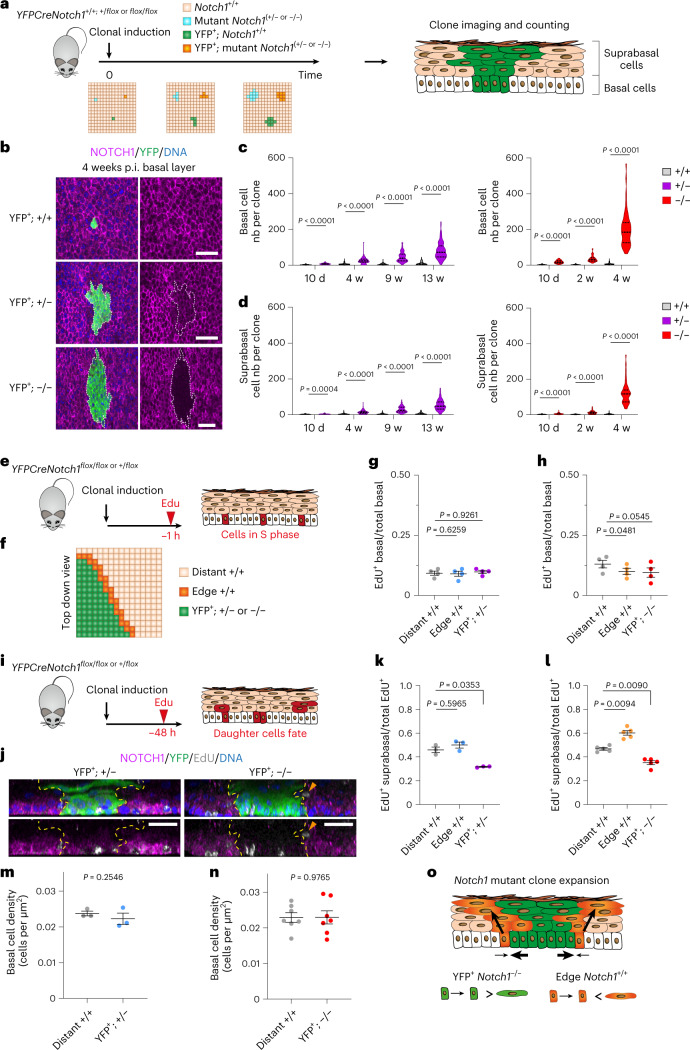
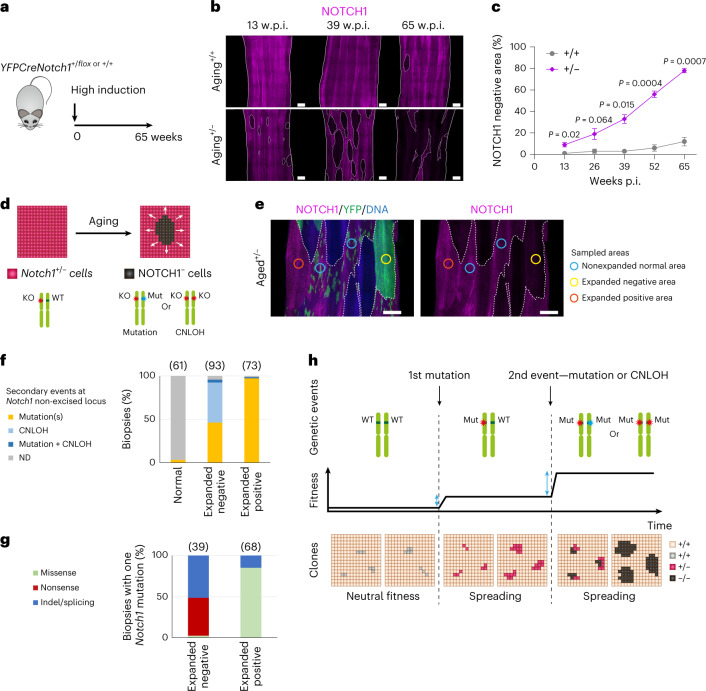
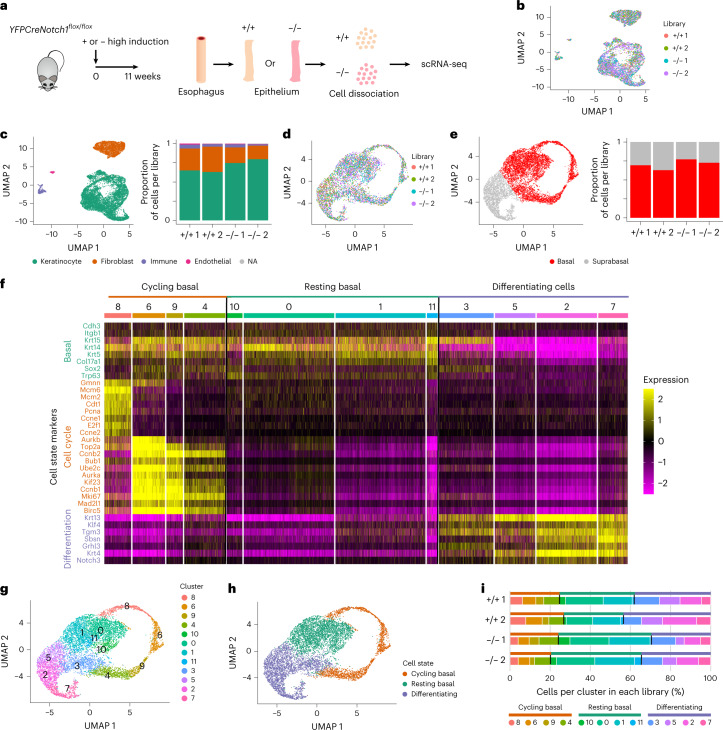
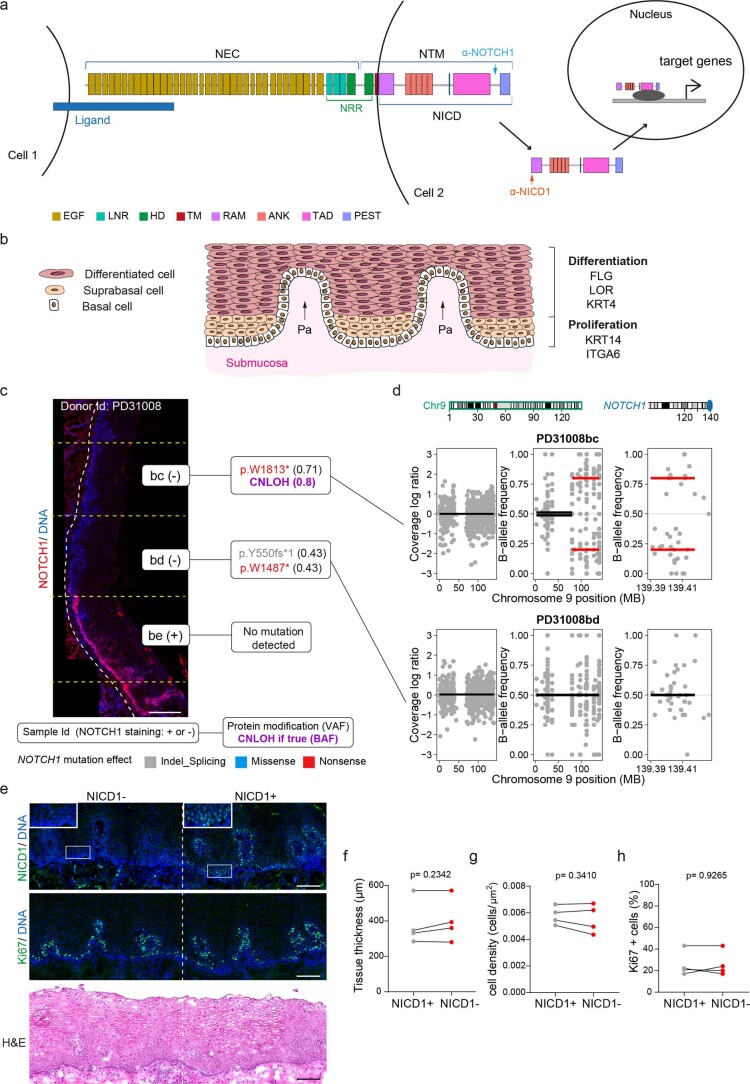
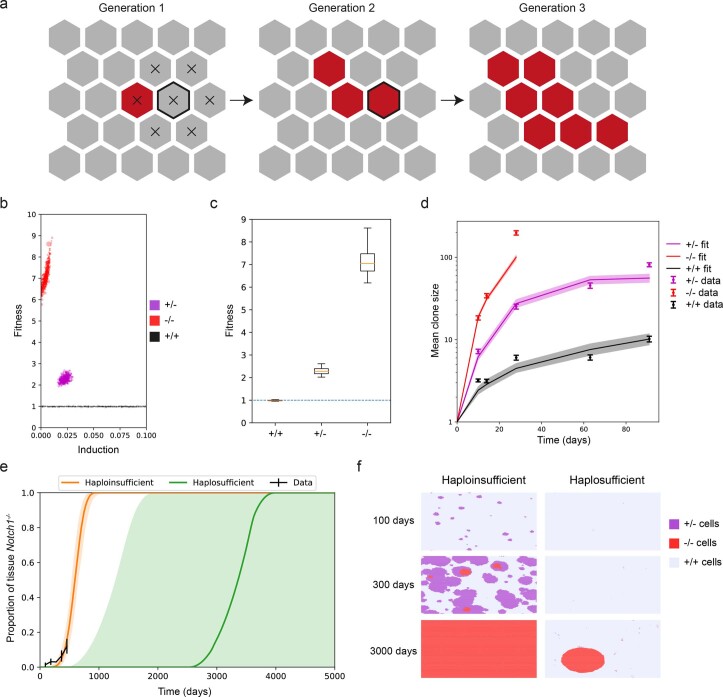
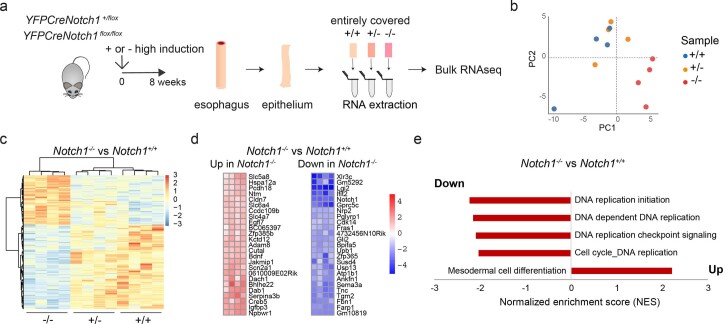
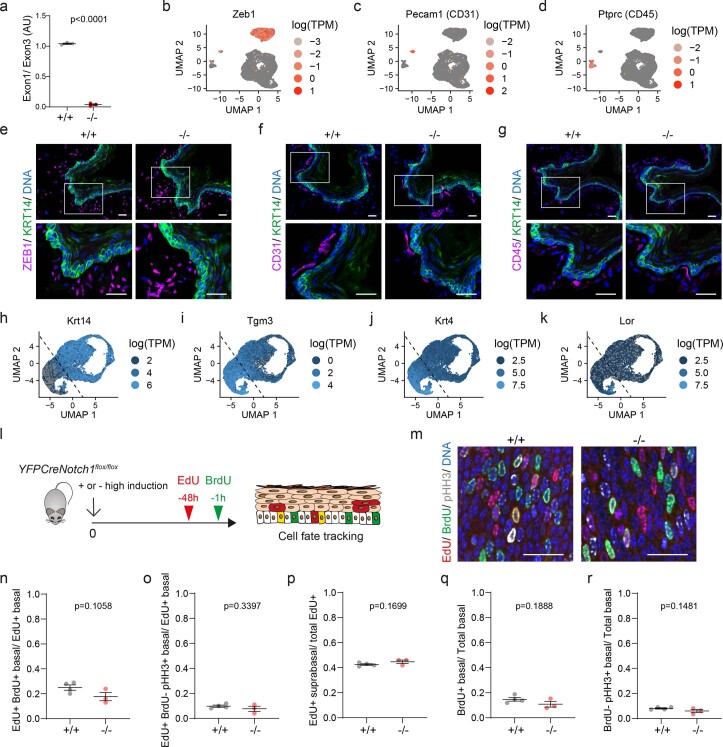
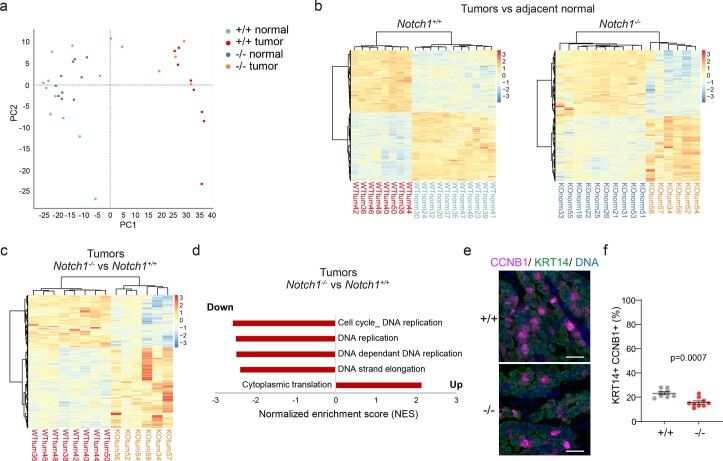
NOTCH1 mutant clones occupy the majority of normal human esophagus by middle age but are comparatively rare in esophageal cancers, suggesting NOTCH1 mutations drive clonal expansion but impede carcinogenesis. Here we test this hypothesis. Sequencing NOTCH1 mutant clones in aging human esophagus reveals frequent biallelic mutations that block NOTCH1 signaling. In mouse esophagus, heterozygous Notch1 mutation confers a competitive advantage over wild-type cells, an effect enhanced by loss of the second allele. Widespread Notch1 loss alters transcription but has minimal effects on the epithelial structure and cell dynamics. In a carcinogenesis model, Notch1 mutations were less prevalent in tumors than normal epithelium. Deletion of Notch1 reduced tumor growth, an effect recapitulated by anti-NOTCH1 antibody treatment. Notch1 null tumors showed reduced proliferation. We conclude that Notch1 mutations in normal epithelium are beneficial as wild-type Notch1 favors tumor expansion. NOTCH1 blockade may have therapeutic potential in preventing esophageal squamous cancer.


Conflict of interest statement

The authors declare no competing interests.

Figures

Fig. 1
Fig. 1. NOTCH1 mutant clones in human esophageal epithelium.
a, Cyrosection of human esophagus. NOTCH1 (green) stains basal and lower suprabasal layer cells, expression is lost in regions of the esophagus. F-actin, magenta; Pa, papillae. Dotted line indicates epithelial submucosal boundary. Image representative of three donors. Scale bar, 100 µm. b, Protocol for cf. Cryosections were stained for NOTCH1. Contiguous NOTCH1+ and NOTCH1 staining areas were microdissected and sequenced. c, Representative images from b for donor PD40290. NOTCH1 is red, DNA is blue. Upper labels show sample identification (Id) and NOTCH1 staining status (positive, + or negative, −) for each sample. Lower labels show nonsynonymous NOTCH1 mutations and VAF and indicate CNLOH if detected. Only mutations with VAF > 0.1 are displayed. Mutation effects are color coded (indel_splicing, gray; missense, blue; nonsense, red). Dashed lines delineate the epithelium and submucosa (white) and borders of sequenced samples (yellow). Solid lines separate the two images of the adjacent regions. Scale bars, 250 µm. d, Results from b, showing NOTCH1 staining, donor identification, NOTCH1 mutation calling, CNLOH affecting NOTCH1 locus and number of NOTCH1 mutations per sample (n = 86 samples from six donors aged 43–78 years). e, Proportion of missense, nonsense, indel/splicing or intronic/silent NOTCH1 mutations in NOTCH1+ and NOTCH1 samples. Number of NOTCH1 mutations for each group is shown in brackets. f, Proportion of NOTCH1 mutant samples carrying monoallelic or biallelic NOTCH1 alterations in each donor. ‘Biallelic with second mutation’ category includes samples without CNLOH, carrying at least two mutations with VAF ≥ 0.15. Numbers in brackets are total number of NOTCH1 mutated samples per donor. g, NOTCH1 (green, upper panel) and NICD1 (red, lower panel) staining in successive sections of epithelium from an aged donor. ITGA6 (magenta) marks the basal cells. DNA is blue. Inset shows basal and lower suprabasal cells (white rectangles). Dashed lines delineate staining pattern. Images representative of six middle-aged and elderly donors. Scale bar, 100 µm. h, Proportion of tissue positive or negative for NOTCH1 and NICD1 in donors aged 20–78 years (total section length 4774–17988 µm per donor, n = 9 donors). Id, identification. See Supplementary Tables 1–5.
Fig. 2
Fig. 2. Lineage tracing of Notch1 mutant clones.
a, Protocol. YFPCreNotch1+/+, YFPCreNotch1+/flox and YFPCreNotch1flox/flox mice were induced at clonal density. YFP+ Notch1 wild type (+/+) and YFP+ Notch1 mutant clones (+/− or −/−) were imaged at several time points. b, xy plane basal layer view at 4 weeks p.i. of wild type, Notch1+/− and Notch1−/− clones stained for NOTCH1, magenta, YFP, green and DNA, blue. White dashed lines delineate mutant clones. Scale bars: 30 µm. c,d, Basal (c) and suprabasal (d) cells per clone following induction of Notch1+/− (left panel) or Notch1−/− (right panel) compared to Notch1+/+ clones. Lines show median and quartiles. n mice (clones) for +/+ at 10 d, 2 weeks, 4 weeks, 9 weeks and 13 weeks, respectively: 3 (206)/ 3 (155)/ 3 (143)/ 3 (132)/ 3 (126). n mice (clones) for +/− at 10 d, 4 weeks, 9 weeks and 13 weeks, respectively: 5 (84)/4 (97)/4 (68)/7 (107). n mice (clones) for −/− at 10 d, 2 weeks, 4 weeks, respectively: 6 (68)/ 3 (69)/ 9 (63). Two-tailed Mann–Whitney test of mutant against +/+ at each time point. e, Protocol. YFPCreNotch1+/flox and flox/flox mice were clonally induced, and S phase cells labeled with EdU, 1 h precollection (red). f, EdU+ cells were counted inside clones (green), in wild-type cells adjacent to clones (orange) or distant from clones (beige). g,h, Ratio of EdU+: total basal cells in YFP+ Notch1+/− (g) or Notch1−/− (h) mutant clones (YFP+; +/− or −/−), in wild type cells at clone edges (edge +/+) or distant from clones (distant +/+). (Mean ± s.e.m., each dot represents a mouse; g, n = 4830; 1584; 4607 cells in distant +/+; edge +/+; YFP+ +/− clones from four mice; h, n = 3967; 1036; 4279 cells in distant +/+; edge +/+; YFP+ −/− clones from four mice). One-way RM ANOVA; adjusted P values from Tukey’s multiple comparisons test against distant+/+. i, Protocol. Mice were clonally induced and EdU injected 48 h before collection. Labeled cells, red, reveal division outcomes. j, Z plane (side) views of projected confocal z stacks of YFP+ Notch1+/− clone 13 weeks p.i. (left), and YFP+ Notch1−/− clone 4 weeks (p.i. right) from (i). NOTCH1 (magenta); YFP (green); EdU (gray); DNA (blue). Yellow dashed lines show clone edges. Orange arrow shows differentiating cell adjacent to clone. Images representative of clones in 3 YFPCreNotch1+/flox and 5 YFPCreNotch1flox/flox mice. Scale bars: 30 µm. k,l, Protocol as in i. EdU+ suprabasal/total EdU+ cells in YFP+ Notch1+/− (k), YFP+ Notch1−/− (l) mutant clones (YFP+; +/− or −/−), in wild type cells at clone edges (edge +/+) or distant from (distant +/+) clones. (Mean ± s.e.m., each dot represents a mouse; k, n = 471; 300; 525 EdU+ cells in distant +/+; edge +/+; YFP+ +/− clones from three mice; l, n = 1304; 723; 1318 EdU+ cells in distant +/+; edge +/+; YFP+ −/− clones from five mice). One-way RM ANOVA; adjusted P values, Tukey’s multiple comparisons test against distant+/+. m,n, Basal cell density in mutant clones (+/− in m, −/− in n) and in respective distant wild-type areas (distant +/+). (Mean ± s.e.m., each dot represents a mouse. n = 3 mice in m, n = 6 mice in n). Two-tailed paired Student’s t-tests. o, Mechanism of Notch1 mutant clone expansion. Mutant cell divisions produce more progenitors than differentiating cells on average. Neighboring wild-type cells stratify at the edge of Notch1−/− mutant clones, allowing accelerated mutant clone expansion. P.i., postinduction. Nb, number. RM, repeated measures; w, weeks. See Supplementary Tables 7 and 8.
Fig. 3
Fig. 3. Notch1 mutants colonize aging esophageal epithelium.
a, YFPCreNotch1+/flox and YFPCreNotch1+/+ mice were induced at a high level and aged for 65 weeks. b, Representative NOTCH1 staining in esophageal epithelium of aging YFPCreNotch1+/+ and YFPCreNotch1+/flox mice at the indicated time points. White dashed lines delineate negative areas and solid lines delineate tissue edges. Images representative of three mice per time point. Scale bars: 500 µm c, Percentage of NOTCH1 area increases with age in Notch1+/+ (Kendall’s tau-b correlation = 0.56, P = 0.0062) and Notch1+/− (Kendall’s tau-b correlation = 0.91, P = 8.3 × 10−6) esophagi (Mean ± s.e.m., n = 3 mice per time point). P values shown are from two-sided Welch’s t test. d, Schematic of Notch1+/− cells (purple cells) showing the spontaneous appearance of expanding NOTCH1 cells (black) with aging, possibly caused by genetic events affecting the Notch1 locus. e, Highly induced YFPCreNotch1+/flox mice were aged 54–78 weeks old, when esophageal epithelium was collected and stained for NOTCH1 (magenta), YFP (green) and DNA (blue). Expanding areas devoid or fully stained with YFP appeared distinct from normal-appearing areas marked with a patchwork of small YFP+ clones. Expanded NOTCH1 (yellow) and NOTCH1+ (orange) areas and normal-appearing areas (blue) were isolated for targeted sequencing (n = 246 biopsies from ten mice). Colored circles show the sampled areas. White dashed lines delineate negative areas. Scale bars: 500 µm. f, Proportion of normal appearing, expanded NOTCH1 and expanded NOTCH1+ biopsies with Notch1 mutations or CNLOH. g, Proportion of NOTCH1 and NOTCH1+ areas carrying a secondary missense, nonsense or indel/splicing Notch1 mutation. For f and g, n samples are shown in brackets, redundant samples, defined as biopsies sharing the same mutation and separated by <1 mm were counted once (n = 227 unique biopsies in total). h, Model of colonization by Notch1 clones. Clonal fitness increases from monoallelic and biallelic Notch1 mutation resulting in a selective pressure (blue arrows) for biallelic gene alterations. p.i., postinduction, w.p.i., weeks postinduction. WT, wild type. KO, knock-out allele lacking Notch1 exon 1. Mut, mutation. ND, none detected. See Supplementary Tables 9–11.
Fig. 4
Fig. 4. Notch1 loss does not alter tissue composition or cell dynamics.
a, YFPCreNotch1flox/flox mice were highly induced and aged for 11 weeks, allowing the mutant cells to completely occupy the esophageal epithelium. Controls were uninduced YFPCreNotch1flox/flox mice (+/+). Esophageal epithelium was dissociated and sequenced. b, UMAP plot shows an overlay of 1,500 cells from each library (n = 2 mice per genotype; +/+1, n = 2,454; +/+2, n = 3,194; −/−1, n = 1,929; −/−2, n = 5,534). c, Left, UMAP plot showing cell types identified via scRNA-seq. Right, stacked bar chart shows the proportion of cell types per library. NA, not available. d, UMAP plot shows an overlay of 1,400 cells annotated as keratinocytes from each library (+/+1, n = 1,555; +/+2, n = 1,932; −/−1, n = 1,403; −/−2, n = 3,919). Milo test shows no significant difference in local cell density through UMAP space (Supplementary Note). e, Left, UMAP plot of keratinocytes. Right, stacked bar chart shows the estimated proportion of keratinocytes per library belonging to the basal or suprabasal layers (Supplementary Note). f, Heat map showing Seurat processed expression values in the keratinocyte population for representative marker genes of basal cells, cell cycle, and differentiation for the 11 clusters shown in g (marker list from ref. ). Clusters are grouped in three different cell states: cycling basal, resting basal and differentiating cells. g, UMAP plot of keratinocytes representing cell clusters based on Seurat analysis pipeline via the Leiden algorithm. h, UMAP plot of keratinocytes showing cycling basal (orange), resting basal (green) and differentiating (purple) cell states based on clusters and differentiation markers analysis performed in f and g. i, Stacked bar charts show the proportion of keratinocytes per cell state (upper bar) and per cluster (lower bar) in each library. See Supplementary Table 16.
Fig. 5
Fig. 5. Differentiation and homeostasis in aged Notch1 mutant mouse tissue.
a, YFPCreNotch1flox/flox mice were induced at high dose so mutant cells rapidly covered the esophageal epithelium (−/−). Uninduced YFPCreNotch1flox/flox mice were used as wild-type controls (+/+). Mice were aged as in e and g and tissue was collected. After sectioning, tissue was stained for basal cell marker KRT14, NOTCH1, proliferation marker Ki67, differentiation markers KRT4 and LOR and with H&E. Images are representative of three mice of each genotype. Scale bars, 30 µm. b, Thickness of the epithelium was measured on H&E scanned sections (mean ± s.e.m., each dot represents a mouse, n = 3 mice). Two-tailed unpaired Student’s t test. c, Epithelium basal cell density was measured on whole-mount tissue. (Mean ± s.e.m., each dot represents a mouse, +/+, n = 4097 cells from four mice; −/−, n = 3964 cells from four mice). Two-tailed unpaired Student’s t test. d, Proportion of proliferative basal cells was measured on sections stained for Ki67, KRT14 and DAPI. (Mean ± s.e.m., each dot represents a mouse, +/+, n = 1548 cells from four mice; −/−, n = 1129 cells from three mice). Two-tailed unpaired Student’s t test. e,f, Highly induced or uninduced control YFPCreNotch1flox/flox mice were aged for 52 weeks and injected with EdU 1 h before collection (e). Ratio of EdU+ basal cells on total number of basal cells was calculated (f) (mean ± s.e.m., each dot represents a mouse, +/+, n = 2754 cells from three mice; −/−, n = 2565 cells from three mice). Two-tailed, unpaired Student’s t test. g,h, Highly induced or uninduced control YFPCreNotch1flox/flox mice were aged for 52 weeks and injected with EdU 48 h before collection (g). Ratio of EdU+ suprabasal cells. (Mean ± s.e.m., each dot represents a mouse; +/+, n = 2687 EdU+ cells from three mice; −/−, n = 2201 EdU+ cells from three mice). Two-tailed unpaired Student’s t test. See Supplementary Table 18.
Fig. 6
Fig. 6. Tumors retain functional Notch1 in carcinogenesis.
a, Uninduced YFPCreNotch1flox/flox mice were treated with DEN and SOR. Tissue was collected 28 weeks after treatment. Tumors were dissected from underlying submucosa and normal epithelium was cut into a gridded array of 2 mm2 samples before targeted sequencing. Scale bar, 1 mm. b, Number of Notch1 mutations per amino acid is plotted by NOTCH1 protein domains in normal gridded biopsies (upper) and tumors (lower) from Notch1 wild type mice (normal, n = 115 biopsies from six mice; tumors, n = 17 biopsies from seven mice). Domains: EGF-like repeats, LNR, HD, TM, transmembrane, RAM, RBP-J-associated module, ANK, ankyrin repeats, TAD, trans-activation domain, PEST, rich in proline, glutamate, serine and threonine. c, dN/dS ratio for Notch1 mutations (top plot) and proportion of Notch1 mutant tissue in normal epithelium (purple bars) (n = 115 biopsies from six mice) and tumors (n = 17 biopsies from seven mice). Two-tailed P value, likelihood ratio test of dN/dS ratios. d, Representative NOTCH1 (magenta) and KRT14 staining (green) in tumors and surrounding tissue, DNA is blue. Image typical of 10 tumors from six animals. White dashed lines delineate tumor from adjacent normal tissue. Scale bars, 250 µm. e, Proportion of NOTCH1+ staining area in normal epithelium and tumors from the same control animals (each dot represents a mouse, n = 40 tumors from four mice). Two-tailed paired Student’s t test. f, Representative images showing nuclear NICD1 (magenta) in keratinocytes (KRT14, green) inside a tumor in comparison to the normal adjacent tissue. DNA is blue. Image typical of 10 tumors from six animals. Scale bars, 25 µm. g, Proportion of KRT14+ keratinocytes with nuclear NICD1 staining in tumors and surrounding epithelium in the same sections (each dot represents a tumor, n = 10 tumors from six mice). Two-tailed paired Student’s t test. See Supplementary Tables 19–23.
Fig. 7
Fig. 7. Tumor growth is reduced by Notch1 inactivation.
a, Highly induced YFPCreNotch1+/flox (+/−) and YFPCreNotch1flox/flox (−/−) mice or uninduced control (+/+) mice were treated with DEN and SOR and aged for 28 weeks. For bd, Notch1+/+, n = 11; Notch1+/− n = 10; Notch1−/−, n = 12. b, Representative images of esophagi for each genotype. Scale bar, 1 mm. c, Tumor density per genotype. Mean ± s.e.m., each dot represents a mouse. One-way ANOVA; adjusted P values from Tukey’s multiple comparisons test. d, Tumor areas per genotype. Mean± s.e.m., each dot represents a tumor. Kruskal–Wallis test; adjusted P values from Dunn’s multiple comparisons test. e,f, Tumors from Notch1+/+ (e) and Notch1−/− (f) epithelium were sectioned and stained for H&E (left panel), for keratinocyte progenitor marker Keratin 14 (KRT14, green), and NOTCH1 (magenta) (middle panel) or keratinocyte differentiation marker Loricrin (LOR, magenta) and progenitor markers ITGA6 (gray) and KRT14 (green) (right panel). DNA is blue. Images representative of n = 19 tumors from Notch1+/+ and n = 13 tumors from Notch1−/− epithelium. Scale bars, 250 µm. g, Uninduced YFPCreNotch1flox/flox mice (+/+) were treated with DEN/SOR and aged for 9 weeks. Mice were treated with anti-NOTCH1 NRR1.1E3 or with CTRL for 6 weeks before collection. h, Representative tumors marked by KRT6a staining (red) are shown with white arrowheads in esophageal epithelium from control and anti-NRR1.1E3 treated mice. Scale bars: 100 µm. i, Quantification of tumor area (mean ± s.e.m., each dot represents a tumor, n = 4 mice per group). P values from two-tailed Mann–Whitney test. Data are shown in Supplementary Table 24.
Fig. 8
Fig. 8. Cell division is decreased in tumors from Notch1−/− esophagus.
a, Notch1+/+ and Notch1−/− normal esophageal tissue and tumors (Fig. 7a) were RNA sequenced. Notch1+/+: n = 11 epithelial samples from seven mice, n = 8 Notch1+/+ tumors from four mice; Notch1−/− n = 10 epithelial samples from seven mice, n = 6 Notch1−/− tumors from five mice. b, MA plots showing differentially expressed genes (red, q < 0.05, DESeq2 analysis, two-sided Wald test with Benjamini–Hochberg correction), red, in Notch1+/+ and Notch1−/− tumors versus normal epithelium. Zero-fold change shown by red dotted line. c, −log10 (P value) of top Gene ontology biological processes (GOBP) in tumors versus normal epithelium in Notch1+/+, gray, Notch1−/−, red genotypes (Supplementary Tables 27 and 28). d, MA plots showing differentially expressed genes (red, q < 0.05, DESeq2 analysis, two-sided Wald test with Benjamini−Hochberg correction), in tumors from Notch1−/− versus Notch1+/+ esophagus. Red dotted line, zero-fold change. e, GSEA of tumors from Notch1−/− versus Notch1+/+- esophagus, DNA replication gene set shown (normalized enrichment score, NES = −2.48, false discovery rate, FDR q-value = 0.0, Supplementary Table 29). f, Transcript per million values of cell cycle and DNA replication transcripts selected from GSEA in tumors from Notch1+/+and Notch1−/− esophagus. Mean ± s.e.m., n = 8 tumors from Notch1+/+ esophagus and n = 6 from Notch1−/− esophagus. Two-tailed unpaired Student’s t-test. g, Representative images of n = 8 tumors from Notch1+/+ and n = 9 tumors from Notch1−/− esophagus. KRT14 (green), pHH3 (gray). DNA, blue. Scale bars, 30 µm. h, Percentage of pHH3+, KRT14+ keratinocytes within tumors from Notch1+/+ and Notch1−/− esophagus. Mean ± s.e.m., each dot represents a tumor, +/+: n = 8 tumors from 4 mice; −/−: n = 9 tumors from 7 mice. Two-tailed unpaired Student’s t-test. i, Representative images from n = 8 tumors each from Notch1+/+ and Notch1−/− esophagi, KRT14 (green), phospho-ERK1/ERK2 (p-ERK, magenta), DNA (blue). Insets, magnified areas indicated by white squares. Scale bars, 30 µm. j, Normalized mean intensity of fluorescence for p-ERK (left) and total ERK (t-ERK, right) in KRT14+ cells in tumors from Notch1+/+ and Notch1−/− esophagi relative to adjacent normal tissue. Mean ± s.e.m., each dot represents a tumor. +/+: n = 8 tumors from four mice; −/−: n = 8 tumors from seven mice. Two-tailed unpaired Student’s t test. k, In tumors lacking Notch1, signals downstream of mutant Atp2a2 are disrupted, cell division reduced, and tumor growth slows. A.U., arbitrary unit. See Supplementary Tables 24 and 27–30.
Extended Data Fig. 1
Extended Data Fig. 1. Aging human esophageal epithelium is colonized by NOTCH1 mutant clones.
a. NOTCH1 is composed of an extracellular domain (NEC) and a transmembrane and cytoplasmic unit (NTM). Domains of NOTCH1 are indicated, arrows show epitopes recognized by anti-NOTCH1 (blue) and anti-NICD1 (orange) antibodies. Ligand binding results in proteolytic cleavages, after which the intracellular domain (NICD) migrates to the nucleus and activates transcription. Domains: EGF, epidermal growth factor like repeats, LNR, Lin12/Notch repeats, HD, heterodimerization, TM, transmembrane, RAM, RBP-J associated module, ANK, ankyrin repeats, TAD, trans-activation domain, PEST, rich in proline, glutamate, serine, and threonine, NRR, negative regulatory region. b. Human esophageal epithelium. Proliferation is confined to the lower layers. Differentiating cells migrate to tissue surface. Pa, papillae. Protein expression shown on right. c. Representative section stained for NOTCH1 (red) and DNA (blue) showing subset of results in Fig. 1b for donor PD31008. Left: sample identification (Id), NOTCH1 staining status (+ or −). Right: non-synonymous NOTCH1 mutations, variant allele frequency (VAF) and copy neutral loss of heterozygosity (CNLOH) if detected, with B allele frequency (BAF) value. Mutation effects: Indel_Splicing, gray; Missense, blue; Nonsense, red. Dashed lines delineate epithelium and submucosa (white) and borders of sequenced samples (yellow). Scale bar, 250 µm. d. Copy number calls for samples PD31008bc and bd, shown in c, Fig. 1d–f and Supplementary table 4. Left plot, analysis of total copy number along chromosome 9 for samples bc and bd. Middle, right plots, BAF along chromosome 9 and NOTCH1 locus, respectively. Red lines denote significant difference from control, black lines indicate no significant difference. e. Successive sections of esophagus from older donors stained for NICD1, Ki67 and Hematoxylin and eosin (H&E). Images representative of 4 donors. Scale bars, 100 µm. f, g, h. Tissue thickness (f), cell density (g) and proportion of proliferative cells (h) in NICD1 positive and negative areas. Each dot represents a donor. For f, NICD1+, n = 14 areas from 4 donors, NICD1−, n = 15 areas from 4 donors. For g, NICD1+: 10795 cells from 4 donors, NICD1−: 11593 cells form 4 donors. For h, NICD1+: 5402 cells from 4 donors, NICD1−: 6204 cells from 4 donors. Two-tailed paired t-test. See Supplementary Tables 1–5.
Extended Data Fig. 2
Extended Data Fig. 2. Lineage tracing of Notch1 mutant cells in mouse esophageal epithelium.
a. Structure and cellular homeostasis in mouse esophageal epithelium. The basal layer contains progenitor cells that divide to generate progenitor and differentiating daughter cells. Differentiating basal layer cells exit the cell cycle and migrate into the suprabasal layers, moving towards the surface of the epithelium from which they are shed. The division of a progenitor cell (green) produces two progenitors, two differentiating cells or one cell of each type. In homeostatic tissue, the likelihood of each division outcome is balanced and gives on average 50% of progenitors and 50% of differentiating cells across the progenitor population. b. YFPCreNotch1 conditional knock-out mouse strain. LoxP sites (gray arrows) flank exon1 of the Notch1 gene. Notch1flox animals were crossed with Rosa26floxedYFP mice carrying a conditional yellow fluorescent protein (YFP) reporter targeted to the Rosa26 locus and with AhCreERT mice carrying an inducible Cre recombinase. c. For lineage tracing, triple mutant mice were treated with inducing drugs at a dose that resulted in recombination of Notch1 (blue), expression of YFP (green) or both (orange) in scattered individual esophageal basal cells (clonal induction). The recombined cells may expand into clones detected by the reduced intensity (+/−) or absence of NOTCH1 (−/−) and expression of YFP detected by immunostaining. Samples were collected at different time points after induction and the number and location of cells in each clone determined by 3D confocal imaging of sheets of epithelium. d. Triple mutant mice were induced with a high dose of drugs, allowing recombination of cells at high density in the tissue. In the case of mutant clones with a competitive advantage over wild type cells, this protocol allowed the coverage of the tissue by mutant clones relatively shortly after induction.
Extended Data Fig. 3
Extended Data Fig. 3. Monoallelic and biallelic recombination at Notch1 locus results in reduction of Notch1 mRNA and protein.
a. Protocol for b, f-h. Highly induced YFPCreNotch1flox/flox or +/flox mice aged to allow Notch1 mutant cells to colonize epithelium. Controls, non-induced mice (+/+). b. Esophageal sections 10 days post induction (p.i.) stained for NOTCH1 (magenta), Wheat germ agglutinin (WGA) (gray) and DNA (blue). Scale bars, 30 µm. c. Quantitative PCR assay for Notch1 recombination. Primer set B measures floxed exon1, C amplifies recombined locus, A allows normalization. d, e. Validation using set B (d) and set C (e) against standard curve (Mean ± SEM, n = 3 technical replicates). f-h. YFPCreNotch1flox/flox or +/flox mice and controls aged for 8 weeks, mean ± SEM, each dot represents a mouse, n = 4 mice. f. Exon1/Exon3 ratio assay using set B. One-way ANOVA; adjusted p values from Tukey’s multiple comparisons test against wild type. g. Notch1:Gapdh mRNA by RT-qPCR. One-way ANOVA; adjusted p values from Tukey’s multiple comparisons test against wild type. h. Immune Capillary Electrophoresis of NOTCH1 transmembrane/intracellular domain (NTM1 + NICD1) and α-Tubulin protein. Dashed lines indicate image cropping and arrangement. One-way ANOVA; adjusted p values from Tukey’s multiple comparisons test against wild type. i. Protocol. YFPCreNotch1flox/flox or +/flox or +/+ mice were clonally induced, whole mounts stained for NOTCH1, YFP and DAPI. Clones were identified by NOTCH1 staining (Extended data Fig. 2a, Supplementary Note). j. Epithelium stained for NOTCH1 (magenta), YFP (green) and DNA (blue) 13 weeks p.i. of YFPCreNotch1flox/flox or +/flox or +/+ mice. Scale bars, 500 µm. k-n. Validation of clonal genotype. k. Protocol. Tissues were stained for NOTCH1, YFP and DNA at 4 weeks p.i. for YFPCreNotch1flox/flox and 13 weeks p.i for YFPCreNotch1+/flox. Potential clones were micro-dissected (yellow dotted lines) and qPCR performed using set C. l, m. Representative examples of 4 weeks post-induction (w.p.i.) Notch1−/− clones and control areas (upper panels) and 13 w.p.i. Notch1+/− clones and control areas (lower panels) validated as in k. NOTCH1, magenta, YFP, green, DNA, blue. l. Projected view. Dotted lines: orange, dissected clones, blue, control areas. Scale bars, 125 µm. m. (x, y) basal view. White dotted lines: clone edges. Scale bars, 30 µm. n. qPCR assay using primer set C (c, e). Mean± SEM, each dot represents a sample, n = 22 controls and n = 21+/− clones from 3 YFPCreNotch1+/flox mice; n = 21 controls and n = 22 −/− clones from 3 YFPCreNotch1flox/flox mice. Two-tailed unpaired Student t-test. AU, arbitrary units. SEM, standard error of mean. See Supplementary Table 6. Source data.
Extended Data Fig. 4
Extended Data Fig. 4. Modeling Notch1 mutant clone expansion.
a. 2-dimensional Wright-Fisher style model of clone dynamics. The basal layer consists of a hexagonal grid of cells. At time zero, a small proportion of cells is mutant (red) and the rest wild type (gray). Cells in the next generation are picked from neighboring cells – for example the cells which can be placed in the outlined position in generation 2 are those marked with an X in generation 1. Mutant cells with higher fitness have a higher probability of generating daughters in the next generation and expand into large clones (Supplementary Note). b. Inferred induction proportion and inferred fitness values from ABC fitting to the lineage tracing data (Supplementary Note) for Notch1−/− (red), Notch1+/− (purple) and Notch1+/+ (black) clones in the respective animals. Each dot shows an ‘accepted’ parameter set. A fitness of 1 (dotted line) is neutral. c. Distributions of acceptable values of the fitness parameter. Whiskers show the upper and lower bounds of the 95% credible interval, boxes show quartiles, center lines indicate medians of credible intervals. A fitness of 1 (blue dotted line) is neutral. d. Mean clone sizes from simulations of the parameters at the peak of acceptable distributions (see Supplementary note). Median and 95% confidence intervals of 100 simulations shown for the simulation curves. Mean ± standard error of mean are shown for the experimental data. e. Proportion of tissue covered by Notch1−/− clones over time in simulations using the best-fit for Notch1−/− fitness. Notch1+/− is either assumed to be neutral (haplosufficient, green) or to have the best fitting fitness parameter to the experimental analysis of Notch1+/− clones (haploinsufficient, orange). Curves show median and shaded areas show 95% confidence intervals of 100 simulations. f. Representative snapshot images at 100 days, 300 days and 3000 days from the simulations shown in e. On the left, Notch1+/− cells are haploinsufficient (fitting to experimental data), on the right the Notch1+/− cells are assumed to be haplosufficient (neutral fitness). Cells from each genotype are color coded. All images show the same number of cells/area of simulated tissue. See Supplementary Note.
Extended Data Fig. 5
Extended Data Fig. 5. Analysis of spontaneous mutant clones in Notch1+/− aged esophageal epithelium.
a. Protocol. YFPCreNotch1 +/flox mice were induced at high density and aged. b. Representative sections stained for NICD1 (magenta), KRT14 (green), and DNA (blue) from Notch1+/− mice 13 weeks (n = 3) and 65 weeks (n = 5) after induction. Scale bars, 25 µm. c, d. Copy neutral loss of heterozygosity (CNLOH) analysis from Fig. 3e sequencing showing a representative non-clonal area (c, sample MD6364e) and a NOTCH1 negative clone (d, sample MD6364j). Coverage of off-target reads (left), and B allele fraction (BAF, middle and right) along chromosome 2 (middle) and at Notch1 locus (right). Red lines indicate significant, black lines, no significant difference. e. Left: EDTA treatment activates NOTCH1 cleavage without ligand. Right: representative NOTCH1 positive areas of aged Notch1+/− esophagi stained for NOTCH1 (red), YFP and DNA (blue). Images show non-EDTA control and EDTA treated sequenced tissue as in Fig. 3e–g (control area, nuclear or non-nuclear clones). Scale bars, 25 µm. f. Notch1 mutations in clones with or without NOTCH1 nuclear staining, n mutations in brackets. Mutation effects are color coded. g. Location of missense Notch1 mutations in nuclear and non-nuclear staining clones, n samples in brackets. P = 0.001, Chi-square test. h. Distribution of Notch1 missense mutations in nuclear (purple, n = 42) and non-nuclear staining (orange, n = 20) clones. EGF, Epidermal Growth Factor like repeats, LNR, Lin12/Notch repeats and ANK, ankyrin repeats shown. Purple shadow: EGF repeat 8-12 mutations, Orange shadow: LNR repeat mutations. i. Missense mutations (n = 21) in NOTCH1 EGF8-12 in nuclear staining samples. Mutations highlighted on structure of rat NOTCH1 EGF8-12 bound to JAGGED-1 (PDB 5UK5, https://www.rcsb.org/). Mutated residues: dark red, calcium binding; yellow, residues on interface with JAGGED-1; purple, highly destabilizing mutations (FoldX ∆∆G > 2 kcal/mol). R365C, is blue, calcium ions in green. j. Mutations shown on human negative regulatory region (NRR) (PDB 3ETO, https://www.rcsb.org/). Orange, n = 9 missense mutations from non-nuclear staining clones. Blue, missense mutations from human T-cell acute lymphoblastic leukemia (https://cancer.sanger.ac.uk/cosmic ref. ). Proportion of missense mutations between LNR1-2 and LNR3-HD in T-ALL and non-nuclear staining clones is significantly different (Two-sided Fisher exact tests, p = 1.48e−10 n = 153 mutations). LNR1, blue; LNR2, pink; LNR3, green; HD domains, yellow. See Supplementary Tables 10 and 11.
Extended Data Fig. 6
Extended Data Fig. 6. Notch1 loss alters transcription.
a. RNA-seq (n = 4 mice per group) was performed on epithelium from highly induced YFPCreNotch1flox/flox and YFPCreNotch1+/flox mice, aged for 8 weeks to allow mutant colonization. Uninduced mice were used as controls (+/+). b. Principal component analysis (PCA) plot showing Notch1+/+, Notch1+/− and Notch1−/− samples in two dimensions. Dotted lines indicate the origin of the axes. Sample genotypes are color-coded. c. Hierarchical clustering and heat map showing differentially expressed genes between Notch1−/− and control tissues, in all three genotypes. d. Heat maps showing Log2 fold changes of 25 top differentially expressed genes in Notch1−/− compared to Notch1+/+ tissues, adjusted p-value < 0.05. e. Gene Set Enrichment Analysis of Notch1−/− tissue vs Notch1+/+ tissue. Bar chart shows normalized enrichment scores (NES) for the four most significantly downregulated gene sets in Notch1−/− tissue vs Notch1+/+ tissue and the most significantly upregulated gene set. False discovery rate (FDR) q-value <0.05. See Supplementary Tables 12–15.
Extended Data Fig. 7
Extended Data Fig. 7. Notch1 loss does not alter tissue composition or cell dynamics.
a. qPCR recombination assay of Notch1 exon1 in epithelium from YFPCreNotch1flox/flox mice induced as for single cell RNA-seq (scRNA-seq)and collected 4 weeks later, compared with wild type tissue. Mean ± SEM, each dot represents a mouse, n = 3 mice. Two-tailed unpaired Student’s t-test. b-d. scRNA-seq as in Fig.4a (n = 2 mice per genotype; +/+1, n = 2454; +/+2, n = 3194; −/−1, n = 1929; −/−2, n = 5534). Uniform Manifold Approximation and Projection (UMAP) plots show markers of fibroblasts (Zeb1, b), endothelial cells (Pecam1/ CD31, c) and immune cells (Ptprc /CD45, d). See Supplementary Note. e-g. Sections from Notch1+/+ and Notch1−/− esophagi show KRT14 basal keratinocyte marker, green, DNA, blue and fibroblasts (ZEB1, e), endothelial cells (CD31, f) and immune cells (CD45, g), magenta. Images representative of 3 mice per genotype. Scale bars, 25 µm. h-k. UMAP plots show markers of keratinocyte differentiation highlighting basal cells (Krt14, h), differentiating cells (Tgm3, i, Krt4,j) and cornified cells (Lor, k). Dashed black line separates basal cells and suprabasal cells (Supplementary Note). (+/+1, n = 1555; +/+2, n = 1932; −/−1, n = 1403; −/−2, n = 3919). l. YFPCreNotch1flox/flox mice were highly induced or not induced (+/+ controls) and aged for 8 weeks, then EdU was injected 48 h and BrdU 1 h before collection. EdU+ cells are shown in red; BrdU+ cells are green; EdU+; BrdU+ cells are yellow. m. Notch1−/− and Notch1+/+ epithelia stained for EdU (red), BrdU (S phase, green), pHH3 (G2/M, gray) and DNA (blue). Scale bars, 25 µm. n, o. Ratio of EdU + ; BrdU+ basal cells (S phase, n) or EdU+; BrdU-; pHH3 + (G2/M, o)/total EdU+ basal cells in Notch1+/+ and Notch1−/− epithelia (n = 3856 Notch1+/+ EdU+ basal cells from 4 mice, n = 2328 Notch1−/− basal cells from 3 mice). p. EdU+ suprabasal: total EdU+ cells ratio (n = 6696 EdU+ Notch1+/+ cells from 4 mice; n = 4203 EdU+ Notch1−/− cells from 3 mice). q, r. BrdU+ basal cells (S phase, q) or BrdU−; pHH3+ basal cells (G2/M, r) /total basal cells in Notch1+/+ and Notch1−/− epithelia (n = 22669 Notch1+/+ basal cells from 4 mice, n = 16111 Notch1−/− basal cells from 3 mice). For n-o, Mean ± SEM, each dot represents a mouse, two-tailed unpaired Student’s t-tests. AU, arbitrary unit. SEM, standard error of mean. See Supplementary Tables 16 and 17.
Extended Data Fig. 8
Extended Data Fig. 8. Characterization of mouse esophageal tumors.
a–c. Mouse esophageal epithelium and tumors from Notch1+/+ esophagus and tumors from Notch1−/− esophagus (from protocol in Fig.7a) were processed for targeted sequencing. a. Proportion of tissue mutant for Notch1 and Atp2a2 in tumors from Notch1+/+ esophagus and in adjacent epithelium, estimated from sum of variant allele frequencies (VAFs) of non-synonymous mutations for Notch1 and Atp2a2 (n = 115 normal epithelial biopsies from 6 mice, n = 17 tumors from 7 mice; Supplementary Note). b. Summed VAF of protein altering mutations in the indicated genes is shown for random Notch1 +/+ epithelial samples (upper, n = 17/115), all 17 sequenced tumors from Notch1+/+ (lower left) and all 7 tumors from Notch1−/− esophagus (lower right). c. Proportion of tissue mutant for Notch1 and Atp2a2 estimated from sum of VAFs of non-synonymous mutations for each gene in tumors from Notch1−/− esophagus. (n = 7 tumors from 5 mice; Supplementary table 26; Supplementary Note). d-h, Protocol. Tumors from Notch1+/+ and Notch1−/− esophageal epithelia (Fig. 7a) were sectioned and characterized by immunostaining. d. Tumors were stained, from left to right, for Hematoxylin and eosin (H&E), differentiation markers (KRT14 and LOR), endothelial marker CD31 and DNA, gray. e. Tumors were stained, from left to right, for active NOTCH1 (NICD1), immune cell marker CD45, apoptosis marker cleaved Caspase 3 in magenta, KRT14, green and DNA, blue. For d, e, images representative of n = 10 wild type tumors, n = 11 Notch1−/− tumors for all immunostainings, n = 4 for cleaved Caspase 3. Scale bars in d, 500 µm, in e, 30 µm. f. Tumors were stained for E-cadherin (CDH1, gray) and DNA (blue). Right panels, magnified views of white squares. Arrows indicate keratinocytes with reduced CDH1 staining. Images are representative of n = 8 tumors from 6 mice of each genotype. Scale bars, 100 µm (left panel) and 30 µm (right). g,h. Mean CDH1 intensity relative to DNA in tumor compared to adjacent epithelium in Notch1+/+ (g) and Notch1−/− (h) (n = 8 tumors from 6 mice for each genotype). Two tailed paired Student’s t-test. AU, arbitrary unit. See Supplementary Tables 19, 20, 24 and 26.
Extended Data Fig. 9
Extended Data Fig. 9. Use of anti-NOTCH1 antibody to inhibit NOTCH1 signaling in vivo.
a. Protocol for b-e. C57Bl/6 wild type mice were treated with anti-NRR1.1E3 or control antibody (CTRL) for three days before tissue collection. b, c. Immune Capillary Electrophoresis was performed on peeled esophageal epithelia of mice in a. Visual representation of cleaved transmembrane and intracellular regions of NOTCH1 (NTM1 + NICD1, top panel, Extended data Fig. 1a) and of NOTCH2 (NTM2 + NICD2, bottom panel), and α-Tubulin proteins. Dashed lines indicate image cropping (b). Proteins expression relative α-Tubulin. Mean ± SEM, each dot represents a mouse, n = 3 mice. Two-tailed unpaired Student’s t-test (c). d. Representative images of staining for NICD1 (magenta), KRT14 (green) and nuclei (blue) in sectioned epithelium of 3 mice treated with control or anti-NRR1.1E3 antibodies. Scale bars, 25 µm. e. RT-qPCR for markers of Notch1 loss of function identified by bulk RNA-seq analysis (Extended data Fig. 6d, Supplementary Table 12) relative to Gapdh transcript in control and anti-NRR1.1E3 treated samples. Mean ± SEM, each dot represents a mouse, n = 3. Two-tailed unpaired Student’s t-test. f. Protocol. YFPCreNotch1flox/flox mice were induced at clonal density. One week later, mice were treated with anti-NRR1.1E3 or control antibodies for 3 weeks. g. Principle of assay shown in f, If anti-NRR1.1E3 treatment blocks NOTCH1 signaling, all cells have equal fitness and expansion of Notch1−/− clones is halted. h. Representative images of NOTCH1 negative clones in EDTA peeled esophageal epithelia treated with control or anti-NRR1.1E3 antibody from 3 mice. Scale bars, 50 µm. i. Projected area of clones negative for NOTCH1 staining. Mean ± SEM, each dot represents a clone. Number of mice analyzed is in brackets. One-way ANOVA; Tukey’s multiple comparisons test, adjusted p-values versus control antibody. AU, arbitrary unit. SEM, standard error of mean. LO, loading. See, Supplementary table 25. Source data.
Extended Data Fig. 10
Extended Data Fig. 10. Transcriptomic characterization and cellular phenotype of tumors from Notch1+/+ and Notch1−/− esophagus.
a-d. RNA-seq analysis of Notch1+/+ and Notch1−/− esophageal tissue and tumors, see Fig. 8a. a. Principal component analysis (PCA) plot showing in two dimensions all biological replicates from Notch1+/+ normal epithelium (n = 11 biopsies from 7 mice, green), tumors from Notch1+/+ epithelium (n = 8 tumors from 4 mice, red), Notch1−/− normal epithelium (n = 10 biopsies from 7 mice, blue) and tumors from Notch1−/− epithelium (n = 6 tumors from 5 mice, orange). Dotted lines indicate the origin of the axes. b. Hierarchical clustering and heat map showing differentially expressed genes between tumors and adjacent normal tissue, in Notch1+/+ mice (left) and Notch1−/− mice (right). c. Hierarchical clustering and heat map showing differentially expressed genes between tumors from Notch1+/+ and Notch1−/− esophagus. d. Gene Set Enrichment Analysis (GSEA) of tumors from Notch1−/− vs Notch1+/+esophagus. Normalized enrichment score (NES) of altered Biological Process gene sets in tumors. False discovery rate, FDR q-value<0.05. e. Representative images of n = 8 tumors from Notch1+/+ and n = 9 tumors from Notch1−/− esophagus. KRT14 (green), CCNB1 (magenta). DNA, blue. Scale bars, 30 µm. f. Percentage of CCNB1 positive; KRT14 expressing keratinocytes within tumors from Notch1+/+ and Notch1−/− esophagus. Mean ± SEM, each dot represents a tumor, +/+: n = 8 tumors from 4 mice; −/−: n = 9 tumors from 7 mice. Two-tailed unpaired Student’s t-test. See Supplementary Tables 24 and 27–29.

References

    1. Blokzijl F, et al. Tissue-specific mutation accumulation in human adult stem cells during life. Nature. 2016;538:260–264. doi: 10.1038/nature19768. - DOI - PMC - PubMed
    1. Martincorena I, et al. Somatic mutant clones colonize the human esophagus with age. Science. 2018;362:911–917. doi: 10.1126/science.aau3879. - DOI - PMC - PubMed
    1. Martincorena I, et al. Tumor evolution. High burden and pervasive positive selection of somatic mutations in normal human skin. Science. 2015;348:880–886. doi: 10.1126/science.aaa6806. - DOI - PMC - PubMed
    1. Yokoyama A, et al. Age-related remodelling of oesophageal epithelia by mutated cancer drivers. Nature. 2019;565:312–317. doi: 10.1038/s41586-018-0811-x. - DOI - PubMed
    1. The Cancer Genome Atlas Research Network Integrated genomic characterization of oesophageal carcinoma. Nature. 2017;541:169–175. doi: 10.1038/nature20805. - DOI - PMC - PubMed

Publication types