. 2022 Oct 5;42(40):7634-7647.
doi: 10.1523/JNEUROSCI.2473-21.2022. Epub 2022 Sep 2.

The Existence of the StartReact Effect Implies Reticulospinal, Not Corticospinal, Inputs Dominate Drive to Motoneurons during Voluntary Movement

Affiliations

The Existence of the StartReact Effect Implies Reticulospinal, Not Corticospinal, Inputs Dominate Drive to Motoneurons during Voluntary Movement

Jesus A Tapia et al. J Neurosci. .

Abstract

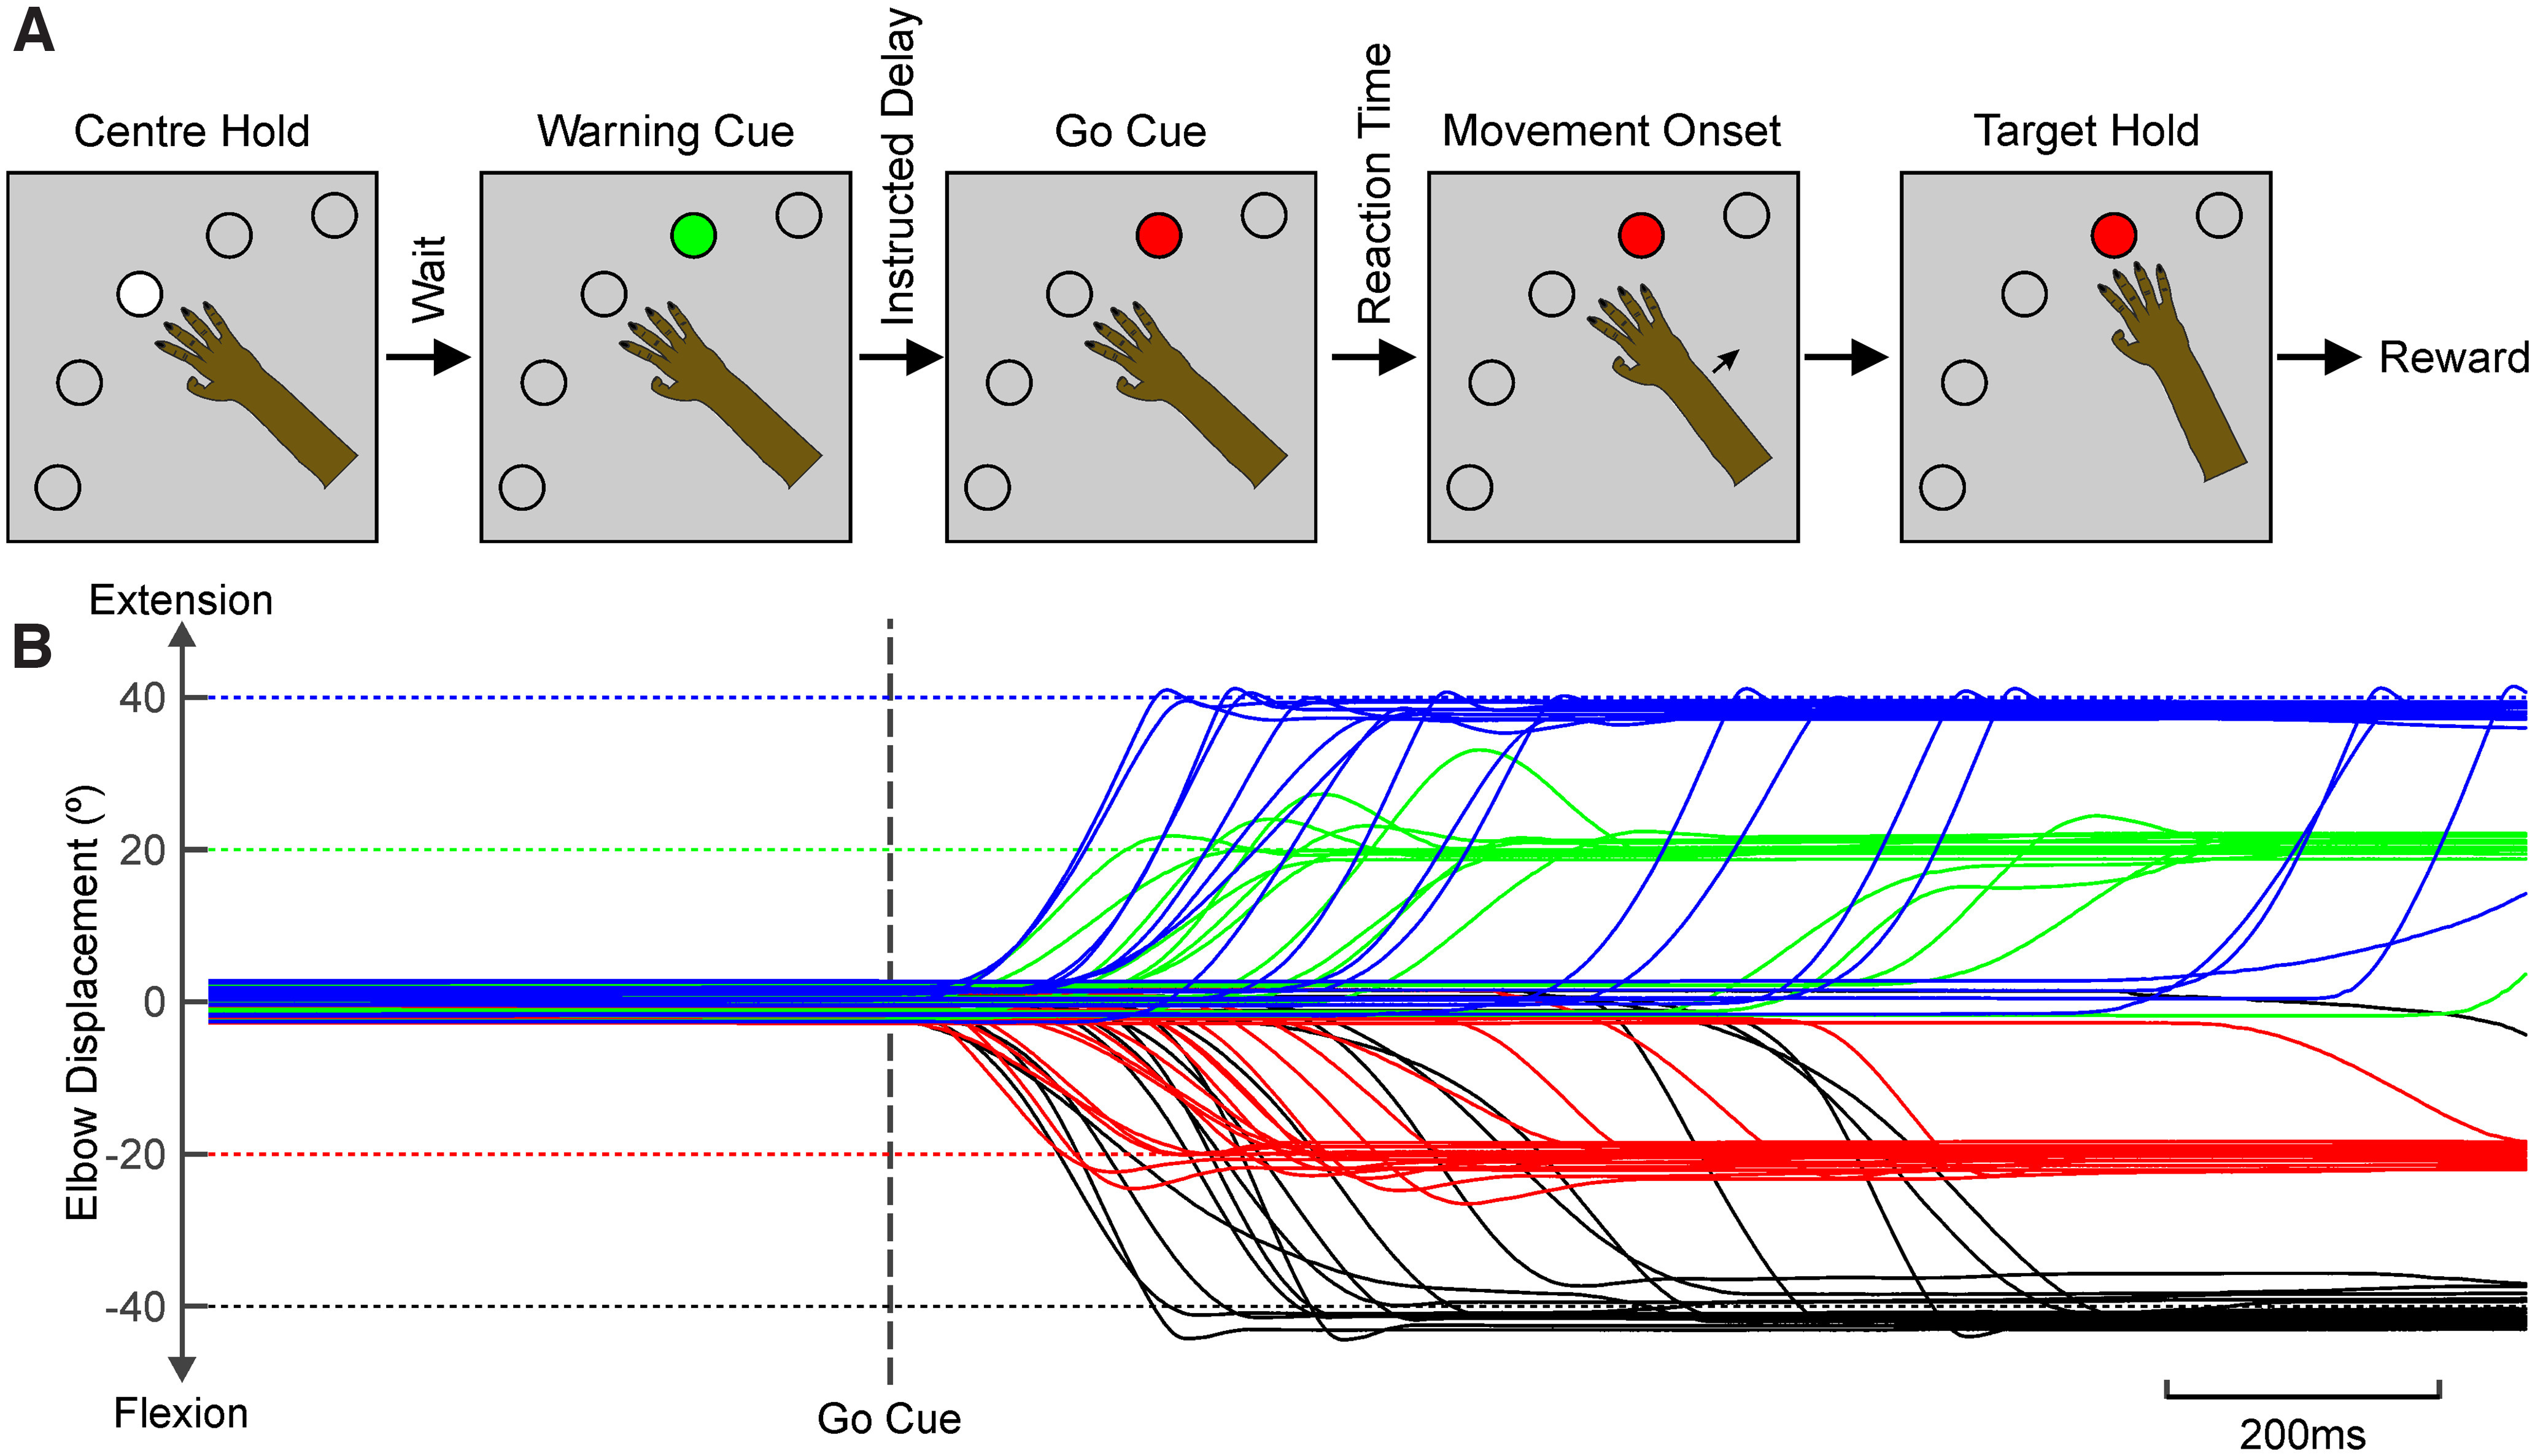
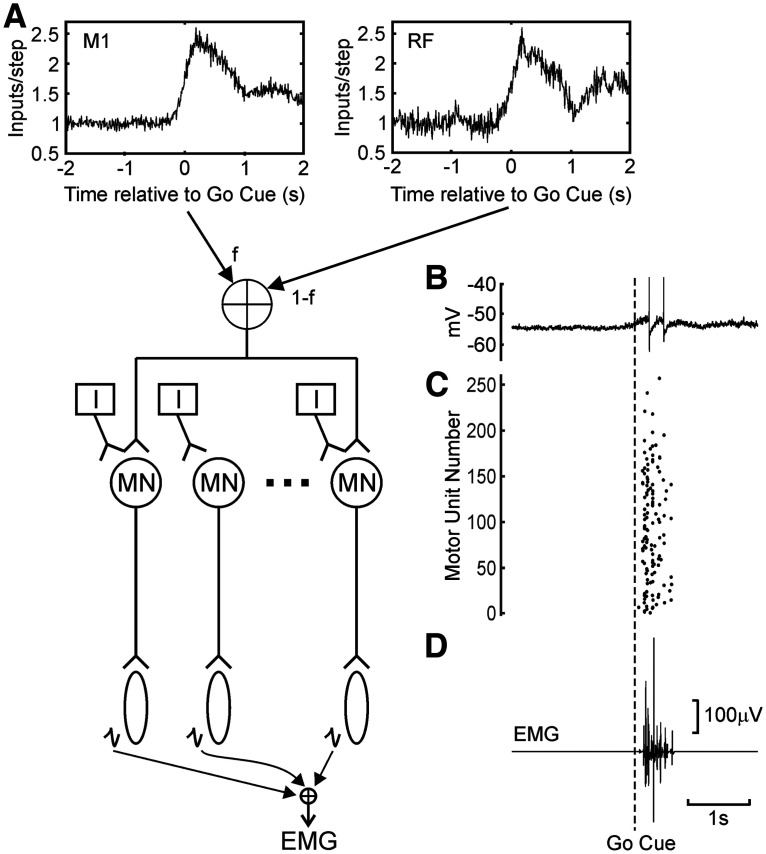
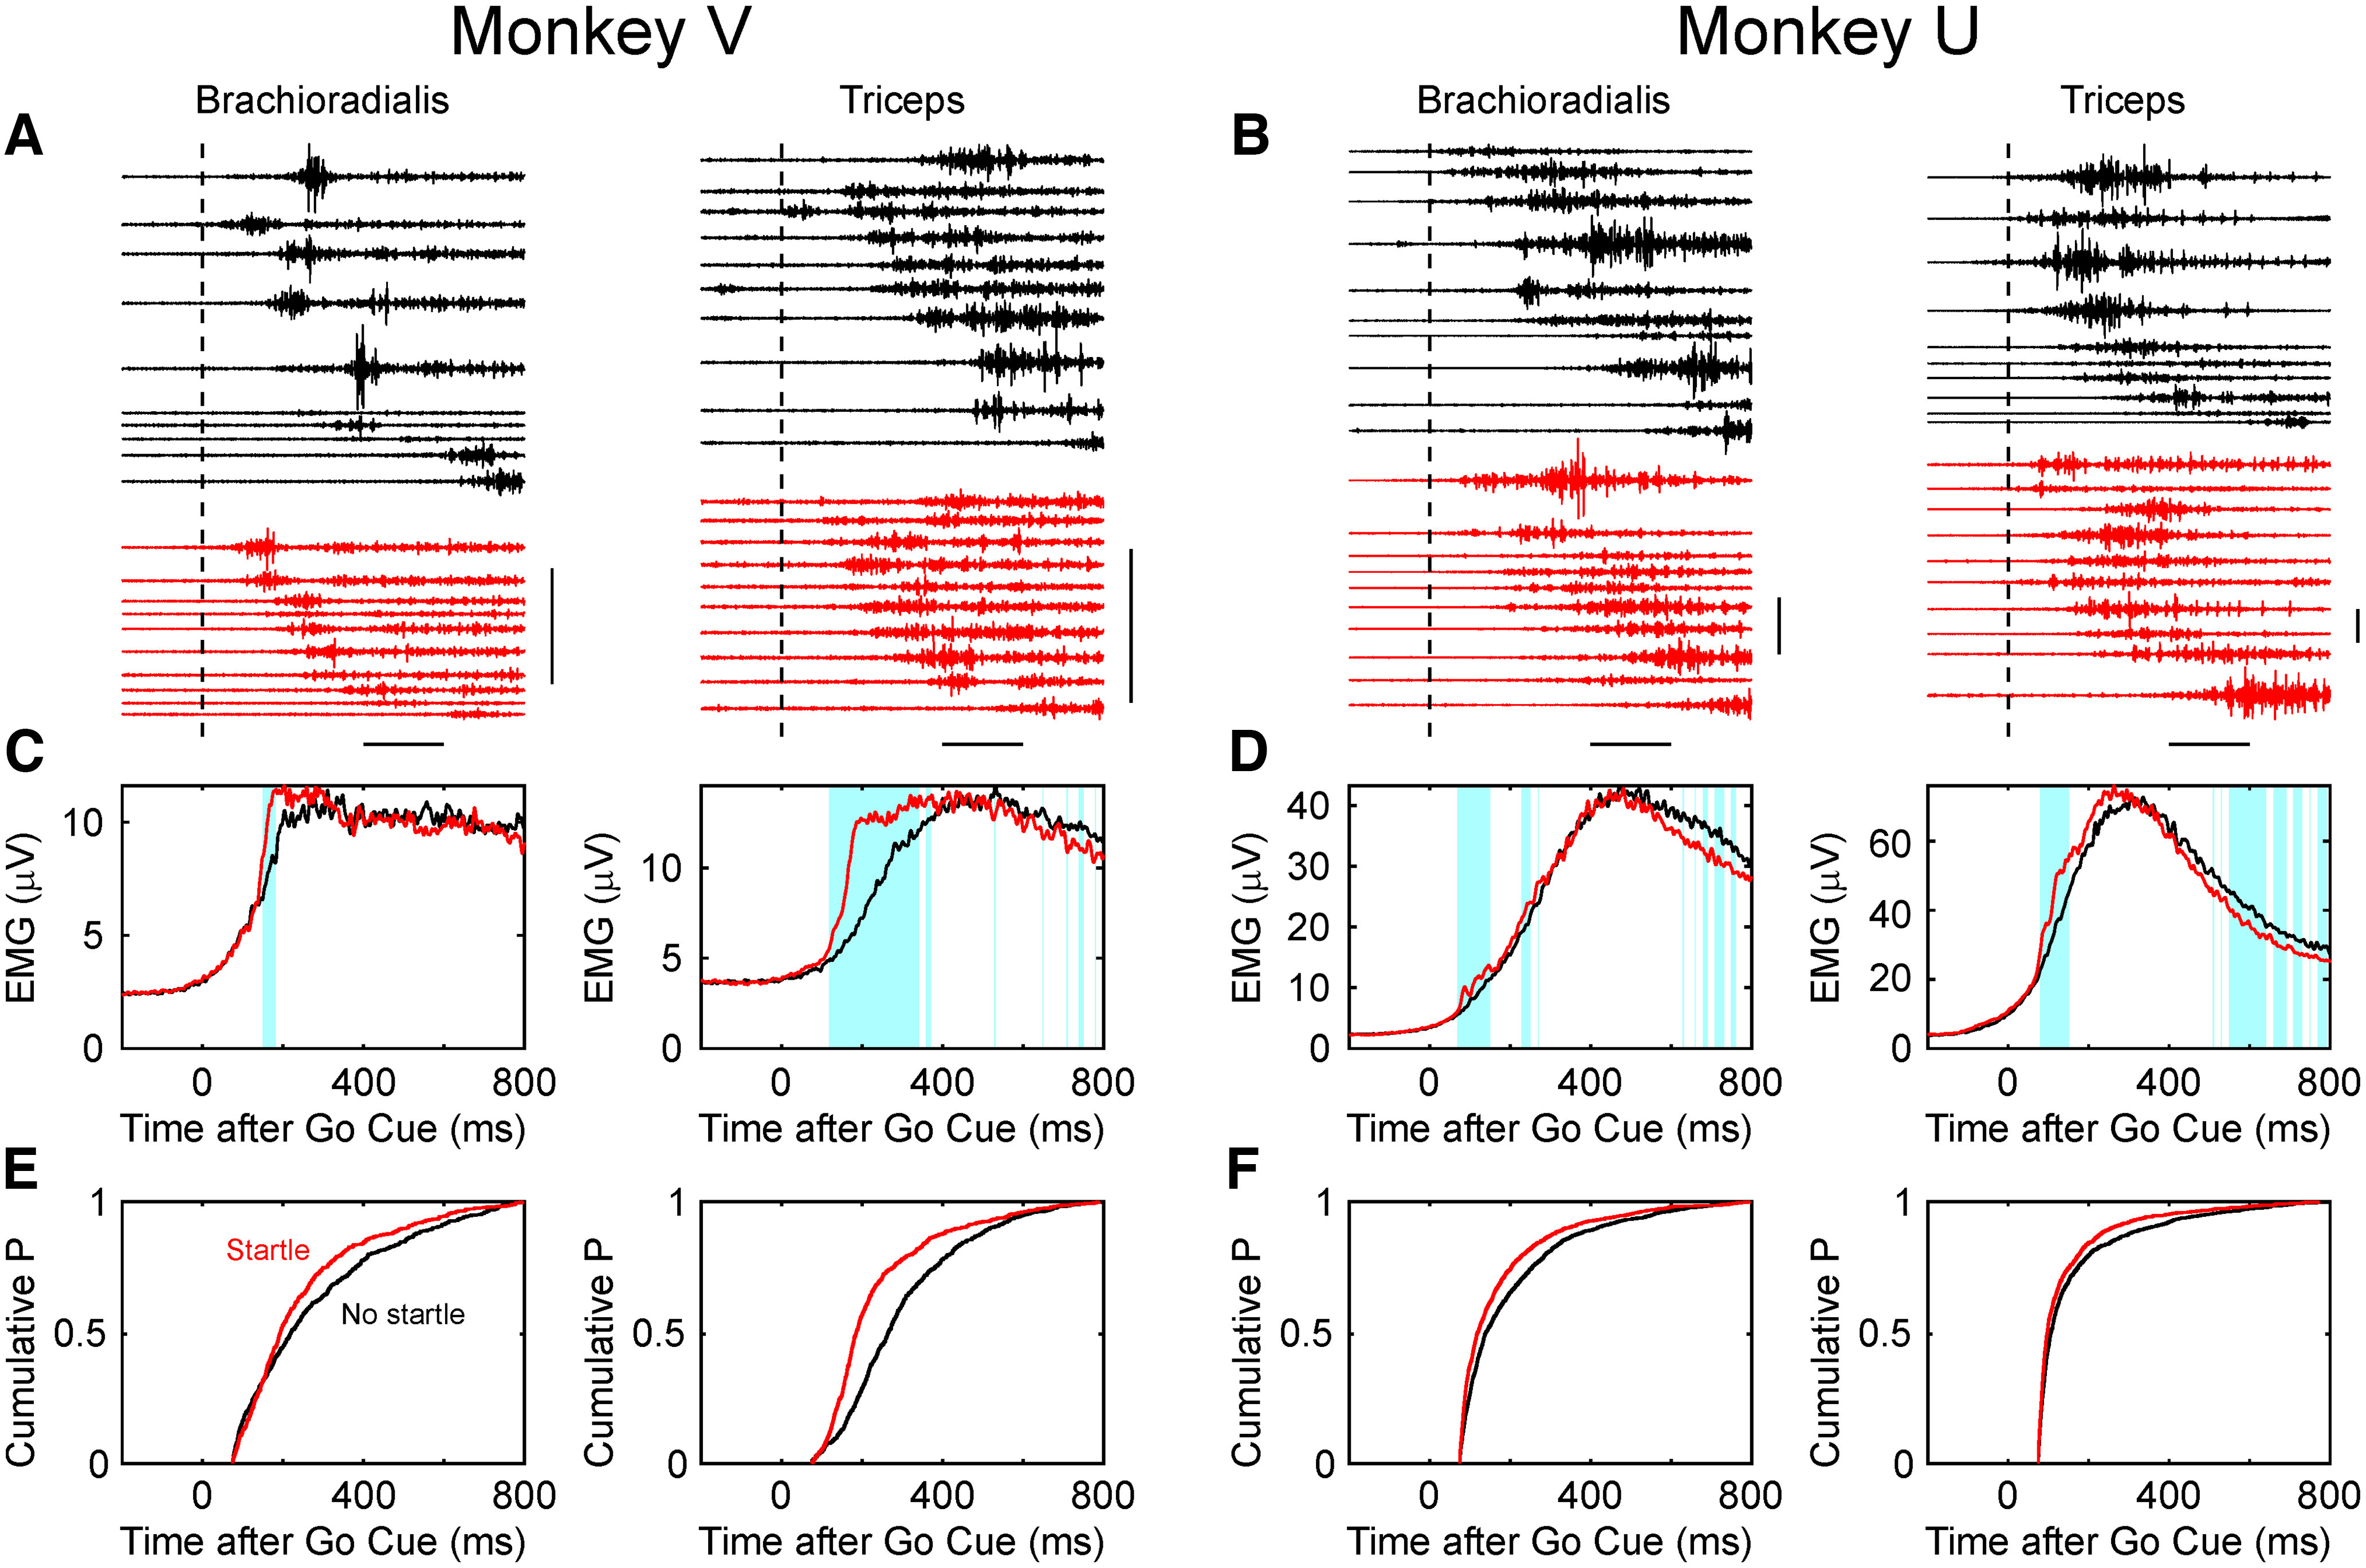
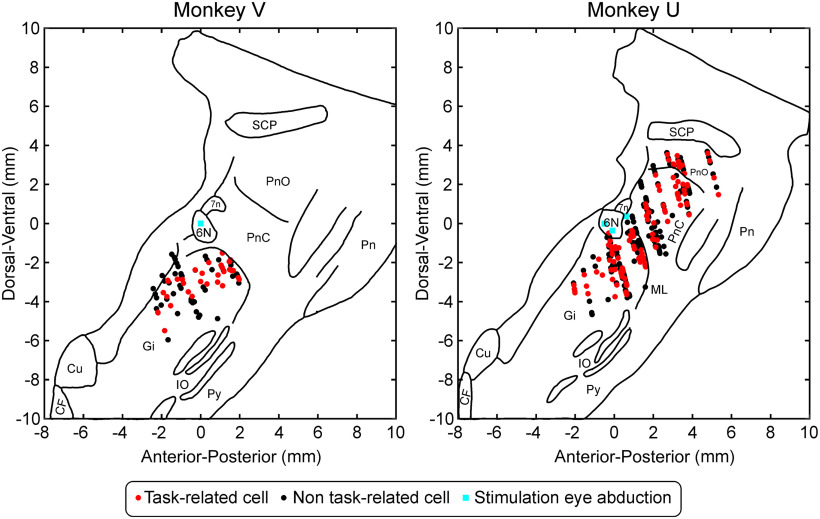
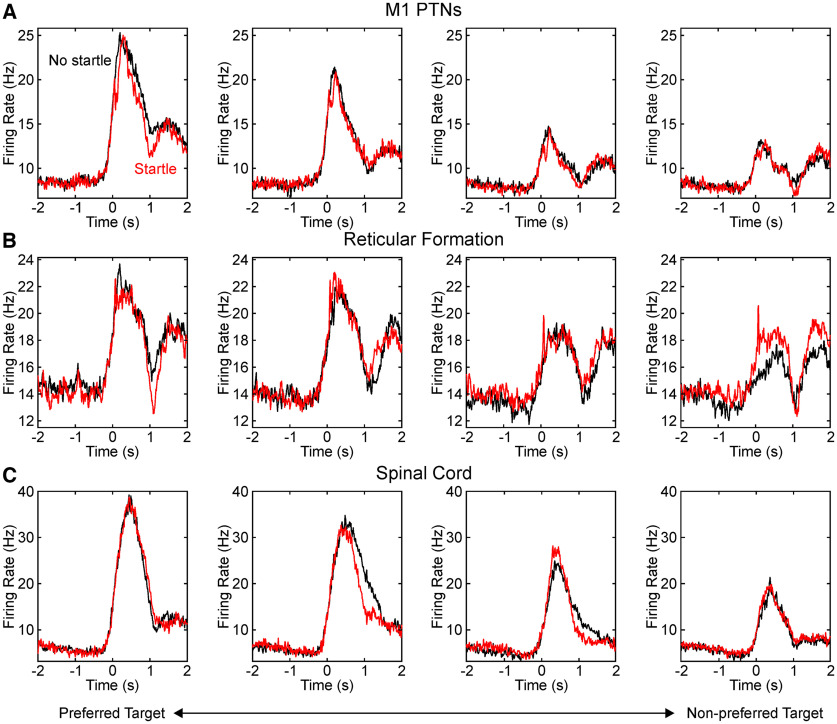
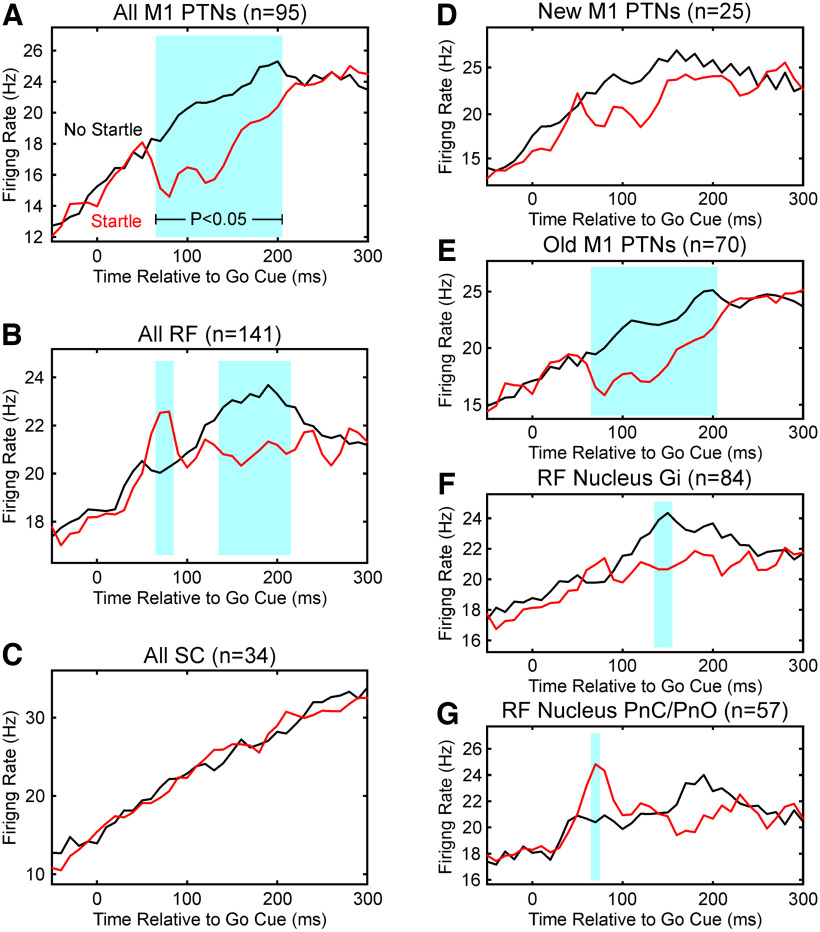
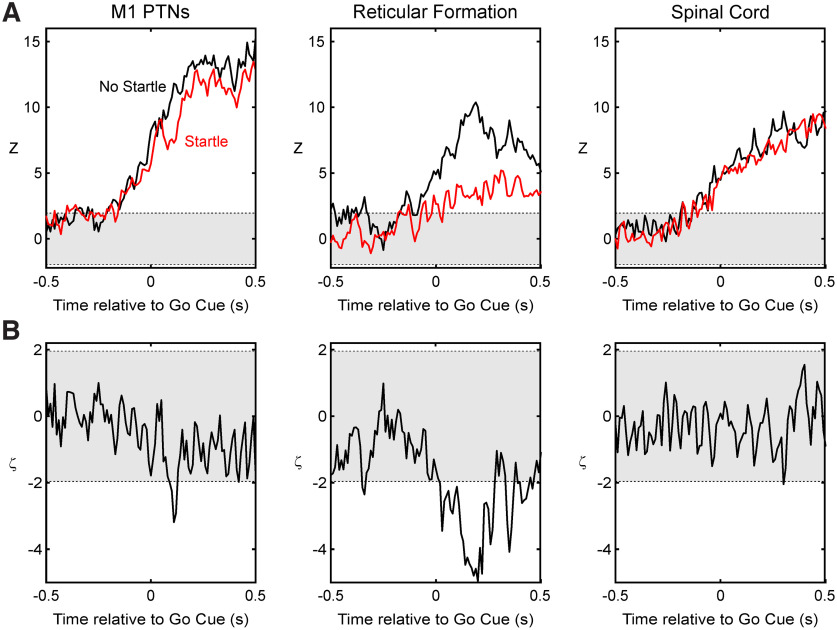
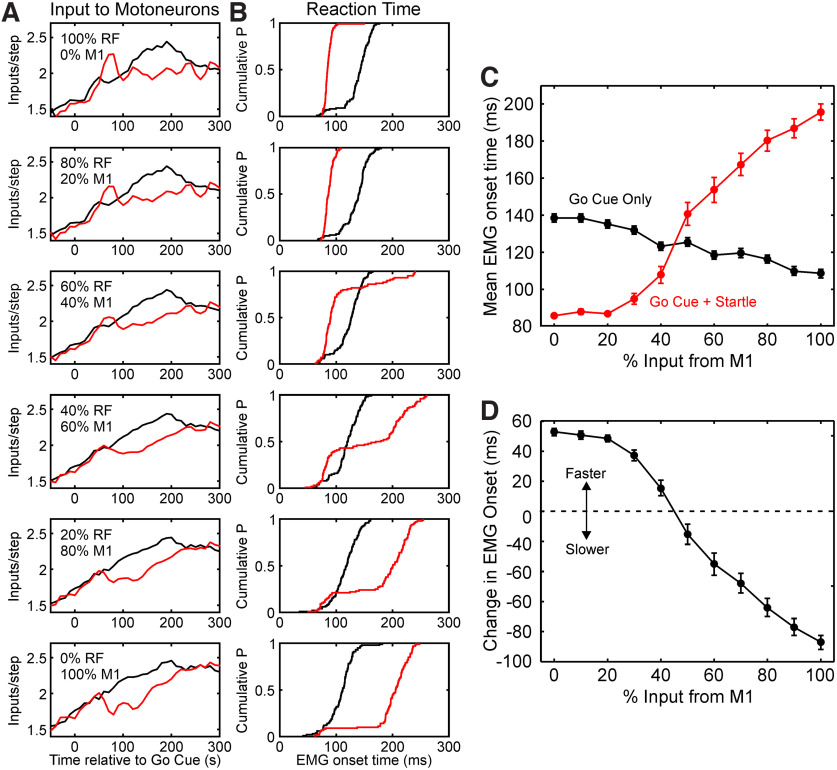
Reaction time is accelerated if a loud (startling) sound accompanies the cue-the "StartReact" effect. Animal studies revealed a reticulospinal substrate for the startle reflex; StartReact may similarly involve the reticulospinal tract, but this is currently uncertain. Here we trained two female macaque monkeys to perform elbow flexion/extension movements following a visual cue. The cue was sometimes accompanied by a loud sound, generating a StartReact effect in electromyogram response latency, as seen in humans. Extracellular recordings were made from antidromically identified corticospinal neurons in primary motor cortex (M1), from the reticular formation (RF), and from the spinal cord (SC; C5-C8 segments). After loud sound, task-related activity was suppressed in M1 (latency, 70-200 ms after cue), but was initially enhanced (70-80 ms) and then suppressed (140-210 ms) in RF. SC activity was unchanged. In a computational model, we simulated a motoneuron pool receiving input from different proportions of the average M1 and RF activity recorded experimentally. Motoneuron firing generated simulated electromyogram, allowing reaction time measurements. Only if ≥60% of motoneuron drive came from RF (≤40% from M1) did loud sound shorten reaction time. The extent of shortening increased as more drive came from RF. If RF provided <60% of drive, loud sound lengthened the reaction time-the opposite of experimental findings. The majority of the drive for voluntary movements is thus likely to originate from the brainstem, not the cortex; changes in the magnitude of the StartReact effect can measure a shift in the relative importance of descending systems.SIGNIFICANCE STATEMENT Our results reveal that a loud sound has opposite effects on neural spiking in corticospinal cells from primary motor cortex, and in the reticular formation. We show that this fortuitously allows changes in reaction time produced by a loud sound to be used to assess the relative importance of reticulospinal versus corticospinal control of movement, validating previous noninvasive measurements in humans. Our findings suggest that the majority of the descending drive to motoneurons producing voluntary movement in primates comes from the reticulospinal tract, not the corticospinal tract.

Keywords: brainstem; corticospinal; motor cortex; reaction time; reticulospinal; startle.


Figures

Figure 1.
Figure 1.
Behavioral task. A, Schematic illustration of the sequence of the behavioral task. The forearm was moved passively by a torque motor to the central position, and the central button illuminated white. One of the four targets then illuminated green, acting as an instructional cue. The target turned red as a go cue, and the monkey moved the arm to align to the target and obtain a reward. B, Example lever movement recordings during performance of trials to different targets, shown by the different colors. Horizontal dotted lines indicate the target positions. Traces are aligned to the go cue.
Figure 2.
Figure 2.
Computational model. A, Experimentally determined average rate profiles for populations of cells from M1 and RF were scaled to have the same background and peak rates, and then mixed with a mixing factor f, which determined the ratio of M1 to RF drive. A pool of motoneurons received inputs modulated with this rate profile. B, Whenever a motoneuron fired a spike (example membrane potential), it generated a motor unit action potential. C, D, The population activity over the motoneuron pool (C, rasters) summed to give a simulated EMG (D).
Figure 3.
Figure 3.
The StartReact effect in monkey EMG. A, Single sweeps of EMG from the brachioradialis (left) and triceps (right) muscles, from monkey V. Traces have been aligned on the go cue, for the instructed target nearest to or farthest from the monkey, for brachioradialis and triceps muscles, respectively. Black traces, The response following a go cue only; red traces, following a go cue combined with a loud sound. Dotted line shows the time of the cue. The 10 traces have been selected to represent the 5th, 15th, and 25th up to 95th percentile of the reaction time distribution. Calibration: 1 mV, 200 ms. B, As A, but for monkey U. C, Average of rectified EMG from monkey V. Blue shading shows sections 50–800 ms after the go cue where EMG activity differed significantly between responses to go cue only and go cue with loud sound. D, As in C, but for monkey U. E, Cumulative distribution of reaction times measured from each single trial of the data that generated the averages in C. F, As for E, but for monkey U corresponding to averages in D. Measures compiled from between 628 and 1422 trials of the task.
Figure 4.
Figure 4.
Estimated location of brainstem recording sites. For each monkey, a tracing is shown of a parasagittal section of the brainstem, at ∼1.5 mm lateral to the midline. The orientation of the brainstem has been rotated to align with standard stereotaxic coordinates, based on MRI scans taken in a sitting posture. Anterior–posterior and dorsal–ventral coordinates are expressed relative to the interaural line, with positive numbers indicating anterior and dorsal, respectively. Black and red dots mark the estimated location of recorded single neuron activity; the color shows if the cell was significantly modulated by the task (red) or not (black). Cell locations have been aligned to sites where stimulation generated clear ipsilateral eye abduction, corresponding to the abducens nucleus (blue dots). 6N, Abducens nucleus; 7n, facial nerve; CF, cuneate fasciculus; Cu, cuneate nucleus; IO, inferior olive; Pn, pons; Py, pyramidal tract; SCP, superior cerebellar peduncle.
Figure 5.
Figure 5.
Average perievent histograms. Traces show the average cell firing rate, measured across all cells in the stated population, which were significantly modulated with the task. Firing has been aligned to the go cue at time 0. For each cell, we determined whether the target nearest to or furthest away from the monkey gave the greatest firing rate. The left column shows averages for the preferred target, and subsequent columns show averages for the immediately adjacent target. Black traces, The response following a go cue only; red traces, go cue combined with loud sound. A, For antidromically identified PTNs from M1. B, For cells in the RF. C, For interneurons in the cervical enlargement of the spinal cord.
Figure 6.
Figure 6.
Average perievent histograms on an expanded timescale. Traces show the perievent histograms from Figure 5 for preferred target, on an expanded timescale to illustrate the differences produced by the loud sound more clearly. A, For M1 PTNs. B, For reticular formation. C, For spinal cord. D, For M1 PTNs in the bank of the central sulcus (New M1), E, For M1 PTNs on the gyrus (Old M1). F, For RF cells estimated to lie within the Gi. G, For RF cells estimated to lie in the pontine reticular nuclei (PnC/PnO). Blue shading indicates bins where activity after loud sound (red) was significantly different from after the visual go cue only (black).
Figure 7.
Figure 7.
The z score analysis. A, Population z score for each area, showing how activity differed between preferred and nonpreferred targets. Gray shading indicates −1.96 < z < 1.96, corresponding to the 95% confidence limit on activity that is no different between targets. Different lines show results for trials with go cue only (black), and after a loud sound (red). B, Difference between the corresponding red and black traces from A, scaled to remain as a z score (measure defined as ζ in Materials and Methods). Positive values above the confidence limits (also gray shading) indicate that the loud sound significantly increased the difference in cell activity between the two targets; negative values indicate that the loud sound decreased this difference.
Figure 8.
Figure 8.
Computational model results. A, Time profile of synaptic inputs to the motoneuron pool per 0.2-ms-long time step. These plots have been generated by scaling the experimentally determined profiles in Figures 5 and 6 in response to the preferred target, and then mixing activity from RF and M1 in the relative proportions shown. Black, Input for trials following the visual go cue only; red, when the cue is combined with a loud sound. B, Cumulative probability distribution plots of reaction time, measured from simulated EMG, for the different profiles of input to the motoneuron pool shown in A. C, Variation in reaction time with the proportion of input derived from M1, for trials following a go cue only (black) or after a go cue and loud sound (red). D, Differences between reaction times shown in C, calculated so that positive differences indicate a faster reaction time, and negative differences indicate a slower reaction time, after a loud sound. Note that only if <50% of input to the motoneuron pool comes from M1 is the reaction time shortened by a loud sound, as seen experimentally (Fig. 3). Points in C and D show the mean and SEM, calculated over 100 simulated trials for each condition.

Similar articles

Cited by

References

    1. Alstermark B, Isa T, Ohki Y, Saito Y (1999) Disynaptic pyramidal excitation in forelimb motoneurons mediated via C(3)-C(4) propriospinal neurons in the Macaca fuscata. J Neurophysiol 82:3580–3585. 10.1152/jn.1999.82.6.3580 - DOI - PubMed
    1. Asanuma H, Zarzecki P, Jankowska E, Hongo T, Marcus S (1979) Projection of individual pyramidal tract neurons to lumbar motor nuclei of the monkey. Exp Brain Res 34:73–89. 10.1007/BF00238342 - DOI - PubMed
    1. Baker SN, Lemon RN (1998) Computer simulation study of post-spike facilitation in spike triggered averages of rectified EMG. J Neurophysiol 80:1391–1406. 10.1152/jn.1998.80.3.1391 - DOI - PubMed
    1. Baker SN, Perez MA (2017) Reticulospinal contributions to gross hand function after human spinal cord injury. J Neurosci 37:9778–9784. 10.1523/JNEUROSCI.3368-16.2017 - DOI - PMC - PubMed
    1. Baker SN, Philbin N, Spinks R, Pinches EM, Wolpert DM, MacManus DG, Pauluis Q, Lemon RN (1999) Multiple single unit recording in the cortex of monkeys using independently moveable microelectrodes. J Neurosci Methods 94:5–17. 10.1016/s0165-0270(99)00121-1 - DOI - PubMed

Publication types

LinkOut - more resources