

Estimation of genotype by temperature-humidity index interactions on milk production and udder health traits in Montbeliarde cows
- PMID: 36658500
- PMCID: PMC9854084
- DOI: 10.1186/s12711-023-00779-1
Estimation of genotype by temperature-humidity index interactions on milk production and udder health traits in Montbeliarde cows
Abstract
Background: Heat stress negatively influences cattle welfare, health and productivity. To cope with the forecasted increases in temperature and heat waves frequency, identifying high-producing animals that are tolerant to heat is of capital importance to maintain milk production. This study, based on the joint analysis of on-farm performance and weather data, had two objectives: (1) to determine the response in production performances (milk, fat and protein yields, fat and protein contents) and udder health (somatic cell score) to temperature-humidity index (THI) variations in Montbeliarde cows, and (2) to estimate the interactions between genotype and THI, to enable the identification of the most adapted animals for facing the expected increases in temperature.
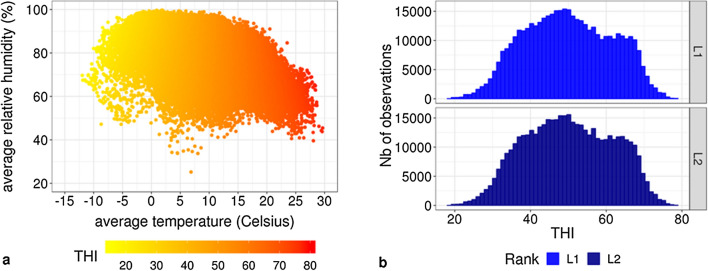
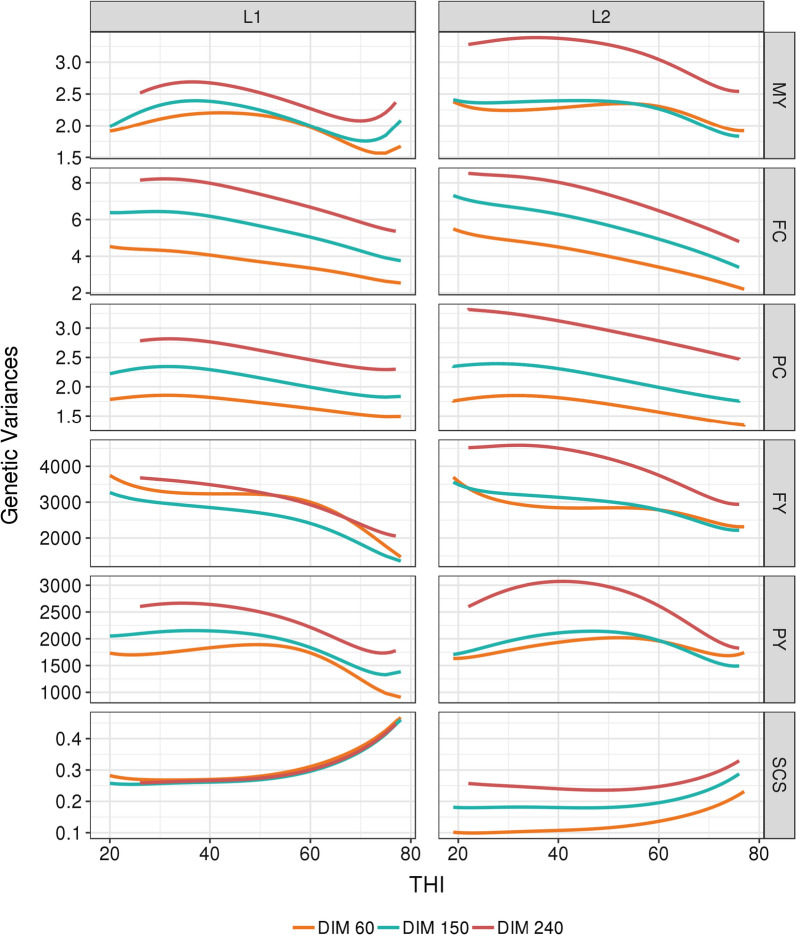
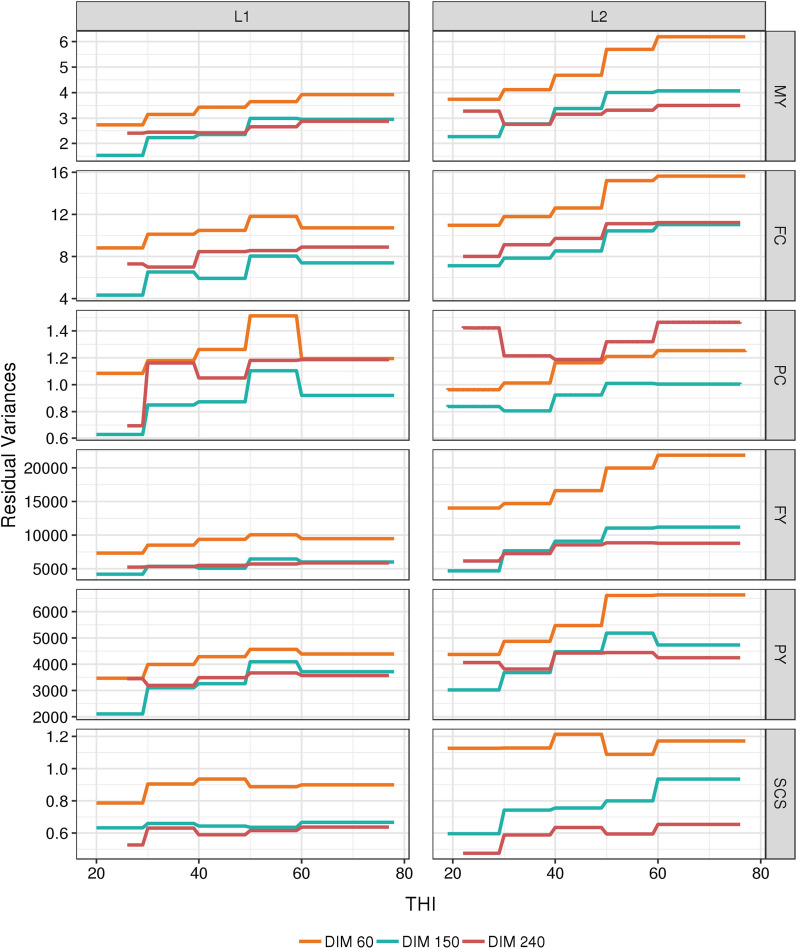
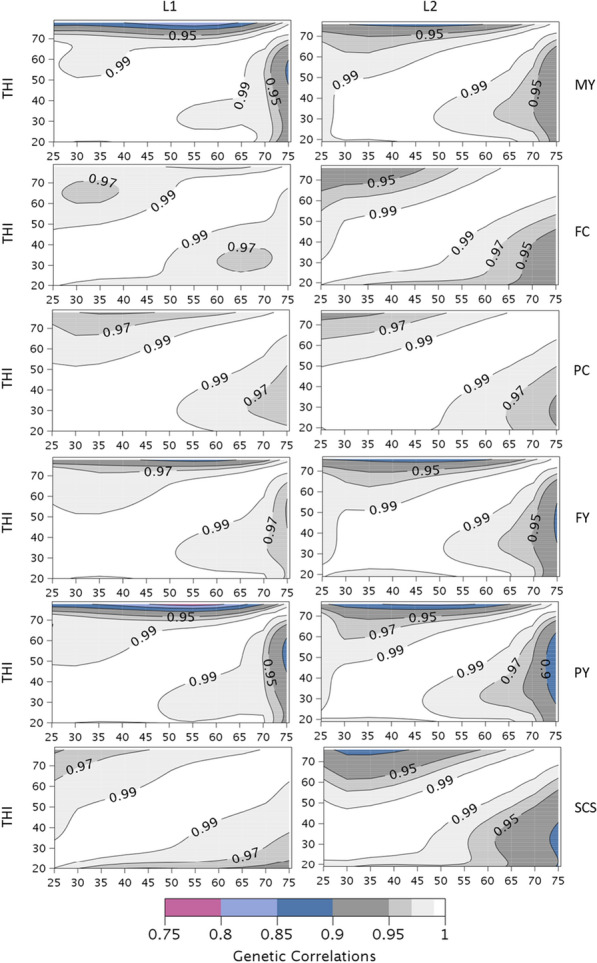
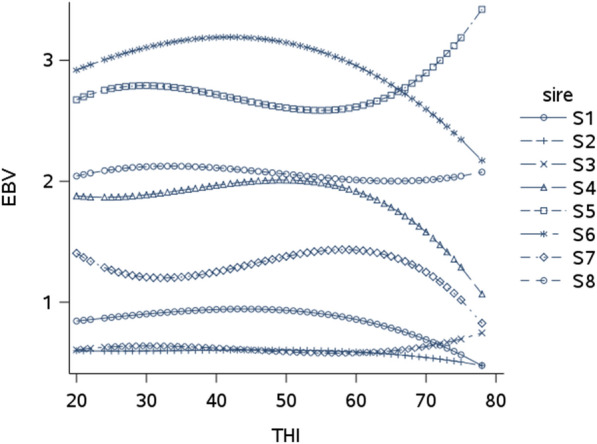
Results: Test-day records from first and second lactations from 2016 to 2020 were associated with the average THI during the three days before the test-day record. In total, 446,717 test-day records from 55,650 cows in first lactation and 457,516 test-day records from 58,229 cows in second lactation were analysed. The optimal THI was below 55 (i.e. ~ 12-13 °C) for all traits. Individual responses to THI were estimated by random regression models, which also included individual responses to days in milk. Regardless of the stage of lactation, genetic correlations along the THI gradient were above 0.80, which suggests that genotype-by-THI interactions were weak for production and udder health traits. Nevertheless, a variability in the individual slope of decay could be highlighted at high THI. The genetic correlation between production level at moderate THI and the slope at high THI was negative, while for somatic cell score, it was positive, indicating that heat stress amplifies the susceptibility to mastitis.
Conclusions: The optimal THI for French Montbeliarde cows is below 55 for production and udder health traits. Genetic-by-THI interactions are weak in French Montbeliarde cows for production and udder health traits, but not all animals react in the same way to high temperatures. Even if there is little room for improvement, using a heat tolerance index in cattle selection would be relevant to anticipate the expected increases in temperature. Further investigations are needed to interpret this variability on production traits. However, the current selection for mastitis resistance seems appropriate to adapt cattle to rising temperatures.
© 2023. The Author(s).
Conflict of interest statement
The authors declare that they have no competing interests.
Figures


References
-
- IPCC 2021: Summary for policymakers. Climate change 2021: The physical science basis. Contribution of working group I to the sixth assessment report of the intergovernmental panel on climate change. In: Masson-Delmotte V, Zhai P, Pirani A, Connors SL, Péan C, Berger S, Caud N, Chen Y, Goldfarb L, Gomis MI, Huang M, Leitzell K, Lonnoy E, Matthews JBR, Maycock TK, Waterfield T, Yelekçi O, Yu R, and B. Zhou, eds. Cambridge: Cambridge University Press; 2021. pp. 3−32.
-
- Idele. Milk recording results of cattle, goats and sheep—France. 2021. https://idele.fr/detail-article/milk-recording-results-of-cattle-goats-a.... Accessed 29 Dec 2022.
-
- INSEE. 2019. https://www.insee.fr/fr/statistiques/4176857. Accessed 29 Dec 2022.
MeSH terms
Grants and funding
LinkOut - more resources
Full Text Sources
Medical
