

Prospective study and validation of early warning marker discovery based on integrating multi-omics analysis in severe burn patients with sepsis
- PMID: 36659877
- PMCID: PMC9840905
- DOI: 10.1093/burnst/tkac050
Prospective study and validation of early warning marker discovery based on integrating multi-omics analysis in severe burn patients with sepsis
Abstract
Background: Early detection, timely diagnosis and rapid response are essential for case management and precautions of burn-associated sepsis. However, studies on indicators for early warning and intervention have rarely been conducted. This study was performed to better understand the pathophysiological changes and targets for prevention of severe burn injuries.
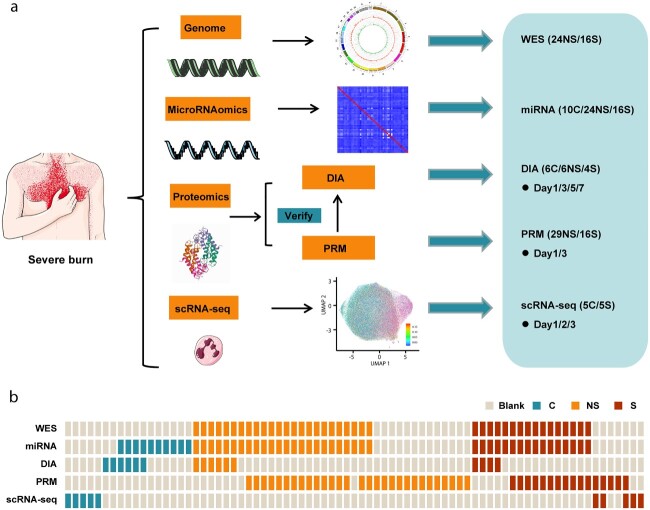
Methods: We conducted a multi-center, prospective multi-omics study, including genomics, microRNAomics, proteomics and single-cell transcriptomics, in 60 patients with severe burn injuries. A mouse model of severe burn injuries was also constructed to verify the early warning ability and therapeutic effects of potential markers.
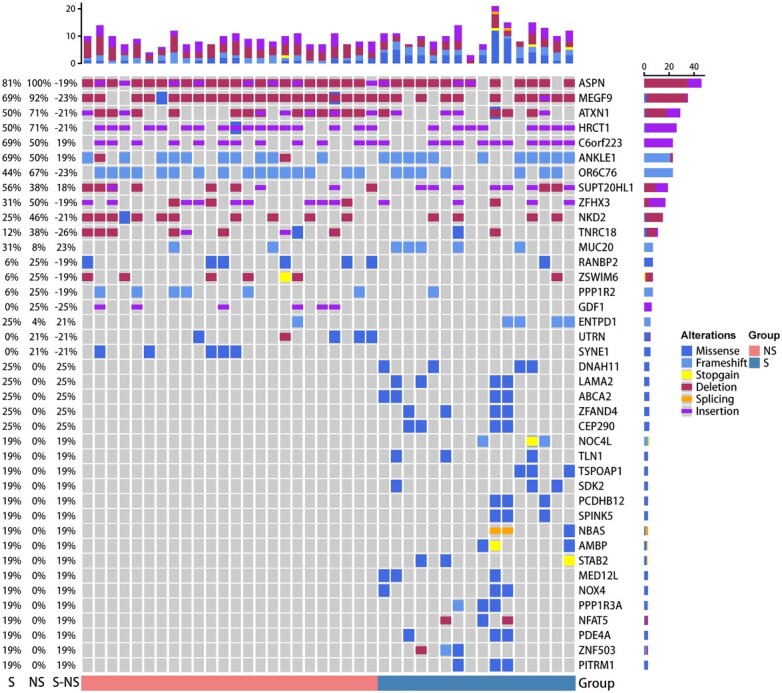
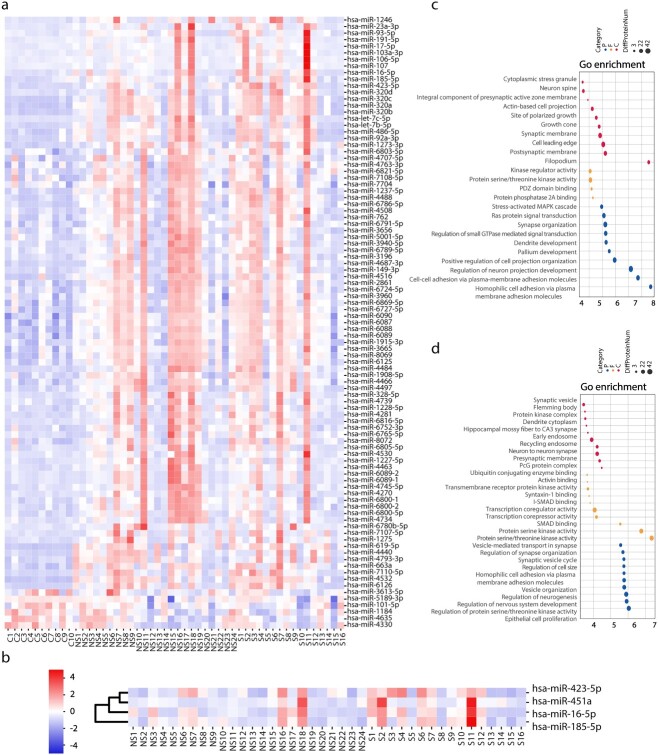
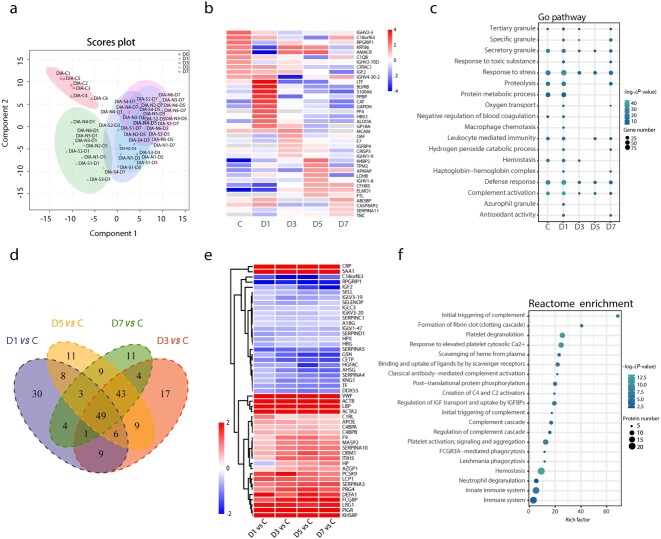
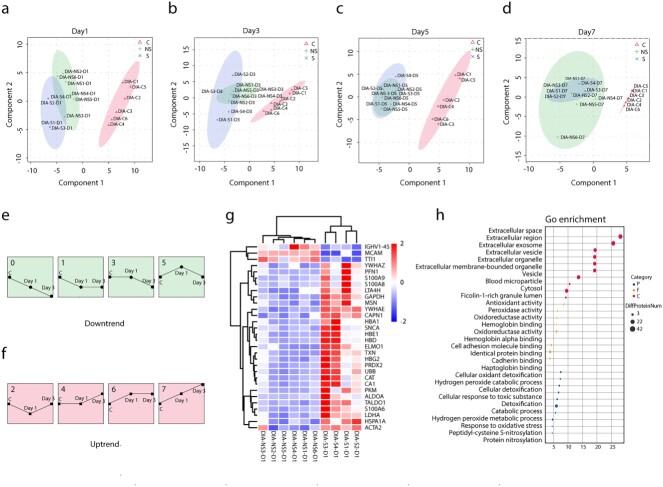
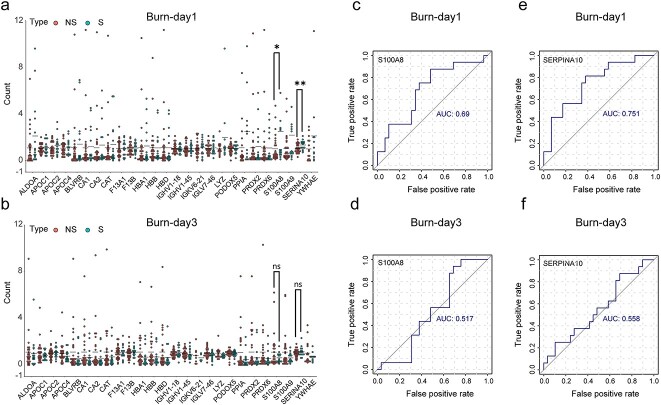
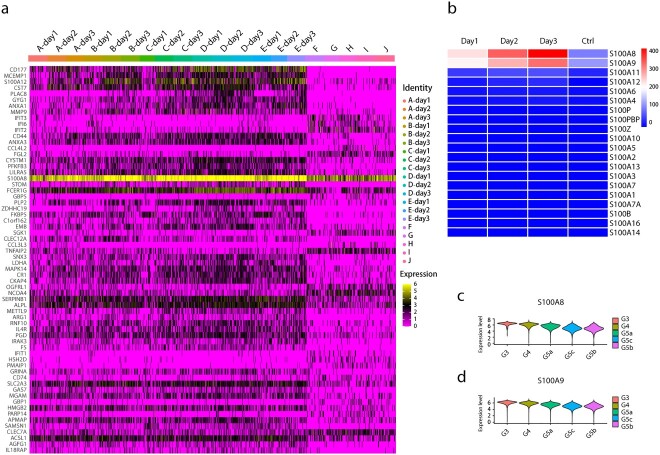
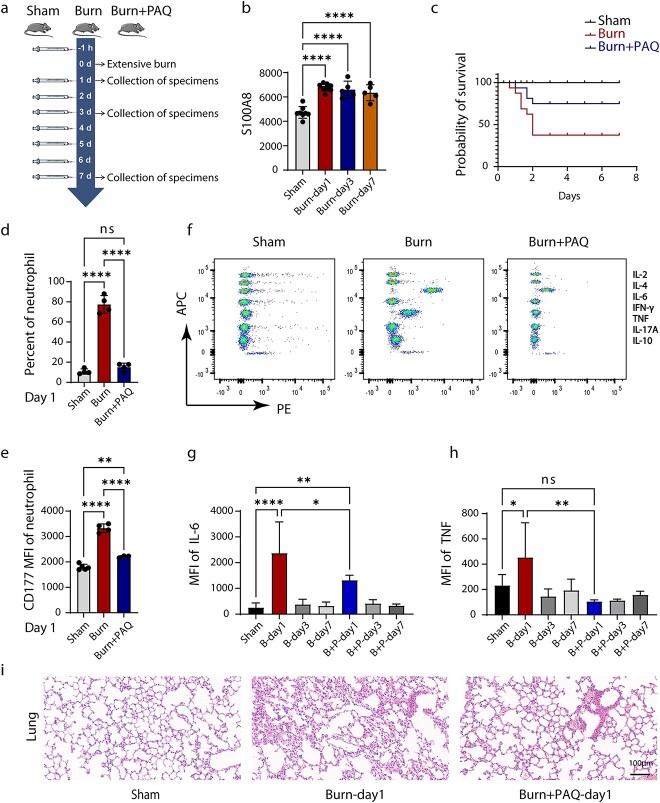
Results: Through genomic analysis, we identified seven important susceptibility genes (DNAH11, LAMA2, ABCA2, ZFAND4, CEP290, MUC20 and ENTPD1) in patients with severe burn injuries complicated with sepsis. Through plasma miRNAomics studies, we identified four miRNAs (hsa-miR-16-5p, hsa-miR-185-5p, hsa-miR-451a and hsa-miR-423-5p) that may serve as early warning markers of burn-associated sepsis. A proteomic study indicated the changes in abundance of major proteins at different time points after severe burn injury and revealed the candidate early warning markers S100A8 and SERPINA10. In addition, the proteomic analysis indicated that neutrophils play an important role in the pathogenesis of severe burn injuries, as also supported by findings from single-cell transcriptome sequencing of neutrophils. Through further studies on severely burned mice, we determined that S100A8 is also a potential early therapeutic target for severe burn injuries, beyond being an early warning indicator.
Conclusions: Our multi-omics study identified seven susceptibility genes, four miRNAs and two proteins as early warning markers for severe burn-associated sepsis. In severe burn-associated sepsis, the protein S100A8 has both warning and therapeutic effects.
Keywords: Early warning; Integrating multi-omics analysis; Marker; Sepsis; Severe burn.
© The Author(s) 2023. Published by Oxford University Press.
Figures
Similar articles
-
A Next-Generation Sequencing of Plasma Exosome-Derived microRNAs and Target Gene Analysis with a Microarray Database of Thermally Injured Skins: Identification of Blood-to-Tissue Interactions at Early Burn Stage.J Inflamm Res. 2021 Dec 10;14:6783-6798. doi: 10.2147/JIR.S343956. eCollection 2021. J Inflamm Res. 2021. PMID: 34916825 Free PMC article.
-
From traditional biochemical signals to molecular markers for detection of sepsis after burn injuries.Burns. 2019 Feb;45(1):16-31. doi: 10.1016/j.burns.2018.04.016. Epub 2018 May 23. Burns. 2019. PMID: 29802006 Review.
-
Application of Critical Care Scores in Severely Burned Patients.J Burn Care Res. 2021 Nov 24;42(6):1176-1180. doi: 10.1093/jbcr/irab030. J Burn Care Res. 2021. PMID: 33539518
-
[Changes in the expression of three markers in T lymphocytes of peripheral blood and immunoregulatory mechanisms of burned mice with sepsis at early stage].Zhonghua Shao Shang Za Zhi. 2016 Feb;32(2):89-96. doi: 10.3760/cma.j.issn.1009-2587.2016.02.007. Zhonghua Shao Shang Za Zhi. 2016. PMID: 26902275 Clinical Trial. Chinese.
-
Can miRNAs Serve as Potential Markers in Thermal Burn Injury: An In Silico Approach.J Burn Care Res. 2020 Jan 30;41(1):57-64. doi: 10.1093/jbcr/irz183. J Burn Care Res. 2020. PMID: 31701154 Review.
Cited by
-
Dissecting the endothelial cell landscape in meningioma: single-cell insights into PLVAP+ subpopulations and their role in tumor angiogenesis.Front Immunol. 2025 May 27;16:1591125. doi: 10.3389/fimmu.2025.1591125. eCollection 2025. Front Immunol. 2025. PMID: 40496867 Free PMC article.
-
Suppression of overactivated immunity in the early stage is the key to improve the prognosis in severe burns.Front Immunol. 2024 Sep 6;15:1455899. doi: 10.3389/fimmu.2024.1455899. eCollection 2024. Front Immunol. 2024. PMID: 39308854 Free PMC article.
-
Nanomaterial-based encapsulation of biochemicals for targeted sepsis therapy.Mater Today Bio. 2025 Jul 4;33:102054. doi: 10.1016/j.mtbio.2025.102054. eCollection 2025 Aug. Mater Today Bio. 2025. PMID: 40688672 Free PMC article. Review.
-
Ceramide Complex Ameliorates Metabolically Driven Neutrophil Senescence by Regulating Apoptosis via the cGAS-STING Pathway.Int J Med Sci. 2025 Feb 10;22(5):1124-1137. doi: 10.7150/ijms.104801. eCollection 2025. Int J Med Sci. 2025. PMID: 40027178 Free PMC article.
-
Advances in nanomaterial-targeted treatment of acute lung injury after burns.J Nanobiotechnology. 2024 Jun 18;22(1):342. doi: 10.1186/s12951-024-02615-0. J Nanobiotechnology. 2024. PMID: 38890721 Free PMC article. Review.
References
LinkOut - more resources
Full Text Sources
Research Materials
Miscellaneous
