Comment
. 2023 Oct 10;7(19):5698-5702.
doi: 10.1182/bloodadvances.2022008955.

Acquired BTK mutations associated with resistance to noncovalent BTK inhibitors

Affiliations
Comment

Acquired BTK mutations associated with resistance to noncovalent BTK inhibitors

Jialei Qi et al. Blood Adv. .
No abstract available


Conflict of interest statement

Conflict-of-interest disclosure: The authors declare no competing financial interests.

Figures

Figure 1.
Figure 1.
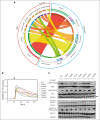
Mutations in BTK and PLCG2 appear under selection pressure by BTK inhibitors in REC-1 cells. (A) Circos plot summarizing the distribution of BTK and PLCG2 mutations in REC-1 cells resistant to the different covalent and noncovalent BTK inhibitors. The innermost circle represents the number of independent lines of REC-1 cells that were used for generating resistance to each inhibitor and the number of REC-1 lines that acquired the specific mutations. (B) Comparison of intracellular calcium flux between WT and mutant REC-1 cells upon stimulation with 10 μg/mL of anti-IgM. Normalization was performed for baseline [Ca2+]i before anti-IgM stimulation and to maximum [Ca2+]i obtained for each cell line upon treatment with ionomycin. (C) Western blotting analysis for activation of phospho-BTK, phospho-PLCγ2, phospho-AKT, and phospho-ERK upon stimulation with 10 μg/mL anti-IgM for 15 minutes. In addition, total BTK, PLCγ2, AKT, and ERK1/2 levels were analyzed with glyceraldehyde-3-phosphate dehydrogenase (GAPDH) as the loading control. The arrow indicates the band for GAPDH. The data shown in B and C are representatives of 3 independent measurements.
Figure 2.
Figure 2.
Response of BTK mutant REC-1 cells to the different covalent and noncovalent BTK inhibitors. (A) VAF of the different BTK mutations acquired in the REC-1 cells are indicated. Each of the cell lines (WT or BTK mutant) were treated in triplicates with increasing concentrations of the indicated covalent and noncovalent BTK inhibitors. Cell viability was measured after 96 hours using CellTiter Glo (Promega). Heatmap on the left shows the fold change in the IC50s of the respective cell lines compared to the WT cells for each of the BTK inhibitors. The cell viability heatmap is a summary of 3 independent experiments. Intracellular calcium flux was determined after exposing the different REC-1 cell lines (WT or BTK mutant) to 1 μM of the covalent or noncovalent BTK inhibitors for 1 hour, followed by stimulation with 10μg/mL of anti-IgM. The heatmap on the right shows percentage inhibition of the maximum calcium flux obtained upon BCR stimulation. The values for calculating the percentage inhibition were taken from representative experiments shown in supplemetal Figure 7A. Calcium flux measurement for each independent REC-1 line treated with 8 different BTK inhibitors and dimethyl sulfoxide control was performed at least twice. (B) COS-7 cells were transfected as indicated with 100 ng/well of vector encoding PLCγ2 and 400 ng/well of empty vector () or increasing amounts (100, 200, and 400 ng/well) of vector encoding WT, C481S, C481F, G409R, L528W, L528S, G480R, D539H or K430R mutant BTK. Twenty-four hours after transfection, the cells were incubated for 18 hours with myo-[2-3H] inositol, and inositol phosphate formation was then determined. Results are one representative from 3 independent experiments and illustrated as mean ± SD of 3 technical replicates (C) Representative western blot showing IGF1R expression in BTK mutant REC-1 cells in comparison to WT. (D) Expression of IGF1R in the BTK mutant REC-1 cells normalized to that of WT. IGF1R expression was quantified using ImageJ from 2 repetitions of the western blots and normalized to the corresponding GAPDH controls. (E) The BTK mutant and WT REC-1 cells were treated with increasing concentrations of the IGF1R inhibitor linsitinib for 96 hours and cell viability was measured using CellTiter Glo (Promega). The data shown is a summary of 3 independent experiments performed in triplicates.

Comment on

  • Mechanisms of Resistance to Noncovalent Bruton's Tyrosine Kinase Inhibitors.
    Wang E, Mi X, Thompson MC, Montoya S, Notti RQ, Afaghani J, Durham BH, Penson A, Witkowski MT, Lu SX, Bourcier J, Hogg SJ, Erickson C, Cui D, Cho H, Singer M, Totiger TM, Chaudhry S, Geyer M, Alencar A, Linley AJ, Palomba ML, Coombs CC, Park JH, Zelenetz A, Roeker L, Rosendahl M, Tsai DE, Ebata K, Brandhuber B, Hyman DM, Aifantis I, Mato A, Taylor J, Abdel-Wahab O. Wang E, et al. N Engl J Med. 2022 Feb 24;386(8):735-743. doi: 10.1056/NEJMoa2114110. N Engl J Med. 2022. PMID: 35196427 Free PMC article.
References

    1. Yosifov DY, Wolf C, Stilgenbauer S, Mertens D. From biology to therapy: the CLL success story. Hemasphere. 2019;3(2):e175. - PMC - PubMed
    1. Byrd JC, Hillmen P, O’Brien S, et al. Long-term follow-up of the RESONATE phase 3 trial of ibrutinib vs ofatumumab. Blood. 2019;133(19):2031–2042. - PMC - PubMed
    1. O’Brien S, Furman RR, Coutre S, et al. Single-agent ibrutinib in treatment-naïve and relapsed/refractory chronic lymphocytic leukemia: a 5-year experience. Blood. 2018;131(17):1910–1919. - PMC - PubMed
    1. Timofeeva N, Gandhi V. Ibrutinib combinations in CLL therapy: scientific rationale and clinical results. Blood Cancer J. 2021;11(4):79. - PMC - PubMed
    1. Wolska-Washer A, Robak T. Acalabrutinib: a bruton tyrosine kinase inhibitor for the treatment of chronic lymphocytic leukemia. Expet Rev Hematol. 2022;15(3):183–194. - PubMed

Substances