. 2023 Jan;136(1):14.
doi: 10.1007/s00122-023-04244-x. Epub 2023 Jan 20.

Simulations of rate of genetic gain in dry bean breeding programs

Affiliations

Simulations of rate of genetic gain in dry bean breeding programs

Jennifer Lin et al. Theor Appl Genet. 2023 Jan.

Erratum in

  • Correction to volume 136 issue 1.
    [No authors listed] [No authors listed] Theor Appl Genet. 2023 Mar 23;136(4):84. doi: 10.1007/s00122-023-04323-z. Theor Appl Genet. 2023. PMID: 36952001 Free PMC article. No abstract available.

Abstract

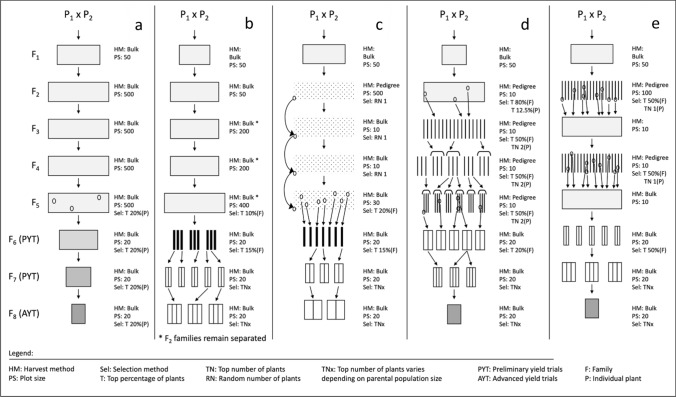
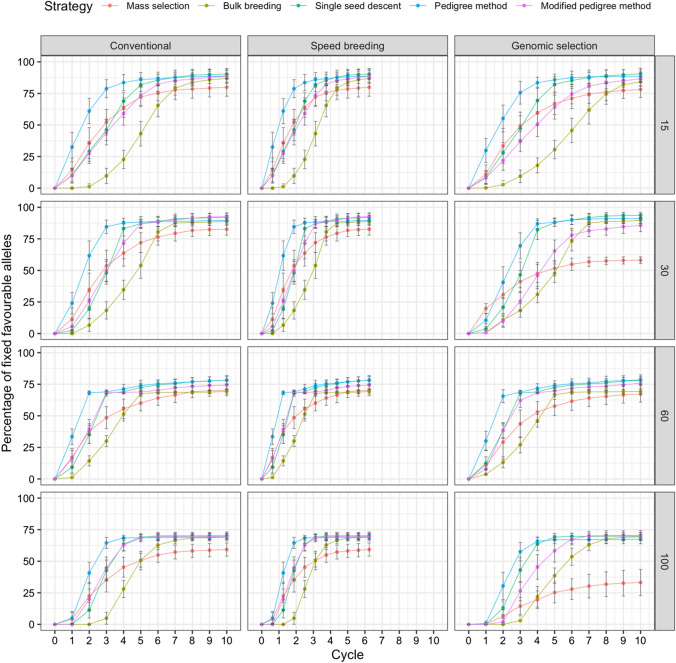
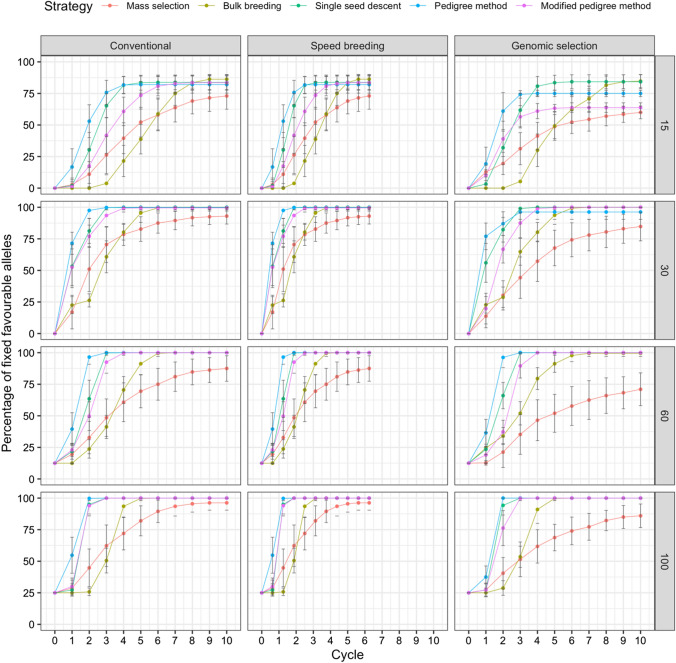
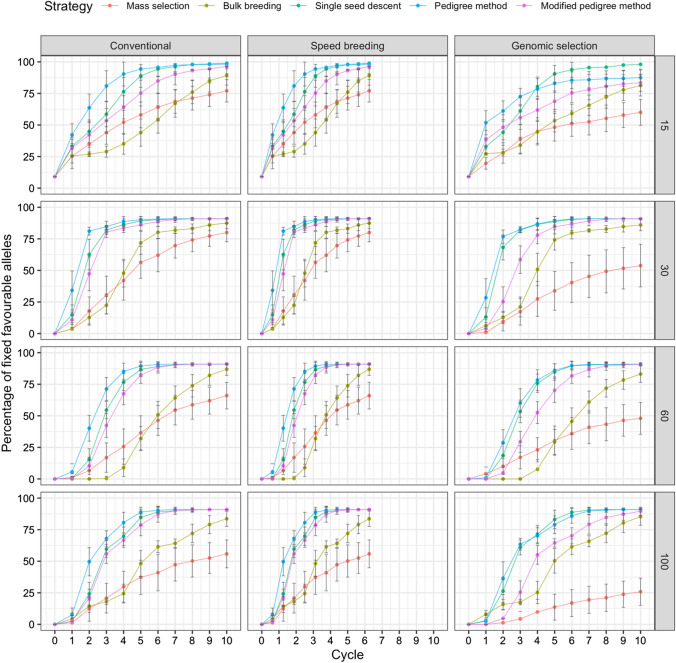
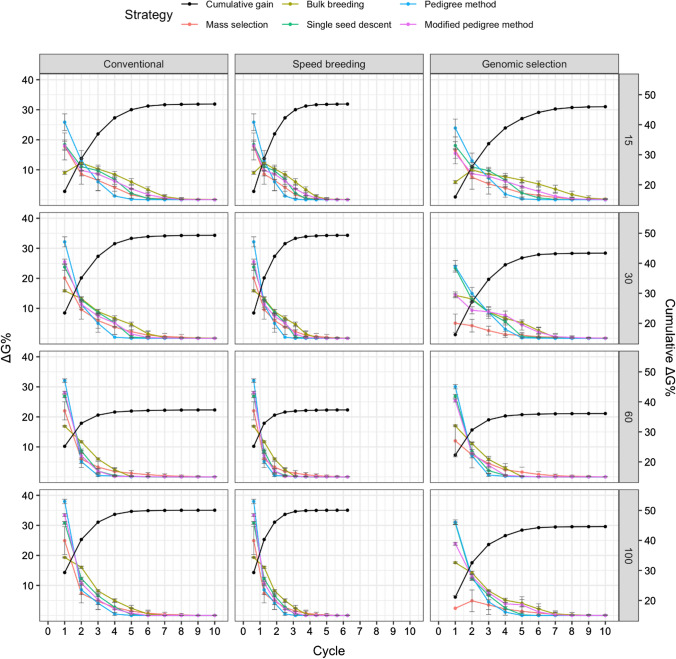
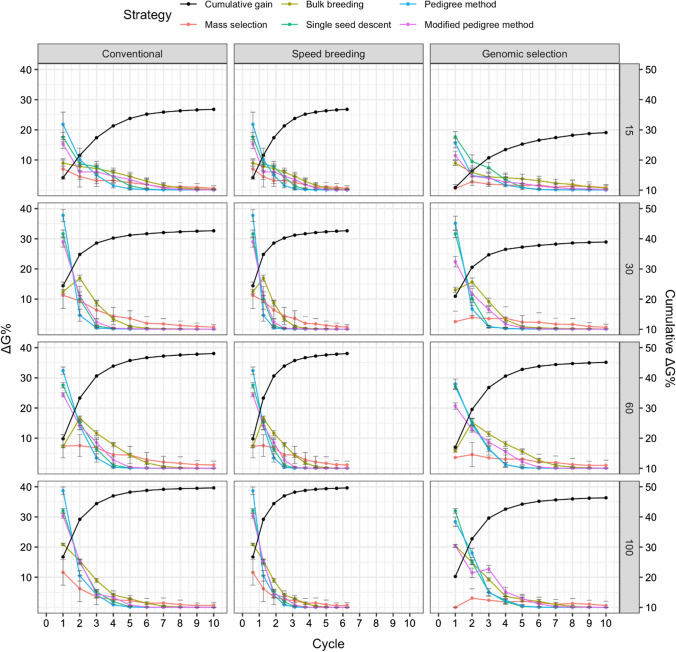
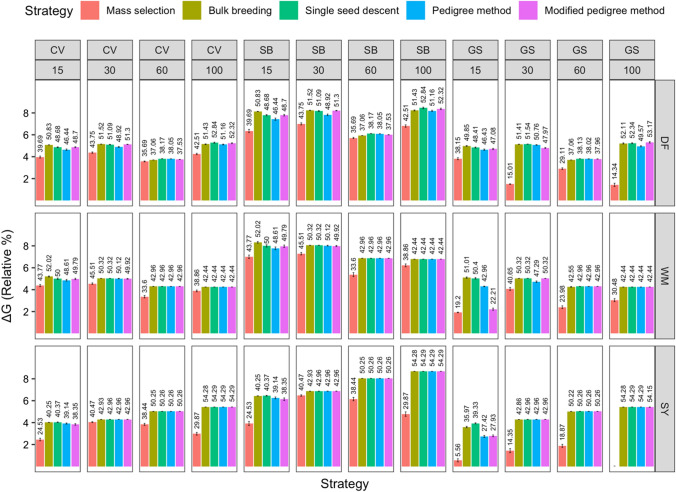
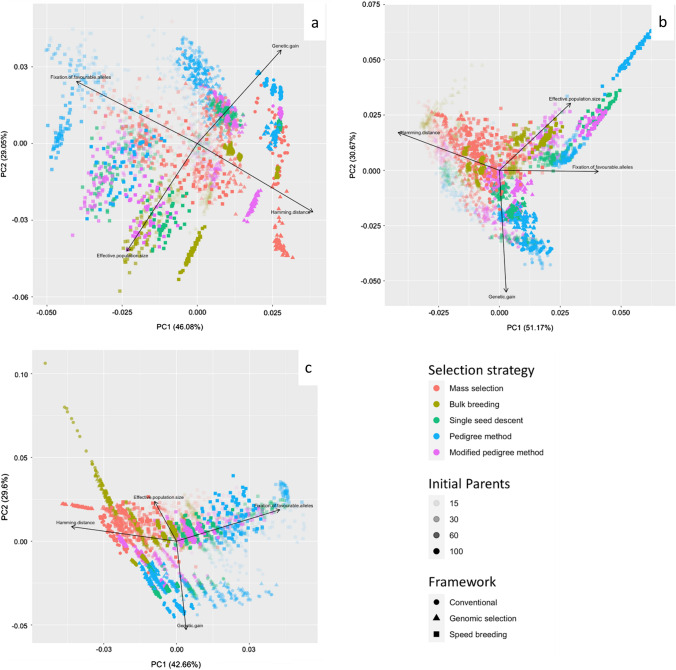
A reference study for breeders aiming at maximizing genetic gain in common bean. Depending on trait heritability and genetic architecture, conventional approaches may provide an advantage over other frameworks. Dry beans (Phaseolus vulgaris L.) are a nutrient dense legume that is consumed by developed and developing nations around the world. The progress to improve this crop has been quite steady. However, with the continued rise in global populations, there are demands to expedite genetic gains. Plant breeders have been at the forefront at increasing yields in the common bean. As breeding programs are both time-consuming and resource intensive, resource allocation must be carefully considered. To assist plant breeders, computer simulations can provide useful information that may then be applied to the real world. This study evaluated multiple breeding scenarios in the common bean and involved five selection strategies, three breeding frameworks, and four different parental population sizes. In addition, the breeding scenarios were implemented in three different traits: days to flowering, white mold tolerance, and seed yield. Results from the study reflect the complexity of breeding programs, with the optimal breeding scenario varying based on trait being selected. Relative genetic gains per cycle of up to 8.69% for seed yield could be obtained under the use of the optimal breeding scenario. Principal component analyses revealed similarity between strategies, where single seed descent and the modified pedigree method would often aggregate. As well, clusters in the direction of the Hamming distance eigenvector are a good indicator of poor performance in a strategy.


Conflict of interest statement

On behalf of all authors, the corresponding author states that there is no conflict of interest.

Figures

Fig. 1
Fig. 1
Selection strategies simulated in QuLinePlus. (a) Mass selection, (b) Bulk breeding, (c) Single seed descent, (d) Pedigree and (e) Modified pedigree
Fig. 2
Fig. 2
QU-GENE simulation workflow for simulation of breeding frameworks. Genomic selection (GS), conventional (CONV), and speed breeding (SB)
Fig. 3
Fig. 3
Comparison of five breeding strategies in terms of fixation of favorable alleles over 10 cycles of selection across 50 runs in a closed system. Selection for days to flowering was simulated with increasing numbers of initial parents displayed on the right and differing breeding frameworks shown at the top. Breeding strategies include mass selection, bulk breeding, single seed descent, pedigree method, modified pedigree method. Error bars indicate standard error
Fig. 4
Fig. 4
Comparison of five breeding strategies in terms of fixation of favorable alleles over 10 cycles of selection across 50 runs in a closed system. Selection for white mold tolerance was simulated with increasing numbers of initial parents displayed on the right and differing breeding frameworks shown at the top. Breeding strategies include mass selection, bulk breeding, single seed descent, pedigree method, modified pedigree method. Error bars indicate standard error
Fig. 5
Fig. 5
Comparison of five breeding strategies in terms of fixation of favorable alleles over 10 cycles of selection averaged across 50 runs in a closed system. Selection for seed yield was simulated with increasing numbers of initial parents displayed on the right and differing breeding frameworks shown at the top. Breeding strategies include mass selection, bulk breeding, single seed descent, pedigree method, modified pedigree method. Error bars indicate standard error
Fig. 6
Fig. 6
Comparison of five breeding strategies in terms of genetic gain per cycle over 10 cycles of selection averaged across 50 runs in a closed system. Selection for days to flowering was simulated with increasing numbers of initial parents displayed on the right and differing breeding frameworks shown at the top. Breeding strategies include mass selection, bulk breeding, single seed descent, pedigree method, modified pedigree method. Cumulative genetic gain averaged across strategies indicated in black on the right Y axis. Error bars indicate standard error
Fig. 7
Fig. 7
Comparison of five breeding strategies in terms of genetic gain over 10 cycles of selection averaged across 50 runs in a closed system. Selection for white mold tolerance was simulated with increasing numbers of initial parents displayed on the right and differing breeding frameworks shown at the top. Breeding strategies include mass selection, bulk breeding, single seed descent, pedigree method, modified pedigree method. Cumulative genetic gain averaged across strategies indicated in black on the right Y axis. Error bars indicate standard error
Fig. 8
Fig. 8
Comparison of five breeding strategies in terms of genetic gain over 10 cycles of selection averaged across 50 runs in a closed system. Selection for seed yield was simulated with increasing numbers of initial parents displayed on the right and differing breeding frameworks shown at the top. Breeding strategies include mass selection, bulk breeding, single seed descent, pedigree method, modified pedigree method. Cumulative genetic gain averaged across strategies indicated in black on the right Y axis. Error bars indicate standard error
Fig. 9
Fig. 9
Comparison of five breeding strategies in terms of number of cycles until 95% cumulative of genetic gain for 10 cycles averaged over 50 runs in a closed system. Selected traits include days to flowering (DF), white mold tolerance (WM), and seed yield (SY). Increasing numbers of initial parents displayed on the top along with different breeding frameworks. Breeding frameworks include conventional breeding (CV), speed breeding (SB), and genomic selection (GS). Colored bars represent the breeding strategies, which include mass selection, bulk breeding, single seed descent, pedigree method, and modified pedigree method. Error bars indicate standard error
Fig. 10
Fig. 10
Comparison of five breeding strategies in terms of relative genetic gain per cycle across 10 cycles averaged over 50 runs in a closed system. Selected traits include days to flowering (DF), white mold tolerance (WM), and seed yield (SY). Increasing numbers of initial parents displayed on the top along with different breeding frameworks. Breeding frameworks include conventional breeding (CV), speed breeding (SB), and genomic selection (GS). Colored bars represent the breeding strategies, which include mass selection, bulk breeding, single seed descent, pedigree method, and modified pedigree method. Error bars indicate standard error. Values above bars indicate the total cumulative genetic gain (%) at the end of the simulation
Fig. 11
Fig. 11
Principal component analysis (PCA) plot of genetic gain across five breeding strategies, three breeding frameworks and four initial parent population sizes. (a) Days to flowering, (b) white mold tolerance and (c) seed yield were selected in simulated populations with increasing parental population sizes represented by different shapes. Breeding strategies include mass selection, bulk breeding, single seed descent, pedigree method, and modified pedigree method, and are distinguished by color. Vectors specify the direction and strength of genetic gain variables. The first two principal axes explained 75.1% of the variance

References

    1. Acquaah G. Principles of plant genetics and breeding. Wiley; 2009.
    1. Adams M. Basis of yield component compensation in crop plants with special reference to the field bean, Phaseolus vulgaris 1. Crop Sci. 1967;7:505–510. doi: 10.2135/cropsci1967.0011183X000700050030x. - DOI
    1. Ali M, Zhang L, DeLacy I, Arief V, Dieters M, Pfeiffer WH, Wang J, Li H. Modeling and simulation of recurrent phenotypic and genomic selections in plant breeding under the presence of epistasis. The Crop Journal. 2020;8:866–877. doi: 10.1016/j.cj.2020.04.002. - DOI
    1. Atuahene-Amankwa G, Beatie AD, Michaels TE, Falk DE. Cropping system evaluation and selection of common bean genotypes for a maize/bean intercrop. Afr Crop Sci J. 2004;12:105–113. doi: 10.4314/acsj.v12i2.27668. - DOI
    1. Beaver JS, Osorno JM. Achievements and limitations of contemporary common bean breeding using conventional and molecular approaches. Euphytica. 2009;168:145–175. doi: 10.1007/s10681-009-9911-x. - DOI