. 2023 Jan 31;42(1):111992.
doi: 10.1016/j.celrep.2023.111992. Epub 2023 Jan 19.

A chromosome-level reference genome and pangenome for barn swallow population genomics

Affiliations

A chromosome-level reference genome and pangenome for barn swallow population genomics

Simona Secomandi et al. Cell Rep. .

Abstract

Insights into the evolution of non-model organisms are limited by the lack of reference genomes of high accuracy, completeness, and contiguity. Here, we present a chromosome-level, karyotype-validated reference genome and pangenome for the barn swallow (Hirundo rustica). We complement these resources with a reference-free multialignment of the reference genome with other bird genomes and with the most comprehensive catalog of genetic markers for the barn swallow. We identify potentially conserved and accelerated genes using the multialignment and estimate genome-wide linkage disequilibrium using the catalog. We use the pangenome to infer core and accessory genes and to detect variants using it as a reference. Overall, these resources will foster population genomics studies in the barn swallow, enable detection of candidate genes in comparative genomics studies, and help reduce bias toward a single reference genome.

Keywords: CP: Molecular biology; barn swallow; comparative genomics; genetic marker catalog; genome assembly; linkage disequilibrium; pangenome graph; pangenomics; population genomics; reference genome; synanthropy.


Conflict of interest statement

Declaration of interests D.S. and K.W. are full-time employees at Pacific Biosciences, a company commercializing single-molecule sequencing technologies.

Figures

Figure 1.
Figure 1.. A de novo chromosome-level reference genome for the barn swallow
(A) Flowchart of the VGP assembly pipeline 1.6 (redrawn from Rhie et al.). (B) Genomescope2.0 k-mer profile for bHirRus1 generated from trimmed 10x Linked-Reads, used to estimate genome size, repetitiveness, and heterozygosity (top). The x axis represents multiplicity in the read set, while the y axis represents their cumulative frequency. (C) Merqury spectra-cn plots for bHirRus1. K-mer multiplicity in the 10x Linked-Reads (x axis) versus their frequency (y axis). Colored curves discriminate k-mer occurrences in the assembly. The bar at the origin of the graph represents k-mers found only in the assembly (assembly errors). Two frequency peaks are visible: a haploid peak at ~25× coverage (half average coverage, red), representing k-mers found once in the assembly (haplotype specific), and a diploid peak at ~50× (average coverage, blue) representing k-mers found twice in the assembly (shared between haplotypes). No k-mers resulting from artificial duplications (green, purple, yellow) are visible (duplication content 0.49%; Table S1). (D) Hi-C interaction heatmaps for the curated bHirRus1 assembly. The linear sequence of the reference genome assembly is represented on both axes, and the diagonal shows 3D proximity of interacting pairs. The strength of the interaction is given by color intensity. A scaffold is considered a full chromosome when the number of interchromosomal interactions is negligible. No off-diagonal interactions are visible. Scaffolds are labeled by their chromosome number. (E) Hi-C interaction heatmaps for bHirRus1 assembly before curation. A number of off-diagonal interactions are still visible, which can either result from missing links between scaffolds of the same chromosome or from misassembly. (F) Hi-C interaction heatmaps for Chelidonia assembly. The assembly is still substantially fragmented, with several off-diagonal Hi-C interactions. (G) Snail plots and assembly summary statistics. The main plot is divided into 1,000 size-ordered bins around the circumference. Scaffold length distribution is shown in dark gray with the plot radius scaled to the longest scaffold (red). Orange and pale orange arcs show scaffold N50 and N90, respectively. The pale gray spiral shows the cumulative scaffold count on a log scale, with white scale lines showing successive orders of magnitude. The blue and pale blue areas around the plot show the GC, AT, and N content in the same bins as the inner plot. Top plot: bHirRus1 snail plot. Bottom plot: Chelidonia snail plot. The table summarizes the assembly summary statistics and BUSCO results (vertebrata_odb10) of Chelidonia and bHirRus1. (H) Dotplot alignment of bHirRus1 (blue) and Chelidonia (red) with the VGP chicken assembly GRCg7b. Chromosome numbers and coordinates are reported for GRCg7b (x axis), Chelidonia (y axis, red), and bHirRus1 (y axis, blue). Black vertical lines, red horizontal lines, and blue dashed horizontal lines define chromosome and scaffold boundaries in the chicken assembly, in Chelidonia, and in bHirRus1, respectively. See also Figure S10 and Table S1.
Figure 2.
Figure 2.. Karyotype reconstruction and reference genome chromosome characteristics
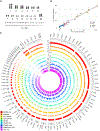
(A) 4 ′,6-diamidino-2-phenylindole (DAPI)-stained karyotype of a male H. r. rustica individual (inverted colors). (B) Correlation between assembled chromosome length (x) and the estimated chromosome length from karyotype images (y). The W sex chromosome is absent due to the sex of the karyotyped sample. (C) Circular representation of bHirRus1 chromosomes. All data are plotted using 200 kbp windows, and the highest values were capped at the 99% percentile value for visualization whenever necessary (marked with +). PacBio long-read coverage (a); percentage of repeat density (b); percentage of GC (c); CpG island density (d); gene density (e); phyloP accelerated site density (f); phyloP conserved site density (g); phastCons conserved element (CE) density (h); and coverage of bHirRus1 in the Cactus HAL alignment (i). See also Figures S2 and S3 and Tables S2, S3, S5, and S6.
Figure 3.
Figure 3.. Sampling locations and SNP density per chromosome
(A) Sampling locations of all individuals used to generate the SNP catalog. Purple, fuchsia, and light blue colors indicate sampling locations in common between datasets indicated in the legend. Sampling locations from ds2 are plotted with a different shape (cross) to distinguish them from black points (ds4), as some sampling locations partially overlap on the map. Data of populations of ds2 through ds6 are from publicly available genomic data. (B) Only macrochromosomes and intermediate chromosomes are shown. Microchromosomes are shown in Figure S5. SNP density was computed over 40 kbp windows. Numbers on the y axis of each density track indicate the maximum and average values of SNP density for each track. Genomic data types are color coded. Light blue: HiFi WGS data (ds1). Dark blue: Illumina WGS data from ds2 and ds3.1. Red: Illumina ddRAD data from ds3.2 through ds6.8. All available samples from the same sequencing technology were considered together. Additional tracks in the bottom panel show repetitive regions of the genome (violet bars; only regions larger than 3 kbp are plotted), GC content, and PacBio reads coverage. Gray ideograms represent chromosomes in scale, with assembly gaps highlighted as black bars. See also Figures S5 and S6 and Tables S11, S12, and S13.
Figure 4.
Figure 4.. Linkage disequilibrium decay in the barn swallow genome
(A) Average r2 values plotted against physical distance (kbp) for the different populations belonging to ds2 and ds3.1 (Illumina WGS data). (B) Average r2 values in macrochromosomes, intermediate chromosomes, and microchromosomes according to pairwise distance (kbp) between SNPs. LD median estimates were obtained averaging values from all Illumina WGS data populations (ds2 and ds3.1). See also Figure S9 and Tables S14 and S15.
Figure 5.
Figure 5.. The first pangenome for the barn swallow
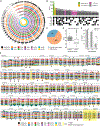
(A) Circos plot showing the annotated genes of bHirRus1p (primary assembly) and orthologs found in bHirRus1a (alternate assembly) and the HiFi-based haplotypes. (B) Histogram reporting presence or absence of bHirRus1 genes in the other individuals of the pangenome (primary and alternate assemblies combined). Green: genes shared by all individuals. Yellow: genes exclusive to bHirRus1. Fuchsia: genes shared between bHirRus1 and another individual. Gray: genes shared between bHirRus1 and 2 or more individuals. (C) Pie chart reporting the 234 genes exclusive of bHirRus1, i.e., missing from all the other genome assemblies in the pangenome. 79 genes were identified in the HiFi raw reads (light blue), while 155 genes could not be found in either HiFi-based assemblies or HiFi raw reads. (D) Boxplot representing the GC content among the 155 missing genes from both HiFi assemblies and raw reads (gray) vs. all other bHirRus1 genes (white, found in at least 1 HiFi individual). (E) Barplot reporting the percentage of 128 bp windows with >50% dinucleotide content in the 155 genes (gray) vs. all other genes (white). The Chi-square analyses were associated with a p value < 0.0001. (F) Extract of the entire camk2n2 sequence obtained from the pangenome graph (chromosome 10, 17,272,192–17,276,215 bp). The colored tubes represent the assembled haplotypes included in the pangenome. bHirRus1 Chr10 (‘‘bHirRus1p,’’ black) is shown together with the alternate assembly ‘‘bHirRus1a,’’ the five HiFi-based primary assemblies (Hr2p, Hr3p, Hr4p, HrA1p, HrA2p), and their alternate assemblies (Hr2a, Hr3a, Hr4a, HrA1a, HrA2a). CDSs are highlighted with transparent yellow boxes. SNPs are marked with black asterisks. SNPs found with the pangenome, but not detected with the standard variant calling approach, are circled in red. See also Figures S4 and S7 and Tables S11, S16, S17, S18, and S19.

References

    1. Spina F (1998). The EURING swallow project: a large-scale approach to the study and conservation of a long-distance migrant. Migrating birds know no boundaries. Proc. Int. Symp. Isr. Torgos 28, 151–162.
    1. Smith CCR, Flaxman SM, Scordato ESC, Kane NC, Hund AK, Sheta BM, et al. (2018). Demographic inference in barn swallows using whole-genome data shows signal for bottleneck and subspecies differentiation during the Holocene. Mol. Ecol 27, 4200–4212. 10.1111/mec.14854. - DOI - PubMed
    1. Lombardo G, Rambaldi Migliore N, Colombo G, Capodiferro MR, Formenti G, Caprioli M, et al. (2022). The mitogenome relationships and phylogeography of barn swallows (Hirundo rustica). Mol. Biol. Evol 39, msac113. 10.1093/molbev/msac113. - DOI - PMC - PubMed
    1. Johnston RF (2001). Synanthropic birds of North America. In Avian Ecology and Conservation in an Urbanizing World, Marzluff JM, Bowman R, and Donnelly R, eds. (Springer US; ), pp. 49–67. 10.1007/978-1-4615-1531-9_3. - DOI
    1. Krajcarz M, Krajcarz MT, Baca M, Baumann C, Van Neer W, Popović D, Sudo1-Procyk M, Wach B, Wilczyński J, Wojenka M, et al. (2020). Ancestors of domestic cats in Neolithic Central Europe: Isotopic evidence of a synanthropic diet. Proc. Natl. Acad. Sci. USA 117, 17710–17719. 10.1073/pnas.1918884117. - DOI - PMC - PubMed

Publication types