. 2023 Apr 4;83(7):983-996.
doi: 10.1158/0008-5472.CAN-22-2129.

SWI/SNF Blockade Disrupts PU.1-Directed Enhancer Programs in Normal Hematopoietic Cells and Acute Myeloid Leukemia

Affiliations

SWI/SNF Blockade Disrupts PU.1-Directed Enhancer Programs in Normal Hematopoietic Cells and Acute Myeloid Leukemia

Courtney Chambers et al. Cancer Res. .

Abstract

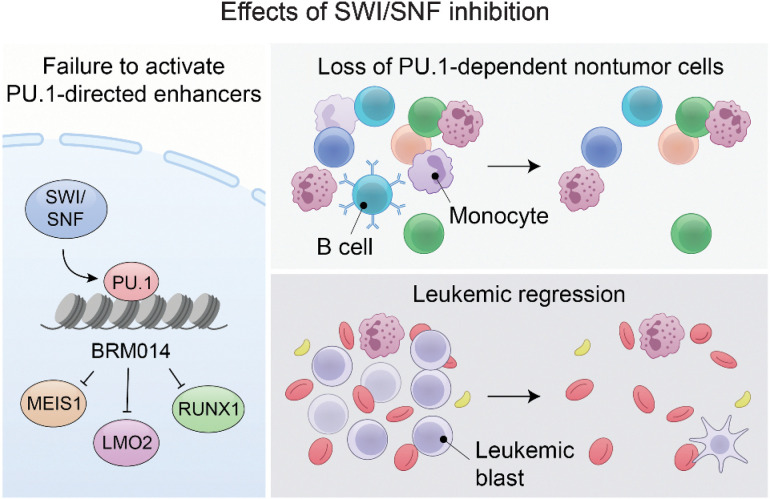
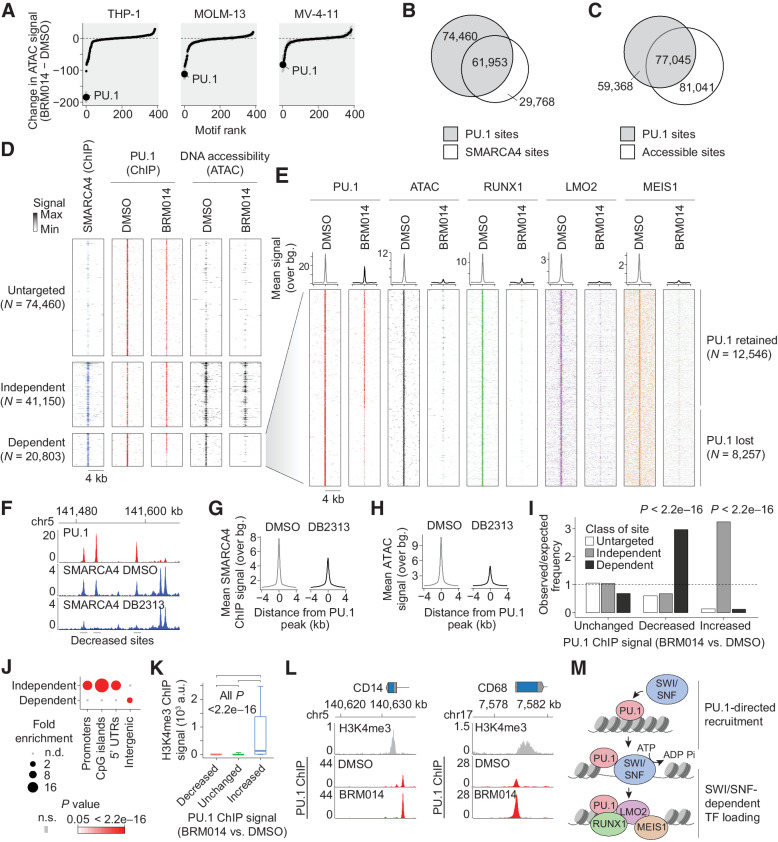
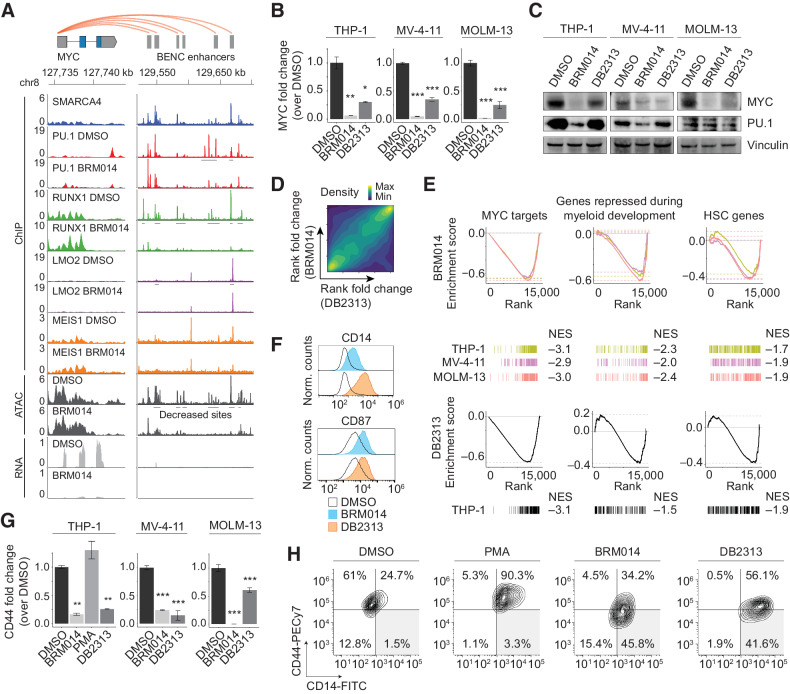
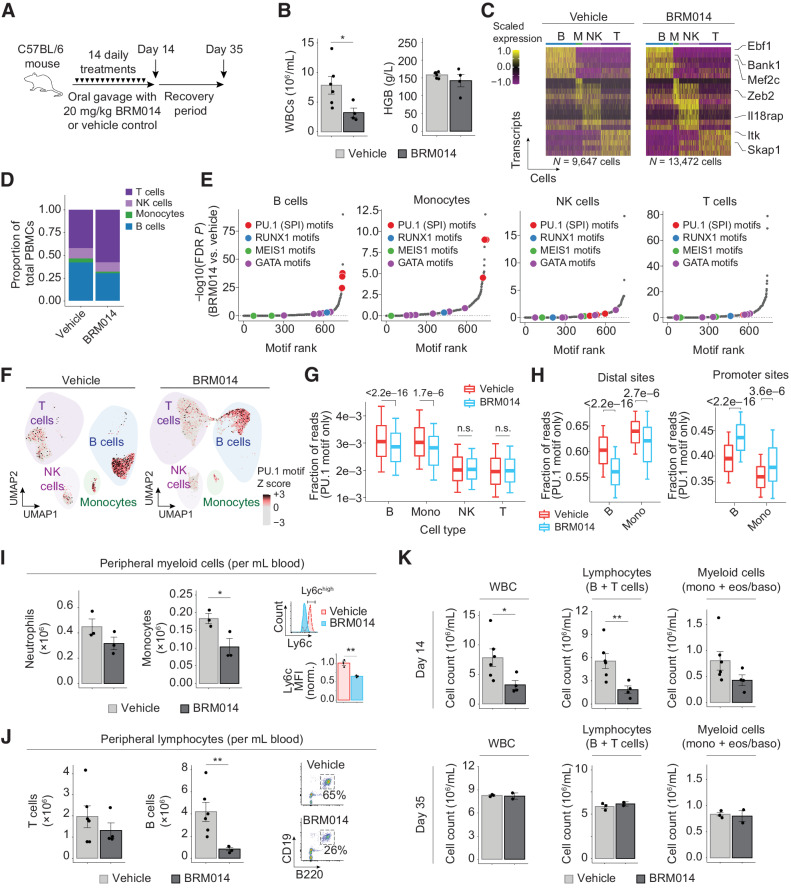
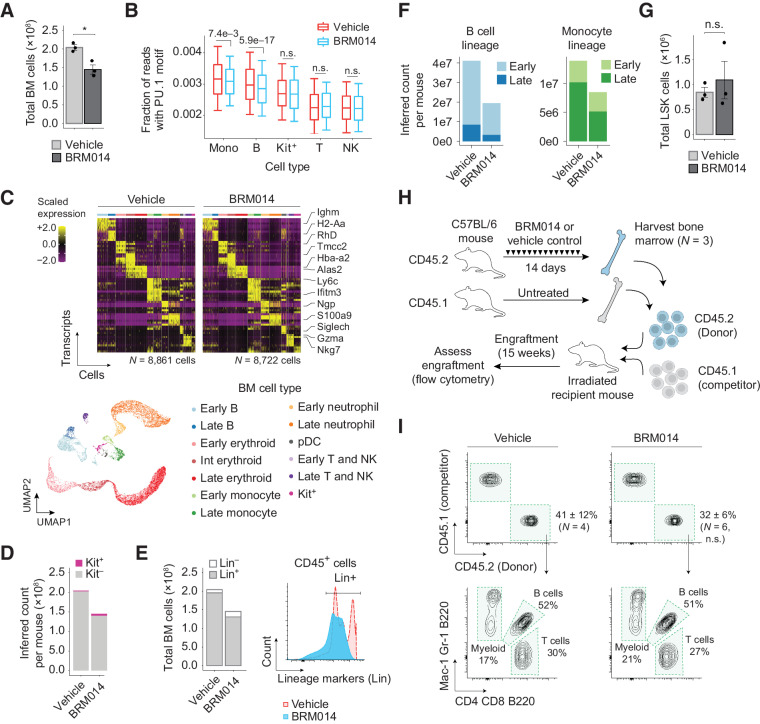
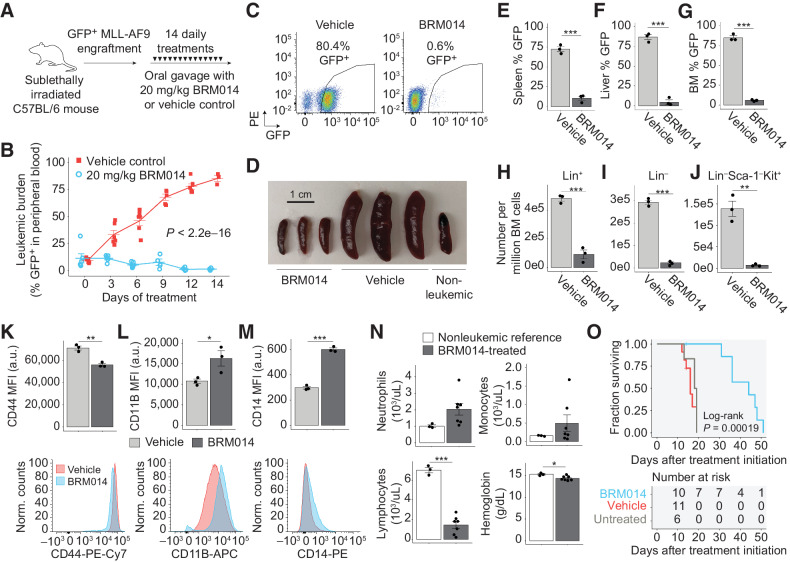
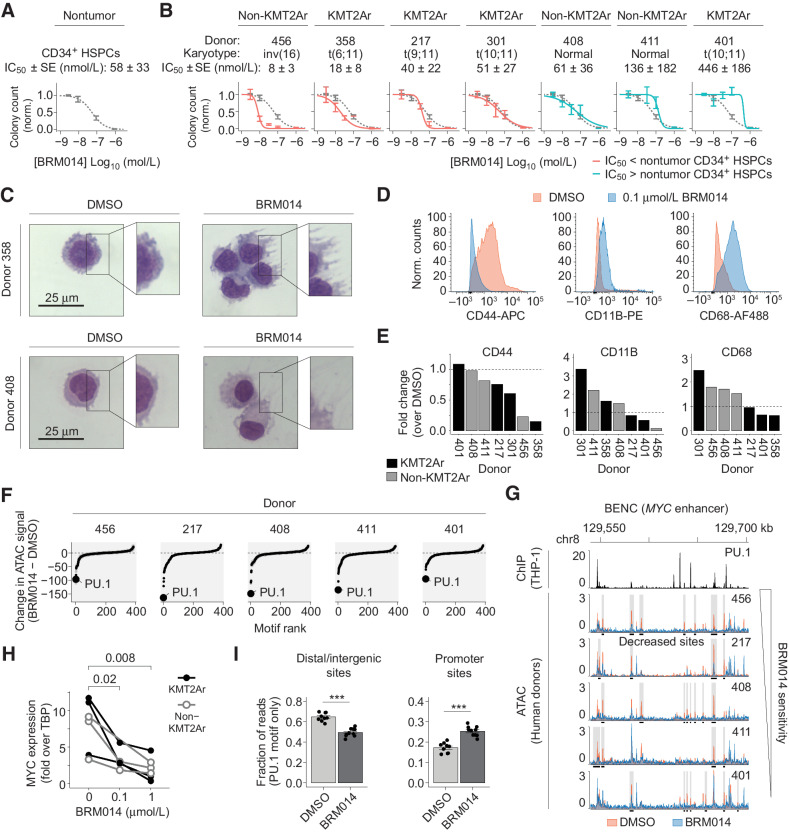
In acute myeloid leukemia (AML), SWI/SNF chromatin remodeling complexes sustain leukemic identity by driving high levels of MYC. Previous studies have implicated the hematopoietic transcription factor PU.1 (SPI1) as an important target of SWI/SNF inhibition, but PU.1 is widely regarded to have pioneer-like activity. As a result, many questions have remained regarding the interplay between PU.1 and SWI/SNF in AML as well as normal hematopoiesis. Here we found that PU.1 binds to most of its targets in a SWI/SNF-independent manner and recruits SWI/SNF to promote accessibility for other AML core regulatory factors, including RUNX1, LMO2, and MEIS1. SWI/SNF inhibition in AML cells reduced DNA accessibility and binding of these factors at PU.1 sites and redistributed PU.1 to promoters. Analysis of nontumor hematopoietic cells revealed that similar effects also impair PU.1-dependent B-cell and monocyte populations. Nevertheless, SWI/SNF inhibition induced profound therapeutic response in an immunocompetent AML mouse model as well as in primary human AML samples. In vivo, SWI/SNF inhibition promoted leukemic differentiation and reduced the leukemic stem cell burden in bone marrow but also induced leukopenia. These results reveal a variable therapeutic window for SWI/SNF blockade in AML and highlight important off-tumor effects of such therapies in immunocompetent settings.

Significance: Disruption of PU.1-directed enhancer programs upon SWI/SNF inhibition causes differentiation of AML cells and induces leukopenia of PU.1-dependent B cells and monocytes, revealing the on- and off-tumor effects of SWI/SNF blockade.


Figures

None
Graphical abstract
Figure 1. SWI/SNF-mediated chromatin remodeling is required for PU.1-directed binding of AML CRC members. A, Ranking of differential TF motif accessibility in AML cell lines treated with 1 μmol/L BRM014 versus DMSO control. B, Overlap of PU.1 and SMARCA4 binding in THP-1 cells. C, Overlap of PU.1 binding and DNA accessibility in THP-1 cells. D, SMARCA4 occupancy and DNA accessibility at PU.1 sites in THP-1 cells treated with BRM014 or DMSO control. E, Binding of AML central regulatory circuit factors RUNX1, LMO2, and MEIS1 at SWI/SNF-dependent PU.1 sites. F, Representative browser track of SMARCA4 binding at PU.1 sites upon DB2313 treatment. G, SMARCA4 binding and (H) chromatin accessibility at PU.1 sites in THP-1 cells treated with DB2313. I, Enrichment of SWI/SNF independent, dependent, and untargeted sites at each class of PU.1 site based on altered PU.1 binding upon treatment with BRM014. Increased, decreased, and unchanged peaks in I and K correspond to PU.1 ChIP-seq changes regardless of any other feature. J, Enrichment of genomic features among SWI/SNF-dependent and -independent sites. K, H3K4me3 signal at sites with decreased, increased, or unchanged PU.1 occupancy upon BRM014 treatment. Box plot error bars indicate 10%ile and 90%ile range. L, PU.1 occupancy at the promoters of differentiation-related genes in BRM014- and DMSO-treated cells. M, Model of PU.1-directed recruitment of SWI/SNF to enhancer sites.
Figure 1.
SWI/SNF-mediated chromatin remodeling is required for PU.1-directed binding of AML CRC members. A, Ranking of differential TF motif accessibility in AML cell lines treated with 1 μmol/L BRM014 versus DMSO control. B, Overlap of PU.1 and SMARCA4 binding in THP-1 cells. C, Overlap of PU.1 binding and DNA accessibility in THP-1 cells. D, SMARCA4 occupancy and DNA accessibility at PU.1 sites in THP-1 cells treated with BRM014 or DMSO control. E, Binding of AML CRC factors RUNX1, LMO2, and MEIS1 at SWI/SNF-dependent PU.1 sites. F, Representative browser track of SMARCA4 binding at PU.1 sites upon DB2313 treatment. G and H, SMARCA4 binding (G) and chromatin accessibility (H) at PU.1 sites in THP-1 cells treated with DB2313. I, Enrichment of SWI/SNF-independent, -dependent, and untargeted sites at each class of PU.1 site based on altered PU.1 binding upon treatment with BRM014. Increased, decreased, and unchanged peaks in I and K correspond to PU.1 ChIP-seq changes regardless of any other feature. J, Enrichment of genomic features among SWI/SNF-dependent and -independent sites. K, H3K4me3 signal at sites with decreased, increased, or unchanged PU.1 occupancy upon BRM014 treatment. Box plot error bars indicate 10 percentile and 90 percentile range. L, PU.1 occupancy at the promoters of differentiation-related genes in BRM014- and DMSO-treated cells. M, Model of PU.1-directed recruitment of SWI/SNF to enhancer sites.
Figure 2. Collaborative regulation of the BENC module underlies convergent differentiation induced by SWI/SNF or PU.1 inhibition in AML. A, Overlay of SMARCA4, PU.1, RUNX1, LMO2, and MEIS1 occupancy with ATAC-seq and RNA-seq data at MYC and BENC in THP-1 cells. Other cell lines presented in Supplementary Figs. S3A and S3B. Expression of MYC and PU.1 in AML cells lines treated with BRM014 or DB2313 by (B) RNA-seq (THP-1) or RT-qPCR (MV-4–11 and MOLM-13) at 72 hours, N = 3, and (C) Western blot analysis at 24 hours of treatment. D, Genome-wide correlation of BRM014- and DB2313-induced transcriptional changes in THP-1 cells based on RNA-seq. E, Gene sets downregulated upon BRM014 and DB2313 treatment. Normalized enrichment scores (NES) are indicated. F, Cell surface expression of myeloid differentiation markers CD14 and CD87 in cells treated with DMSO, BRM014, or DB2313. G, Expression of CD44 in cells treated with DMSO, BRM014, DB2313, or PMA measured by RNA-seq (THP-1) or RT-qPCR (MV-4–11 and MOLM-13) at 72 hours, N = 3. H, Expression of CD14 and CD44 in cells treated with DMSO, BRM014, DB2313, or PMA measured by flow cytometry. Error bars: mean ± SEM; *, P < 0.05; **, P < 0.01; ***, P < 0.001.
Figure 2.
Collaborative regulation of the BENC module underlies convergent differentiation induced by SWI/SNF or PU.1 inhibition in AML. A, Overlay of SMARCA4, PU.1, RUNX1, LMO2, and MEIS1 occupancy with ATAC-seq and RNA-seq data at MYC and BENC in THP-1 cells. Other cell lines are presented in Supplementary Figs. S3A and S3B. B and C, Expression of MYC and PU.1 in AML cells lines treated with BRM014 or DB2313 by RNA-seq (THP-1) or RT-qPCR (MV-4–11 and MOLM-13) at 72 hours (N = 3; B) and Western blot analysis at 24 hours of treatment (C). D, Genome-wide correlation of BRM014- and DB2313-induced transcriptional changes in THP-1 cells based on RNA-seq. E, Gene sets downregulated upon BRM014 and DB2313 treatment. Normalized enrichment scores (NES) are indicated. F, Cell surface expression of myeloid differentiation markers CD14 and CD87 in cells treated with DMSO, BRM014, or DB2313. G, Expression of CD44 in cells treated with DMSO, BRM014, DB2313, or PMA measured by RNA-seq (THP-1) or RT-qPCR (MV-4–11 and MOLM-13) at 72 hours (N = 3). H, Expression of CD14 and CD44 in cells treated with DMSO, BRM014, DB2313, or PMA measured by flow cytometry. Error bars, mean ± SEM. *, P < 0.05; **, P < 0.01; ***, P < 0.001.
Figure 3. SWI/SNF inhibition induces reversible leukopenia in PU.1-dependent nontumor peripheral blood lineages. A, Dosing scheme for in vivo treatment of healthy mice. B, WBC and hemoglobin (HGB) levels in peripheral blood at day 14, N = 6 (vehicle), N = 4 (BRM014). C, Cell-type-specific transcriptional profiles are unchanged by treatment, enabling consistent classification. D, Composition of nongranulocyte immune cell types in the peripheral blood of BRM014- and DMSO-treated mice. E, Ranking of significantly reduced differential TF motif accessibility by immune population from mice treated with BRM014 versus vehicle control. F, UMAP embedding of individual cells by snATAC profile with overlayed PU.1 motif accessibility. G, Quantification of accessible PU.1 motifs across specific cell types. H, Shifts of accessible DNA sites containing PU.1 motifs in B cells and monocytes upon BRM014 treatment. I, Total number of peripheral neutrophils and monocytes at day 14, and Ly6c expression in circulating monocytes, N = 3 per condition. J, Total number of T and B cells at day 14, with B-cell gating strategy, N = 6 (vehicle), N = 4 (BRM014). K, Total WBC, lymphocyte, and myeloid cell counts at day 14 and day 35 (3 weeks posttreatment) measured by CBC. Day 14 N = 6 (vehicle), N = 4 (BRM014), and day 35 N = 3 (vehicle), N = 2 (BRM014). Error bars: mean ± SEM; *, P < 0.05; **, P < 0.01; ***, P < 0.001.
Figure 3.
SWI/SNF inhibition induces reversible leukopenia in PU.1-dependent nontumor peripheral blood lineages. A, Dosing scheme for in vivo treatment of healthy mice. B, WBC and hemoglobin (HGB) levels in peripheral blood at day 14. N = 6, vehicle; N = 4, BRM014. C, Cell type–specific transcriptional markers were unchanged by treatment, enabling consistent classification. D, Composition of nongranulocyte immune cell types in the peripheral blood of BRM014- and DMSO-treated mice. E, Ranking of significantly reduced differential TF motif accessibility by immune population from mice treated with BRM014 versus vehicle control. F, UMAP embedding of individual cells by snATAC profile, with overlayed PU.1 motif accessibility. G, Quantification of accessible PU.1 motifs across specific cell types. H, Shifts of accessible DNA sites containing PU.1 motifs in B cells and monocytes upon BRM014 treatment. I, Total number of peripheral neutrophils and monocytes at day 14 and Ly6c expression in circulating monocytes. N = 3 per condition. J, Total number of T and B cells at day 14, with B-cell gating strategy. N = 6, vehicle; N = 4, BRM014. K, Total WBC, lymphocyte, and myeloid cell counts at day 14 and day 35 (3 weeks posttreatment) measured by CBC. Day 14, N = 6 (vehicle) and N = 4 (BRM014). Day 35, N = 3 (vehicle) and N = 2 (BRM014). Error bars, mean ± SEM; *, P < 0.05; **, P < 0.01; n.s., nonsignificant.
Figure 4. Transient SWI/SNF inhibition depletes committed hematopoietic cells in BM but preserves HSC function. A, Total number of cells isolated from BM of BRM014- and vehicle-treated mice at day 14, N = 3 per condition. B, Quantification of accessible PU.1 motifs across specific BM cell types. M = monocytes, B = B cells, Kit+ = Kit+ progenitors, T = T cells, NK = NK cells. C, Cell-type-specific transcriptional profiles are unchanged by treatment, enabling consistent classification. UMAP embedding of individual cells pooled from all conditions. Resulting clusters are classified by immune cell type based on cell-specific expression profiles. D, Inferred total number of HSPC Kit+ and lineage committed Kit– cells determined by scRNA-seq. E, Flow cytometry quantification and histogram of lineage-committed (CD3, CD8, B220, GR1, TER119) and uncommitted CD45+ BM cells. F, Inferred total number of B cell and monocyte populations in BM determined by scRNA-seq. G, Total number of LSK (Lin–Sca-1+Kit+) HSPCs in BM by flow cytometry, N = 3 per condition. H, Competitive HSCT workflow and (I) representative flow plots of HSC engraftment and recapitulation of major hematopoietic lineages. N = 4 (vehicle), N = 6 (BRM014). Error bars: mean ± SEM.
Figure 4.
Transient SWI/SNF inhibition depletes committed hematopoietic cells in BM but preserves HSC function. A, Total number of cells isolated from BM of BRM014- and vehicle-treated mice at day 14. N = 3 per condition. B, Quantification of accessible PU.1 motifs across specific BM cell types. M, monocytes; B, B cells; Kit+, Kit+ progenitors; T, T cells; NK, NK cells. C, Cell type–specific transcriptional markers were unchanged by treatment, enabling consistent classification. UMAP embedding of individual cells pooled from all conditions. Resulting clusters are classified by immune cell type based on cell-specific expression profiles. D, Inferred total number of HSPC Kit+ and lineage-committed Kit cells determined by scRNA-seq. E, Flow cytometry quantification and histogram of lineage-committed (CD3, CD8, B220, GR1, TER119) and uncommitted CD45+ BM cells. F, Inferred total number of B cell and monocyte populations in BM determined by scRNA-seq. G, Total number of LSK (LinSca-1+Kit+) HSPCs in BM by flow cytometry. N = 3 per condition. H and I, Competitive HSCT workflow (H) and representative flow plots (I) of HSC engraftment and recapitulation of major hematopoietic lineages. N = 4, vehicle; N = 6, BRM014. Error bars, mean ± SEM. n.s., nonsignificant.
Figure 5. SWI/SNF inhibition has a significant therapeutic window against AML in an immunocompetent setting. A, Dosing scheme for in vivo treatment of MLL-AF9 leukemia with BRM014 or vehicle control. B, Leukemic burden of mice treated with BRM014 or vehicle control over the two-week treatment period and (C) quantification by flow cytometry, N = 11 (vehicle), N = 10 (BRM014). D, Spleens harvested after 14-days of treatment with BRM014 or vehicle control. Leukemic burden in the (E) spleen, (F) liver, and (G) BM of mice treated with BRM014 or vehicle control, N = 3 per condition. Effect of BRM014 on the number of (H) committed (Lin+), (I) uncommitted (Lin–), and (J) LSC-enriched Lin–Sca-1−Kit+ stem/progenitor cells within the leukemic population in the BM. Cells in H, I, and J were gated on the basis of GFP+ cells, N = 3 per condition. Expression of (K) stemness (CD44) and myeloid differentiation markers (L) CD11B and (M) CD14 on leukemic GFP+ cells in the BM of mice treated with BRM014 or vehicle control, N = 3 per condition. N, CBC neutrophil, monocyte, and lymphocyte counts and hemoglobin levels in BRM014-treated mice versus nonleukemic controls 3 days after completion of treatment course, N = 3 (nonleukemic) and N = 7 (BRM014). O, Survival of MLL-AF9 mice treated with BRM014 or vehicle control, N = 6 (untreated), N = 11 (vehicle), and N = 10 (BRM014). Error bars: mean ± SEM; *, P < 0.05; **, P < 0.01; ***, P < 0.001.
Figure 5.
SWI/SNF inhibition has a significant therapeutic window against AML in an immunocompetent setting. A, Dosing scheme for in vivo treatment of MLL-AF9 leukemia with BRM014 or vehicle control. B and C, Leukemic burden of mice treated with BRM014 or vehicle control over the two-week treatment period (B) and quantification by flow cytometry (C). N = 11, vehicle; N = 10, BRM014. D, Spleens harvested after 14 days of treatment with BRM014 or vehicle control. E–G, Leukemic burden in the spleen (E), liver (F), and BM (G) of mice treated with BRM014 or vehicle control. N = 3 per condition. H–J, Effect of BRM014 on the number of committed (Lin+; H), uncommitted (Lin; I), and LSC-enriched LinSca-1Kit+ stem/progenitor cells (J) within the leukemic population in BM. Cells in H, I, and J were gated on the basis of GFP+ cells. N = 3 per condition. K–M, Expression of stemness (CD44; K) and myeloid differentiation markers CD11B (L) and CD14 (M) on leukemic GFP+ cells in the BM of mice treated with BRM014 or vehicle control. N = 3 per condition. N, CBC neutrophil, monocyte, and lymphocyte counts and hemoglobin levels in BRM014-treated mice versus nonleukemic controls 3 days after completion of treatment course. N = 3, nonleukemic; N = 7, BRM014. O, Survival of MLL-AF9 mice treated with BRM014 or vehicle control. N = 6, untreated; N = 11, vehicle; N = 10, BRM014. Error bars, mean ± SEM. *, P < 0.05; **, P < 0.01; ***, P < 0.001.
Figure 6. The relative sensitivity of primary human CD34+ HSPCs and AML specimens defines a therapeutic window for SWI/SNF inhibition. Number of colonies formed by primary human (A) CD34+ HSPCs and (B) AML samples treated with BRM014 or DMSO and IC50 measurements. CD34+ HSPC curves overlayed in B for comparison, N = 3 per sample. C, Representative images of May-Grunwald Giemsa stained primary KMT2Ar and non-KMT2Ar leukemia cells from donor treated with BRM014 or DMSO. D, Representative flow cytometry histograms and (E) quantification of CD44 and myeloid differentiation markers in primary leukemias treated with BRM014 compared with DMSO control. F, Ranking of differential TF motif accessibility in primary AML specimens treated with 1 μmol/L BRM014 versus DMSO control. G, Accessibility at BENC module following treatment with DMSO or 1 μmol/L BRM014. H, MYC expression after treatment with BRM014 or DMSO measured by RT-qPCR. I, Quantification of accessible PU.1 motifs at intergenic and promoter sites in primary AML specimens treated with 1 μmol/L BRM014 or DMSO, N = 5 independent specimens with replicates. Error bars: mean ± SEM; *, P < 0.05; **, P < 0.01; ***, P < 0.001.
Figure 6.
The relative sensitivity of primary human CD34+ HSPCs and AML specimens defines a therapeutic window for SWI/SNF inhibition. A and B, Number of colonies formed by primary human CD34+ HSPCs (A) and AML samples (B) treated with BRM014 or DMSO and IC50 measurements. CD34+ HSPC curves overlayed in B for comparison. N = 3 per sample. C, Representative images of May-Grunwald Giemsa–stained primary KMT2Ar and non-KMT2Ar leukemia cells from donors treated with BRM014 or DMSO. D and E, Representative flow cytometry histograms (D) and quantification (E) of CD44 and myeloid differentiation markers in primary leukemias treated with BRM014 compared with DMSO control. F, Ranking of differential TF motif accessibility in primary AML specimens treated with 1 μmol/L BRM014 versus DMSO control. G, Accessibility at BENC module following treatment with DMSO or 1 μmol/L BRM014. H,MYC expression after treatment with BRM014 or DMSO measured by RT-qPCR. I, Quantification of accessible PU.1 motifs at intergenic and promoter sites in primary AML specimens treated with 1 μmol/L BRM014 or DMSO. N = 5 independent specimens with replicates. Error bars, mean ± SEM. ***, P < 0.001.

References

    1. de Kouchkovsky I, Abdul-Hay M. ‘Acute myeloid leukemia: a comprehensive review and 2016 update.’ Blood Cancer J 2016;6:e441. - PMC - PubMed
    1. Lonetti A, Pession A, Masetti R. Targeted therapies for pediatric AML: gaps and perspective. Front Pediatr 2019;7:463. - PMC - PubMed
    1. Zwaan CM, Kolb EA, Reinhardt D, Abrahamsson J, Adachi S, Aplenc R, et al. Collaborative efforts driving progress in pediatric acute myeloid leukemia. J Clin Oncol 2015;33:2949. - PMC - PubMed
    1. Rosenbauer F, Tenen DG. Transcription factors in myeloid development: balancing differentiation with transformation. Nat Rev Immunol 2007;7:105–17. - PubMed
    1. Chen Y, Xu L, Lin RYT, Müschen M, Koeffler HP. Core transcriptional regulatory circuitries in cancer. Oncogene 2020;39:6633–46. - PMC - PubMed

Publication types