. 2023 Jan 20;18(1):e0280693.
doi: 10.1371/journal.pone.0280693. eCollection 2023.

A single-molecule method for measuring fluorophore labeling yields for the study of membrane protein oligomerization in membranes

Affiliations

A single-molecule method for measuring fluorophore labeling yields for the study of membrane protein oligomerization in membranes

Melanie Ernst et al. PLoS One. .

Abstract

Membrane proteins are often observed as higher-order oligomers, and in some cases in multiple stoichiometric forms, raising the question of whether dynamic oligomerization can be linked to modulation of function. To better understand this potential regulatory mechanism, there is an ongoing effort to quantify equilibrium reactions of membrane protein oligomerization directly in membranes. Single-molecule photobleaching analysis is particularly useful for this as it provides a binary readout of fluorophores attached to protein subunits at dilute conditions. However, any quantification of stoichiometry also critically requires knowing the probability that a subunit is fluorescently labeled. Since labeling uncertainty is often unavoidable, we developed an approach to estimate labeling yields using the photobleaching probability distribution of an intrinsic dimeric control. By iterative fitting of an experimental dimeric photobleaching probability distribution to an expected dimer model, we estimate the fluorophore labeling yields and find agreement with direct measurements of labeling of the purified protein by UV-VIS absorbance before reconstitution. Using this labeling prediction, similar estimation methods are applied to determine the dissociation constant of reactive CLC-ec1 dimerization constructs without prior knowledge of the fluorophore labeling yield. Finally, we estimate the operational range of subunit labeling yields that allows for discrimination of monomer and dimer populations across the reactive range of mole fraction densities. Thus, our study maps out a practical method for quantifying fluorophore labeling directly from single-molecule photobleaching data, improving the ability to quantify reactive membrane protein stoichiometry in membranes.


Conflict of interest statement

The authors have declared that no competing interests exist.

Figures

Fig 1
Fig 1. Expected photobleaching probabilities for monomers and dimers at the single-molecule limit.
(A) The equilibrium dimerization reaction of two CLC-ec1 monomers (2M) forming a dimer (D) in the cellular membrane. In the labeling model, we consider that there is a high probability of labeling at an exposed cysteine site (Psite) and a lower probability of non-specific labeling contributing to the background (Pbg), which is measured in the protein sample without the cysteine. Experimentally the total labeling yield per subunit is measured, Pfluor = Psite + Pbg for each protein sample. (B) Photobleaching of the fluorophores attached to the protein happens in a step wise fashion when imaged using a TIRF setup. (C) The monomeric and dimeric photobleaching probability distributions for labeling yields with Pbg = 0.1, and total Pfluor varied from 0.4 to 1.0, at a single-molecule density of χrec. = 1 x 10⁻⁶ subunits/lipid, i.e. << 1 protein species per liposome. Data reported as mean ± SE, for n = 3 simulation replicates. (D) Plot of P1 vs. P2 photobleaching probabilities showing the dependency of the dimer signal on the labeling yield and overall dynamic range between dimer and monomers.
Fig 2
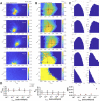
Fig 2. Single-molecule photobleaching estimation of (Pfluor, Pbg) for covalently cross-linked CLC-ec1 dimers across a wide range of protein densities.
(A) Heatmaps of the inverse normalized sum of squared residuals (Norm. SSR-1) over the fluorophore labeling parameter space of (Pfluor, Pbg). The experimental photobleaching data used in this analysis are from [25] for the covalently cross-linked R230C/L249C CLC-ec1 dimer, for a single sample (n1) across a 5-magnitude range in mole fraction densities: χ1 = 2 x 10⁻⁹, χ2 = 2 x 10⁻⁸, χ3 = 2 x 10⁻⁷, χ4 = 2 x 10⁻⁶, χ5 = 2 x 10⁻⁵ subunits/lipid. Maximum value, corresponding to the (Pfluor, Pbg) pair that best fits the experimental data is indicated by the red "x". (B) Heatmaps of the probability distribution of the sum of squared residuals, PSSR. (C) Bootstrapping analysis from the PSSR distribution. The sampling number, N, is set to 107. The mode and standard deviation around the mode, σ, from each bootstrapped distribution are marked in panel (B) with the circle and error bars, respectively. (D) Mode ± σ (circle ± error bars) and max values (red "x") of Pfluor and Pbg from the bootstrapping analysis along with SSR values compared to the experimental data.
Fig 3
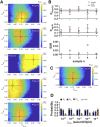
Fig 3. Single-molecule photobleaching estimation of fluorophore labeling recapitulates sample variability.
(A) Heatmap of PSSR over the parameter space of (Pfluor, Pbg) for different experimental samples, n, of the covalently cross-linked R230C/L249C CLC-ec1 dimer. The circle and error bars reflect the mode ± σ from the bootstrapping analysis. (B) The maximum and mode values of Pfluor and Pbg, along with SSR compared to the experimental values, dotted line. (C) Global fit of (Pfluor, Pbg) obtained from pooling experimental data for samples n = 1–5. (D) Experimental photobleaching data (P1, P2, P3+), along with the modeled probability distribution (circles) using (Pfluor, Pbg) = (0.72,0.10) corresponding to the maximum value from the global fit in panel (C).
Fig 4
Fig 4. Estimating KD values for CLC-ec1 dimerization in membranes.
(A) PSSR for dimeric glutaraldehyde cross-linked WT, reactive WT, reactive I422W, ’W’, and monomeric I201W/I422W, ’WW’, as a function of the dissociation constant parameter KD. Curves reflect the model using the experimental labeling parameters (Pfluor, Pbg)expt.—black or the R230C/L249C fitted labeling parameters (Pfluor, Pbg)max—cyan, (Pfluor, Pbg)boot.−red. Dotted line represents the maximum PSSR value and best-fit KD using the (Pfluor, Pbg)max labeling parameters, and the yellow box reflects the uncertainty based on the bootstrapping analysis. (B) Range of photobleaching probability distribution (P1, P2, P3+) simulated using (Pfluor, Pbg)max and KD,boot.—σ, KD,boot., KD,boot. + σ and agreement with experimental data (white circles). (C) ΔG0 for WT and W [20] based on least-squares estimation of FDimer from expected monomer and dimer photobleaching probability distributions compared to the direct fitting of the photobleaching probability distribution while iterating over KD as a parameter. ΔG0 = −RTln(Keqχ°), where Keq = 1/KD and χ° = 1 subunit/lipid represents the mole fraction standard state. Results shown for the best-fit, ’max’, value as well as the mode of the bootstrapping analysis for (Pfluor, Pbg)expt.—grey, compared to the R230C/L249C fitted labeling parameters (Pfluor, Pbg)max—cyan, (Pfluor, Pbg)boot.—red. All data are shown as mean ± SE of fits of independent data sets and statistical significance is calculated via t-test.
Fig 5
Fig 5. The operational range for fluorophore labeling yields.
(A) Chi-squared (χ2) analysis between monomer and dimer model photobleaching probability distributions over (Pfluor, Pbg) fluorophore labeling parameter space for Pbg < Psite = PfluorPbg. χ2 heatmaps are shown for mole fraction densities χ3 = 2 x 10⁻⁷, χ4 = 2 x 10⁻⁶, χ5 = 2 x 10⁻⁵ subunits/lipid. (B) Heatmaps of null hypothesis testing for the χ2 values in (A) for alpha = 0.001 significance. The null hypothesis is that the monomer and dimer distributions are the same, where H = 1 (yellow) indicates a rejection of the null hypothesis, and H = 0 (purple) indicates that the null hypothesis cannot be rejected at the indicated significance level. (C) P1 vs. P2 for monomer (white) and dimer (orange) models for Pfluor = 0.3 to 0.9 and Pbg = 0.1. Symbol size increases with increasing Pfluor with endpoints labelled as shown. Error bars depict representative standard deviation values of the experimental data for RCLC, std = ± 0.06. (D) Maximal scalar distance, Rmax, between (P1, P2) signals from monomer and dimer model distributions as a function of mole fraction density. The background labeling yield is set to Pbg = 0.1. The dotted line indicates Rmax = 0.25 that corresponds to the significance testing cutoff in the χ2 analysis in (B).

References

    1. Sarti E, Aleksandrova AA, Ganta SK, Yavatkar AS, Forrest LR. EncoMPASS: An online database for analyzing structure and symmetry in membrane proteins. Nucleic Acids Res 2019;47:D315–21. doi: 10.1093/nar/gky952 - DOI - PMC - PubMed
    1. Doyle DA, Cabral JM, Pfuetzner RA, Kuo A, Gulbis JM, Cohen SL, et al.. The structure of the potassium channel: Molecular basis of K+ conduction and selectivity. Science (1979) 1998;280:69–77. doi: 10.1126/science.280.5360.69 - DOI - PubMed
    1. Robertson JL, Kolmakova-Partensky L, Miller C. Design, function and structure of a monomeric ClC transporter. Nature 2010;468:844–7. doi: 10.1038/nature09556 - DOI - PMC - PubMed
    1. Perez C, Khafizov K, Forrest LR, Krämer R, Ziegler C. The role of trimerization in the osmoregulated betaine transporter BetP. EMBO Rep 2011;12:804–10. doi: 10.1038/embor.2011.102 - DOI - PMC - PubMed
    1. Khelashvili G, Pillai AN, Lee J, Pandey K, Payne AM, Siegel Z, et al.. Unusual mode of dimerization of retinitis pigmentosa-associated F220C rhodopsin. Sci Rep 2021;11. 10.1038/s41598-021-90039-3. - DOI - PMC - PubMed

Publication types