. 2023 Jan 20;9(3):eade9459.
doi: 10.1126/sciadv.ade9459. Epub 2023 Jan 20.

Inflammation of the retinal pigment epithelium drives early-onset photoreceptor degeneration in Mertk-associated retinitis pigmentosa

Affiliations

Inflammation of the retinal pigment epithelium drives early-onset photoreceptor degeneration in Mertk-associated retinitis pigmentosa

Maria E Mercau et al. Sci Adv. .

Abstract

Severe, early-onset photoreceptor (PR) degeneration associated with MERTK mutations is thought to result from failed phagocytosis by retinal pigment epithelium (RPE). Notwithstanding, the severity and onset of PR degeneration in mouse models of Mertk ablation are determined by the hypomorphic expression or the loss of the Mertk paralog Tyro3. Here, we find that loss of Mertk and reduced expression/loss of Tyro3 led to RPE inflammation even before eye-opening. Incipient RPE inflammation cascaded to involve microglia activation and PR degeneration with monocyte infiltration. Inhibition of RPE inflammation with the JAK1/2 inhibitor ruxolitinib mitigated PR degeneration in Mertk-/- mice. Neither inflammation nor severe, early-onset PR degeneration was observed in mice with defective phagocytosis alone. Thus, inflammation drives severe, early-onset PR degeneration-associated with Mertk loss of function.


Figures
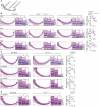
Fig. 1.
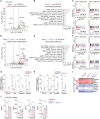
Fig. 1.. Loss of Mertk and concomitant loss or hypomorphic expression of Tyro3 leads to severe, early-onset PR degeneration.
(A) Schematic of transversal section of the retina indicating the regions representing the central (i), intermediate (ii), and peripheral (iii) areas quantified to determine outer nuclear layer (ONL) thickness. (B) Transversal sections of P25, P30, and P35 C57BL/6 WT, Mertk−/−V2 Tyro3−/−V2, and Mertk−/−V1 retina were stained with hematoxylin and eosin (H&E). Representative retinal sections and quantification of ONL thickness in central (i), intermediate (ii), and peripheral (iii) retinal areas are shown. Scale bars, 200 μm (whole section) and 10 μm (insets). n = 3 mice per genotype. (C) Transversal sections of P25, 6-month-old, and 12-month-old C57BL/6 WT and Mertk−/−V2 retina were stained with H&E. Representative retinal sections and quantification of ONL thickness in central (i), intermediate (ii), and peripheral (iii) retinal areas are shown. Scale bars, 200 μm (whole section) and 10 μm (insets). n = 3 mice per genotype. (D) Transversal sections of 12-month-old C57BL/6 WT and Tyro3−/−V1 retina were stained with H&E. Representative retinal sections and quantification of ONL thickness in central (i), intermediate (ii), and peripheral (iii) retinal areas are shown. Scale bars, 200 μm (whole section) and 10 μm (insets). n = 3 mice per genotype. All graphs represent means ± SEM of 15 measurements per area per mouse. n.s. (not significant), *P < 0.05, **P < 0.01, and ****P < 0.0001 versus C57BL/6 WT by two-way analysis of variance (ANOVA).
Fig. 2.
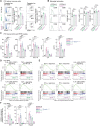
Fig. 2.. Loss of Mertk and hypomorphic expression or concomitant loss of Tyro3 leads to retinal inflammation.
(A) Number of CD45+ cells and microglia (CD45+ CD11b+ CD64+ cells) in P25 C57BL/6 WT and Mertk−/−V1 retina, determined by flow cytometry. Represented as fold change versus C57BL/6 WT. n = 4 to 6 per group, Mann-Whitney’s test. (B) Microglial expression of CD68, CD11c, and CD86 and corresponding quantification of mean fluorescence intensity (MFI). n = 4 to 6 per group, Mann-Whitney’s test. (C) Number of CD45+ cells and microglia in P25 C57BL/6 WT and Mertk−/−V2 Tyro3−/−V2 retina, determined by flow cytometry. Represented as fold change versus C57BL/6 WT. n = 5 to 6 per group, Mann-Whitney’s test. (D) Microglial expression of CD68, CD11c, and CD86 and corresponding MFI quantification. n = 5 to 6 per group, Mann-Whitney’s test. (E) Representative IBA1 staining, indicating microglia localization (arrowheads) in P25 C57BL/6 WT, Mertk−/−V1, and Mertk−/−V2 Tyro3−/−V2 retina. Scale bars, 20 μm. Quantification of total number of IBA1+ cells. n = 3 per group, one-way ANOVA, Tukey’s test. Percentage of IBA1+ cells in ONL versus OPL. n = 3 per group, two-way ANOVA. INL, inner nuclear layer; OPL, outer plexiform layer. (F) Quantification of chemokines and cytokines in neural retina and RPE lysates of P25 C57BL/6 WT, Mertk−/−V1, and Mertk−/−V2 Tyro3−/−V2 mice by Luminex. Represented as fold change versus C57BL/6 WT. n = 5 per genotype, one-way ANOVA, Dunnet’s test. All bar graphs represent means ± SEM. *P < 0.05, **P < 0.01, ***P < 0.001, and ****P < 0.0001.
Fig. 3.
Fig. 3.. Loss of Mertk and hypomorphic expression or concomitant loss of Tyro3 triggers exacerbated inflammation in the RPE.
(A) Volcano plot of gene expression in P25 Mertk−/−V1 versus C57BL/6 WT RPE by RNA-seq (n = 6 per genotype, two animals pooled per sample). Significance: fold change > 2 or <−2 and Padj < 0.05. Inflammation-associated genes are indicated in red. (B) Top Gene Ontology Biological Orocess (GOBP) and HALLMARK pathways composed of genes significantly up-regulated (FDR < 0.05) in Mertk−/−V1 versus C57BL/6 WT RPE at P25. (C) Gene set enrichment analysis (GSEA) comparing Mertk−/−V1 versus C57BL/6 WT RPE. Significantly up-regulated categories in Mertk−/−V1 mice are shown. ES, enrichment score. NF-κB, nuclear factor κB. (D) Volcano plot of gene expression in P25 Mertk−/−V2 Tyro3−/−V2 versus C57BL/6 WT RPE by RNA-seq (n = 3 to 6 per genotype, two animals pooled per sample). Significance: fold change > 2 or <−2 and Padj < 0.05. Inflammation-associated genes are indicated in red. (E) Top GOBP and HALLMARK pathways composed of genes significantly up-regulated (FDR < 0.05) in Mertk−/−V2 Tyro3−/−V2 versus C57BL/6 WT RPE at P25. (F) GSEA comparing Mertk−/−V2 Tyro3−/−V2 versus C57BL/6 WT RPE. Significantly up-regulated categories in Mertk−/−V2 Tyro3−/−V2 mice are shown. (G and H) qPCR validation of inflammation-associated genes up-regulated in Mertk−/−V1 (G) or Mertk−/−V2 Tyro3−/−V2 (H) versus C57BL/6 WT RPE. n = 5 per genotype, Mann-Whitney’s test. (I) Heatmap indicating log2-normalized counts of RPE- and immune cell–associated genes. P25 C57BL/6 WT, Mertk−/−V1, and Mertk−/−V2 Tyro3−/−V2 RPE. (J) Levels of chemokines and cytokines in lysates of P25 C57BL/6 WT, Mertk−/−V1, and Mertk−/−V2 Tyro3−/−V2 RPE by Luminex. Represented as fold change versus C57BL/6 WT. n = 4 to 5 per genotype, ANOVA, Dunnet’s test. Bar graphs in (G), (H), and (J) represent means ± SEM. *P < 0.05, **P < 0.01, and ***P < 0.001.
Fig. 4.
Fig. 4.. Loss of Mertk results in early-onset defects in RPE POS phagocytosis in vivo.
(A) POS phagocytosis analyzed by counting rhodopsin-positive inclusions in whole-mount RPE from P25 C57BL/6 WT and Mertk−/−V2 mice at 1 hour after light onset. Representative images of one C57BL/6 WT and two different Mertk−/−V2 mice and quantification of large phagosomes (recently engulfed POS; diameter, ≥0.9 μm) and total phagosomes (diameter, ≥0.5 μm). Means ± SEM of 13 to 16 fields per mouse, n = 5 to 8 mice per genotype, Mann-Whitney’s test. Scale bars, 20 μm. (B) POS phagocytosis analyzed by counting rhodopsin-positive inclusions in whole-mount RPE from 3-month-old C57BL/6 WT and Mertk−/−V2 mice at 1 hour after light onset. Representative images of one C57BL/6 WT and two different Mertk−/−V2 mice and quantification of large phagosomes (recently engulfed POS fragments; diameter, ≥0.9 μm) and total phagosomes (diameter, ≥0.5 μm). Means ± SEM of 16 fields per mouse, n = 5 to 6 mice per genotype, Mann-Whitney’s test. Scale bars, 20 μm. **P < 0.01.
Fig. 5.
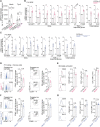
Fig. 5.. Independent ablation of Mertk or Tyro3 does not lead to retinal inflammation.
(A) Number of CD45+ cells and microglia (CD45+CD11b+CD64+ cells) in P25 C57BL/6 WT, Mertk−/−V2, and Tyro3−/−V1 retina, determined by flow cytometry. Represented as fold change versus C57BL/6 WT. n = 5 to 14 per group, ANOVA. Dotted line: fold change of CD45+ cells and microglia observed in P25 Mertk−/−V2 Tyro3−/−V2 versus C57BL/6 WT (corresponding to Fig. 2C). (B) Microglial expression of CD68, CD11c, and CD86 and corresponding quantification of MFI. n = 5 to 14 per group, ANOVA. (C) Quantification of chemokines and cytokines in neural retinas and RPE lysates of P25 C57BL/6 WT, Mertk−/−V1, Mertk−/−V2 Tyro3−/−V2, Mertk−/−V2, and Tyro3−/−V1 mice by Luminex. Represented as fold change versus C57BL/6 WT. n = 5 per genotype, ANOVA, Dunnet’s test. Datasets from Mertk−/−V1 and Mertk−/−V2 Tyro3−/−V2 mice correspond to data in Fig. 2F. All measurements were done in parallel. (D and E) GSEA comparing (D) Mertk−/−V1 versus Mertk−/−V2-derived RPE (top) or Mertk−/−V2 Tyro3−/−V2 versus Mertk−/−V2-derived RPE (bottom) or (E) Mertk−/−V1 versus Tyro3−/−V1-derived RPE (top) or Mertk−/−V2 Tyro3−/−V2 versus Tyro3−/−V1-derived RPE (bottom) at P25. (F) qPCR validation of inflammation-associated genes in P25 Mertk−/−V1, Mertk−/−V2 Tyro3−/−V2, Mertk−/−V2, and Tyro3−/−V1 versus C57BL/6 WT RPE. Represented as fold change versus C57BL/6 WT. n = 5 per genotype, ANOVA, Dunnet’s test. Bar graphs represent means ± SEM. n.s., *P < 0.05, **P < 0.01, ***P < 0.001, and ****P < 0.0001.
Fig. 6.
Fig. 6.. Increased inflammation in the RPE of Mertk−/−V1 and Mertk−/−V2 Tyro3−/−V2 mice precedes eye-opening and retinal microglia activation.
(A) Mertk and Tyro3 mRNA expression at P10 and P25 in C57BL/6 WT RPE by qPCR. n = 6 per group, ANOVA, Tukey’s test. (B and C) IFN-stimulated genes (ISGs), TNF-α–inducible genes and chemokines at P10 from C57BL/6 WT and Mertk−/−V1 RPE (n = 5 to 6 per group, one-tailed Mann-Whitney’s test) and C57BL/6 WT and Mertk−/−V2 Tyro3−/−V2 RPE (n = 5 per group, one-tailed Mann-Whitney’s test), determined by qPCR. (D) Number of CD45+ cells and microglia (CD45+CD11b+CD64+ cells) in P10 C57BL/6 WT and Mertk−/−V1 retina, determined by flow cytometry. Represented as fold change versus C57BL/6 WT. n = 4 to 5 per group, Mann-Whitney’s test. (E) Microglial expression of CD68, CD11c, and GAL3 and corresponding MFI quantification in C57BL/6 WT and Mertk−/−V1 mice at P10. n = 4 to 5 per group, Mann-Whitney’s test. (F) Number of CD45+ cells and microglia in P10 C57BL/6 WT and Mertk−/−V2 Tyro3−/−V2 retina, determined by flow cytometry. Represented as fold change versus C57BL/6 WT. n = 6 to 7 per group, Mann-Whitney’s test. (G) Microglial expression of CD68, CD11c, and GAL3 and corresponding MFI quantification. n = 6 to 7 per group, Mann-Whitney’s test. Bar graphs represent means ± SEM. n.s., *P < 0.05, **P < 0.01, and ****P < 0.0001.
Fig. 7.
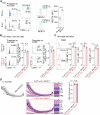
Fig. 7.. Conditional ablation of Mertk in microglia is not sufficient to drive retinal degeneration.
(A) P25 C57BL/6 WT and Mertk−/−V2 retina and brain tissue stained and analyzed for MERTK expression by flow cytometry. Gating strategy for identification of microglia (CD45+CD11b+CD64+ cells) in the retina (top) and the brain (bottom). Representative MERTK expression and quantification of MFI on the surface of retina and brain microglia are shown. n = 4 mice per group, Mann-Whitney’s test. (B) Number of CD45+ cells and microglia (CD45+CD11b+CD64+ cells) in P25 Csf1r-cre+ Mertk f/f and Csf1r-cre Mertk f/f retina, determined by flow cytometry. Represented as fold change versus Csf1r-cre Mertk f/f mice. n = 6 mice per group, Mann-Whitney’s test. (C) Microglial expression of CD68, CD11c, and GAL3 and corresponding MFI quantification in Csf1r-cre+ Mertk f/f and Csf1r-cre Mertk f/f mice at P25. n = 6 mice per group, Mann-Whitney’s test. (D) Schematic of transversal section of the retina indicating the intermediate region wherein ONL thickness was quantified. Retinal sections were stained with H&E. Representative retinal sections and quantification of ONL thickness. Ten measurements per mouse, n = 3 mice per genotype. Mann-Whitney’s test. Scale bars, 200 μm (whole section) and 10 μm (inset). Bar graphs represent means ± SEM. n.s. and ****P < 0.0001.
Fig. 8.
Fig. 8.. The selective JAK1/2 inhibitor ruxolitinib significantly prevents early-onset PR death.
(A) Diagram showing experimental design. C57BL/6 WT and Mertk−/−V1 dams were fed a standard or ruxolitinib-containing diet (2 g of ruxolitinib/kg of chow) from the time pups were at P10 until weaning at P21. Weanlings continued to receive standard or ruxolitinib-containing diet until the indicated times of sample collection. RPE samples were collected at P25 for mRNA expression of target genes. Eyes were collected at P30 to study retinal histology. (B) Inflammation-associated genes in P25 RPE by qPCR. n = 4 mice per condition, two-way ANOVA. (C) Schematic of transversal section of the retina indicating the intermediate region wherein ONL thickness was quantified. Retina sections were collected at P30, stained with H&E and ONL thickness and number of rows of nuclei within ONL were quantified. Representative retina sections from C57BL/6 WT and Mertk−/−V1 mice treated with standard or ruxolitinib diet. n = 3 to 7 mice per condition, two-way ANOVA. Scale bars, 20 μm. (D) Representative images and quantification of the number of pyknotic nuclei in ONL of P30 Mertk−/−V1 mice treated with ruxolitinib or standard diet. n = 3 to 7 mice per condition, Mann-Whitney’s test. Scale bars, 10 μm. Bar graphs represent means ± SEM. n.s., *P < 0.05, **P < 0.01, and ***P < 0.001.

References

    1. S. Ferrari, E. Di Iorio, V. Barbaro, D. Ponzin, F. S. Sorrentino, F. Parmeggiani, Retinitis pigmentosa: Genes and disease mechanisms. Curr. Genomics 12, 238–249 (2011). - PMC - PubMed
    1. C. Hamel, Retinitis pigmentosa. Orphanet J. Rare Dis. 1, 40 (2006). - PMC - PubMed
    1. I. Audo, S. Mohand-Said, E. Boulanger-Scemama, X. Zanlonghi, C. Condroyer, V. Démontant, F. Boyard, A. Antonio, C. Méjécase, S. El Shamieh, J.-A. Sahel, C. Zeitz, MERTK mutation update in inherited retinal diseases. Hum. Mutat. 39, 887–913 (2018). - PubMed
    1. C. Parinot, E. F. Nandrot, A comprehensive review of mutations in the MERTK proto-oncogene. Adv. Exp. Med. Biol. 854, 259–265 (2016). - PubMed
    1. M. Tschernutter, S. A. Jenkins, N. H. Waseem, Z. Saihan, G. E. Holder, A. C. Bird, S. S. Bhattacharya, R. R. Ali, A. R. Webster, Clinical characterisation of a family with retinal dystrophy caused by mutation in the Mertk gene. Br. J. Ophthalmol. 90, 718–723 (2006). - PMC - PubMed

MeSH terms

Substances