. 2023 Jan 20;9(3):eadc8728.
doi: 10.1126/sciadv.adc8728. Epub 2023 Jan 20.

Adsorptive exchange of coccolith biominerals facilitates viral infection

Affiliations

Adsorptive exchange of coccolith biominerals facilitates viral infection

Christopher T Johns et al. Sci Adv. .

Abstract

Marine coccolithophores are globally distributed, unicellular phytoplankton that produce nanopatterned, calcite biominerals (coccoliths). These biominerals are synthesized internally, deposited into an extracellular coccosphere, and routinely released into the external medium, where they profoundly affect the global carbon cycle. The cellular costs and benefits of calcification remain unresolved. Here, we show observational and experimental evidence, supported by biophysical modeling, that free coccoliths are highly adsorptive biominerals that readily interact with cells to form chimeric coccospheres and with viruses to form "viroliths," which facilitate infection. Adsorption to cells is mediated by organic matter associated with the coccolith base plate and varies with biomineral morphology. Biomineral hitchhiking increases host-virus encounters by nearly an order of magnitude and can be the dominant mode of infection under stormy conditions, fundamentally altering how we view biomineral-cell-virus interactions in the environment.


Figures

Fig. 1.
Fig. 1.. Xenospheres of coccolithophores are globally distributed across diverse oceanic regions.
Scanning electron microscopy (SEM) images of xenospheres composed of: (A) Two different Emiliania huxleyi coccolith morphotypes in the Northeast Atlantic [North Atlantic Virus Infection of Coccolithophores Expedition (NA-VICE); www.bco-dmo.org/project/2136]; (B) two different E. huxleyi coccolith morphotypes and a coccolith from another coccolithophore species (possibly G. oceanica) observed in the Mediterranean Sea (courtesy of B. D’Amario) (18); (C) E. huxleyi coccoliths and a coccolith from S. corolla observed in English Channel (courtesy of A. Taylor); (D) E. huxleyi coccoliths and coccoliths from R. clavigera observed in the North Aegean Sea (courtesy of M. Dimiza and O. Archontikis) (30); (E and F) E. huxleyi coccoliths and coccoliths from Gephyrocapsa collected from Uranouchi Bay, Kochi Prefecture, Japan [courtesy of the Electronic Microfossil Image Database System (www.emidas.org/) and K. Hagino] (31); (G) E. huxleyi coccoliths and a coccolith from G. oceanica in the Gulf of Aqaba (21); (H) two different E. huxleyi coccolith morphotypes collected during the fourth Indian Southern Ocean expedition (23); and (I) two different E. huxleyi coccolith morphotypes and (J) E. huxleyi coccoliths and a coccolith from D. tubifera, both observed in the Santa Barbara Channel (images from P. Matson). (K) Relative distribution of xenospheres (blue) compared to E. huxleyi (gray), G. oceanica (light gray), and other coccolithophore species (black) with uniform, homogenous coccospheres (n = 1178). Images from both (I) and (J) as well as data in (K) were derived from surface populations across all stations of the 2014 Plumes and Blooms cruise (www.oceancolor.ucsb.edu/plumes_and_blooms). (A to J) Color shading for all SEM images designates E. huxleyi type A morphotype (blue), other E. huxleyi morphotypes (type O and type OA; purple), and coccoliths from other coccolithophore species (orange). Scale bars are provided for size reference.
Fig. 2.
Fig. 2.. E. huxleyi cells readily adsorb free coccoliths.
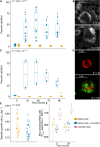
Adsorption of free coccoliths to naked E. huxleyi cells was confirmed using flow cytometry (A and C), SEM (B), and fluorescence confocal microscopy (D). The dynamics of coccolith adsorption and the percentage of “calcified cells” were quantified using both (A) SSC, a proxy for calcification state, and (C) cell fluorescence (520 ± 15 nm) from coccoliths prestained with calcein (see Methods). Statistical significance in (A) was determined via general additive mixed modeling (GAMM; naked cells: P value of 0.616 and naked cells + coccoliths: P value of <2 × 10⁻¹⁶; fig. S3, A and B) for data over 96 hours from five pooled experiments, each containing biological triplicates (n = 94). Statistical significance in (C) was determined via GAMM (naked cells: P value of 0.835 ; naked cells + coccoliths: P value of 5.09 × 10⁻¹⁰; fig. S3, C and D) of pooled data over 96 hours from two experiments each containing biological triplicates (n = 6 at each time point for each treatment). Corresponding SEM (B) and confocal (D) microscopic images confirmed coccolith adsorption to cells 72 hours after coccolith addition. For (D), red represents chlorophyll fluorescence via chloroplasts and green represents calcein-stained coccoliths. (E) Specific growth rates (μ; day−1) of naked cells (n = 18) and cells with adsorbed coccoliths were indistinguishable (Mann-Whitney; n = 21; P = 0.06). Growth rates were pooled from five different experiments and correspond to cells presented in Fig. 1A. (F) Maximum photosynthetic rates (Pmax) for naked cells, cells with adsorbed coccoliths, and stably calcified cells; (n = 3) at 0 and 24 hours after coccolith addition. Letters denote statistically significant groups as determined via one-way analysis of variance (ANOVA) and Tukey’s post hoc test. For the box and whisker plots in (A), (C), (E), and (F), each point represents an individual biological replicate.
Fig. 3.
Fig. 3.. Coccolith adsorption requires organic matter and is most efficient at open ocean cell concentrations.
(A to F) SEM images visualizing the surface ultrastructure of untreated and oxidized coccoliths. (C) to (F) show the impact of oxidation on the organic baseplate, which makes direct contact to the cell [dashed ovals show the area of the organic baseplate on the proximal side of the coccoliths (C and D); white arrows highlight the visual differences in organic baseplate integrity between the two treatments]. Hypochlorite oxidation removed the surface organic baseplate. Scale bars are provided in each panel [magnification: (A) and (B), ×12,000; (C) and (D), ×50,000; and (E) and (F), ×100,000). (G) Box and whisker plot showing the impact of organic matter oxidization on coccolith adsorption after 24 hours (percentage of calcified cells using flow cytometry SSC). Oxidized coccoliths (orange; see Methods) are compared to naked cells alone (yellow) and naked cells exposed to untreated, intact coccoliths (blue). Symbols denote different experiments (each performed with biological triplicates; n = 6 total points, across two experiments). (H to J) Box and whisker plots of (H) measured coccolith adsorption rates (coccoliths ml−1 day−1), (I) predicted coccolith encounter rates with cells (cell-coccolith encounters ml−1 day−1), and (J) coccolith adsorption efficiencies for different host concentrations (ratio of the adsorption rate to the encounter rate, converted to percent per cell; see Methods for more details). Data derived from biological replicates (n = 3) 24 hours after coccolith addition across a range of cell concentrations and coccolith:cell ratios, including natural open ocean bloom concentrations (e.g., 103 cells ml−1 and 100:1 coccolith:cell ratio). Letters represent statistically distinct groups, as determined by Kruskal-Wallis rank sum test and a post hoc Dunn test with Bonferroni P value adjustment (G) and one-way ANOVA and Tukey’s post hoc (H).
Fig. 4.
Fig. 4.. Viroliths can successfully infect cells.
(A) A conceptual model showing the facilitation of infection through coccolith adsorption: (i) virus adsorption to coccoliths and production of viroliths; (ii) virolith adsorption to cells and delivery of EhVs to the cell surface; and (iii) viral production and lysis of host cells. (B) Box and whisker plot showing the adsorption of untreated coccoliths (blue) and viroliths (light blue; see Methods) to cells after 48 hours compared to naked cells alone (yellow), expressed as the percentage of calcified cells using flow cytometry SSC. Points denote biological replicates (n = 3). (C and D) Time course of E. huxleyi cell (C) and EhV virus (D) concentrations for samples in which untreated coccoliths (blue; cell concentration only) and viroliths (light blue) were exposed to naked E. huxleyi cells, compared to cells only (yellow). Error bars represent the standard error across biological replicates (n = 3). Note that viroliths killed cells and had virus production after 96 hours, while supernatants containing deadsorbed, free viruses did not (fig. S14). Results confirm that viroliths effectively transmit and facilitate successful infection.
Fig. 5.
Fig. 5.. Coccoliths lower infectivity but facilitate infection.
Microtiter-based, most probable number assays in the absence (A) or presence (B) of coccoliths (column no. 2, uninfected controls; columns no. 3 to 11, EhV dilution series; rows B to G, technical replicates; n = 6). Plates were imaged after a 2-week incubation with lysis being scored to calculate respective EhV infectious titers. (C and D) Time course of small volume (250 μl) infections in the absence (C) or presence (D) of coccoliths [change in optical density (∆OD750); see Methods]. Cells were infected at different virus:host (V:H) ratios (symbols) and received 50:1 coccolith:cell (light blue) or no coccoliths (green). Error bars denote SE across technical replicates (n = 8). Black boxes denote time points used for detailed examination in (E). (E) Box and whisker plots show virus + coccolith treatments had lower average ∆OD750 values across V:H ratios, although not statistically significant [10:1; 1:1, and 0.1:1 (Mann-Whitney U test); 0.01:1 (Student’s t test); P values: 6.50 × 10⁻², 1.95 × 10⁻¹, 1.95 × 10⁻¹, and 2.23 × 10⁻¹, respectively]. (F) Box and whisker plots from two, larger volume (40 ml) experiments at different V:H ratios (see time series in fig. S16). Experiments used fluorescence-activated cell sorting–sorted coccoliths (gray shading) or coccoliths isolated via density centrifugation (all other data points; see Methods). V:H ratios of 0.1 were significantly different (gray, P value of 5.13 × 10⁻³, Student’s t test; white background, P value of 3.62 × 10⁻³ Mann-Whitney U test). Data for V:H of 0.01 were visually different (non-overlapping first and third quartiles) but not statistically significant (P value of 0.20, Mann-Whitney U test). V:H ratio of 5 was weakly significant (P value of 4.28 × 10⁻², Student’s t test) but had the opposite trend (i.e., viroliths killed fewer cells). Individual data points are shown and denote biological replicates (n = 3). Color legend (D) applies to (C) to (F), while the shape legend (C) only applies to (C) and (D).
Fig. 6.
Fig. 6.. The multifaceted roles of coccoliths in E. huxleyi–EhV interactions.
A conceptual model highlighting the mulitfaceted roles of coccoliths during viral infection. The top section (i to iii; shaded blue) represents the beneficial roles of coccoliths to host cells by delaying infection as described in a previous study (5); the bottom section (iv to vi; shaded pink) highlights of the antagonistic roles of coccoliths to host cells by facilitating infection via viroliths as described in this study. (i) Coccoliths in an intact coccosphere can help delay infection by preventing viruses from contacting the cell surface; (ii) exposure to viruses induces the production of a host-derived, unidentifed infochemical (yellow) that triggers coccolith shedding; (iii) coccolith shedding occurs before cell lysis, increasing the concentration of naked cells and free coccoliths within a population, with the coccoliths adsorbing and removing free viruses from the surrounding milleu; (iv) virus adsorption to free coccoliths leads to the formation of viroliths; (v) virolith adsorption to cells increases the encounter rate of viruses to cells and promotes delivery of infectious EhVs to the cell surface; (vi) viral production and lysis of host cells, in conjuction with virus-induced cocolith shedding, increases the likelihood of further virolith formation.

References

    1. A. R. Taylor, M. A. Russell, G. M. Harper, T. F. T. Collins, C. Brownlee,Dynamics of formation and secretion of heterococcoliths by Coccolithus pelagicus ssp braarudii. Eur. J. Phycol. 42,125–136 (2007).
    1. L. Mackinder, G. Wheeler, D. Schroeder, U. Riebesell, C. Brownlee,Molecular mechanisms underlying calcification in coccolithophores. Geomicrobiol. J. 27,585–595 (2010).
    1. P. L. A. M. Corstjens, A. Van Der Kooij, C. Linschooten, G.-J. Brouwers, P. Westbroek, E. W. De Vrind-De Jong,Gpa, a calcium-binding protein in the coccolithophorid Emiliania huxleyi (Prymnesiophyceae). J. Phycol. 34,622–630 (1998).
    1. C. E. Walker, A. R. Taylor, G. Langer, G. M. Durak, S. Heath, I. Probert, T. Tyrrell, C. Brownlee, G. L. Wheeler,The requirement for calcification differs between ecologically important coccolithophore species. New Phytol. 220,147–162 (2018). - PMC - PubMed
    1. C. T. Johns, A. Grubb, J. I. Nissimov, F. Natale, V. Knapp, A. Mui, H. Fredricks, B. A. S. Van Mooy, K. D. Bidle,The mutual interplay between calcification and coccolithovirus infection. Environ. Microbiol. 21,1896–1915 (2019). - PMC - PubMed

Substances