. 2023 Jan 20;8(79):eade7953.
doi: 10.1126/sciimmunol.ade7953. Epub 2023 Jan 20.

A multimorphic mutation in IRF4 causes human autosomal dominant combined immunodeficiency

IRF4 International Consortium  1 Oriol FornesAlicia JiaHye Sun KuehnQing MinUlrich PannickeNikolai SchleussnerRomane ThouenonZhijia YuMaría de Los Angeles AstburyCatherine M BiggsMiguel GalicchioJorge Alberto Garcia-CamposSilvina GismondiGuadalupe Gonzalez VillarrealKyla J HildebrandManfred HönigJia HouDespina MoshousStefania PittalugaXiaowen QianJacob RozmusAnsgar S SchulzAidé Tamara Staines-BooneBijun SunJinqiao SunSchauer UweEdna Venegas-MontoyaWenjie WangXiaochuan WangWenjing YingXiaowen ZhaiQinhua ZhouAltuna AkalinIsabelle AndréThomas F E BarthBernd BaumannAnne BrüstleGaetan BurgioJacinta C BustamanteJean-Laurent CasanovaMarco G CasarottoMarina CavazzanaLoïc ChentoutIan A CockburnMariantonia CostanzaChaoqun CuiOliver DaumkeKate L Del BelHermann EibelXiaoqian FengVedran FrankeJ Christof M GebhardtAndrea GötzStephan GrunwaldBénédicte HoareauTimothy R HughesEva-Maria JacobsenMartin JanzArttu JolmaChantal Lagresle-PeyrouNannan LaiYaxuan LiSusan LinHenry Y LuSaul O Lugo-ReyesXin MengPeter MöllerNidia Moreno-CoronaJulie E NiemelaGherman NovakovskyJareb J Perez-CaraballoCapucine PicardLucie PoggiMaria-Emilia Puig-LombardiKatrina L RandallAnja ReisserYohann SchmittSandali SeneviratneMehul SharmaJennifer StoddardSrinivasan SundararajHarry SuttonLinh Q TranYing WangWyeth W WassermanZichao WenWiebke WinklerErmeng XiongAlly W H YangMeiping YuLumin ZhangHai ZhangQian ZhaoXin ZhenAnselm EndersSven KrackerRuben Martinez-BarricarteStephan MathasSergio D RosenzweigKlaus SchwarzStuart E TurveyJi-Yang Wang
Affiliations

A multimorphic mutation in IRF4 causes human autosomal dominant combined immunodeficiency

IRF4 International Consortium et al. Sci Immunol. .

Abstract

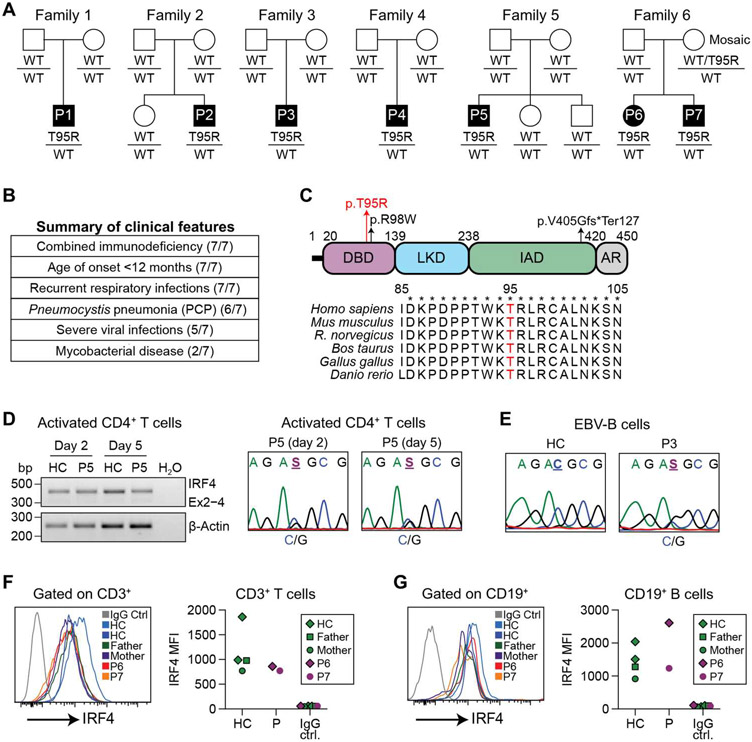
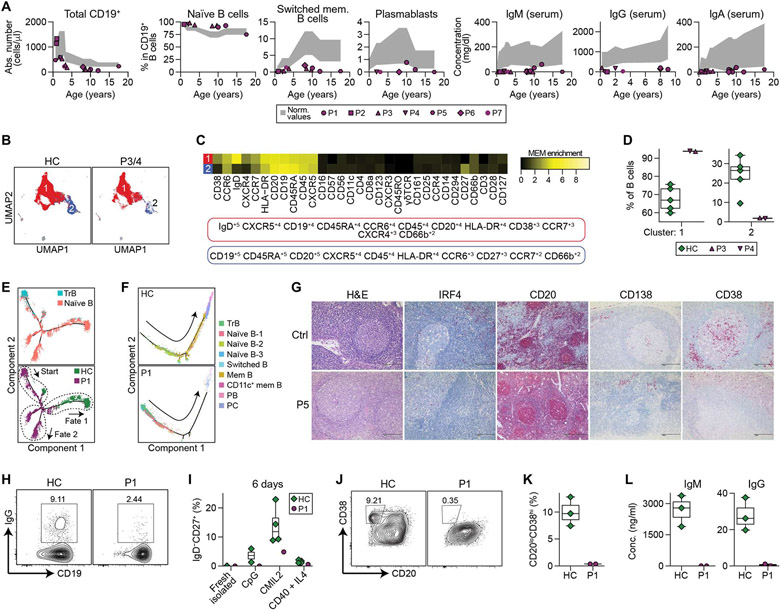
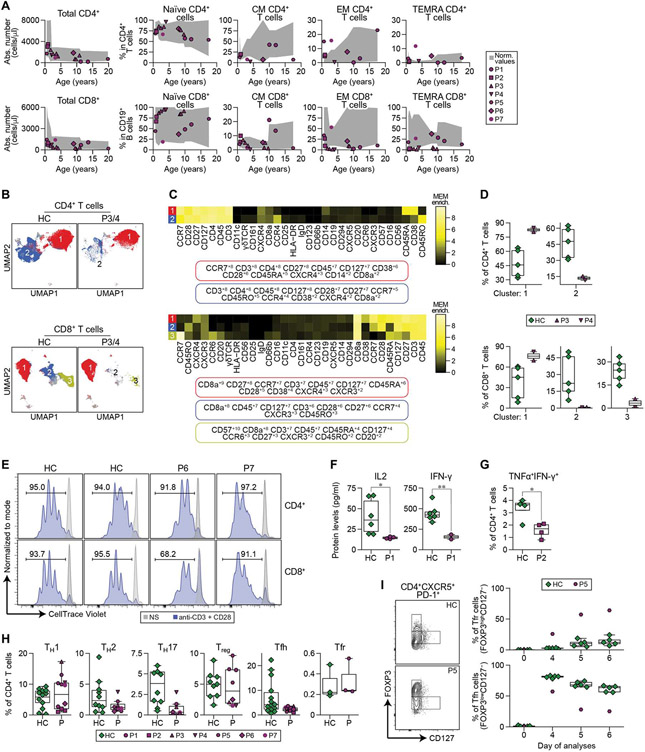
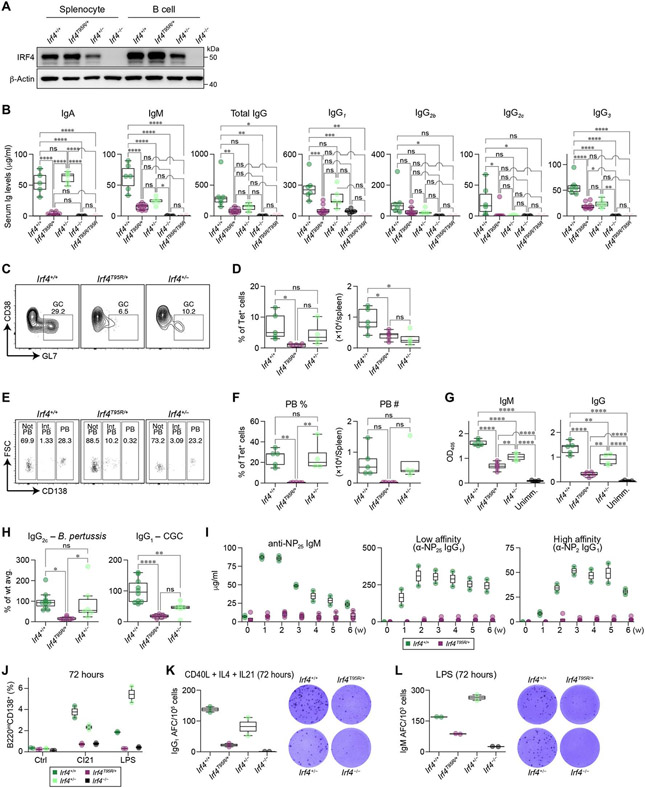
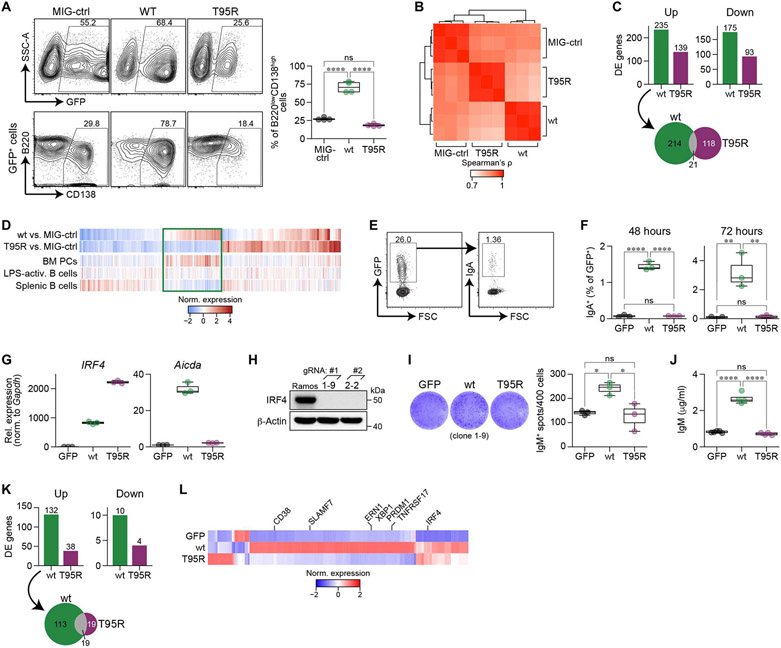
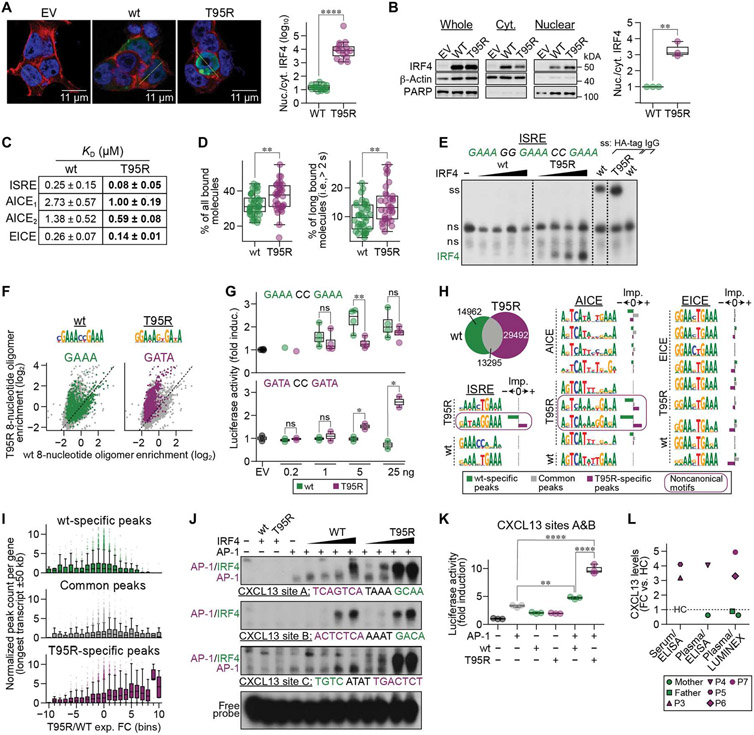
Interferon regulatory factor 4 (IRF4) is a transcription factor (TF) and key regulator of immune cell development and function. We report a recurrent heterozygous mutation in IRF4, p.T95R, causing an autosomal dominant combined immunodeficiency (CID) in seven patients from six unrelated families. The patients exhibited profound susceptibility to opportunistic infections, notably Pneumocystis jirovecii, and presented with agammaglobulinemia. Patients' B cells showed impaired maturation, decreased immunoglobulin isotype switching, and defective plasma cell differentiation, whereas their T cells contained reduced TH17 and TFH populations and exhibited decreased cytokine production. A knock-in mouse model of heterozygous T95R showed a severe defect in antibody production both at the steady state and after immunization with different types of antigens, consistent with the CID observed in these patients. The IRF4T95R variant maps to the TF's DNA binding domain, alters its canonical DNA binding specificities, and results in a simultaneous multimorphic combination of loss, gain, and new functions for IRF4. IRF4T95R behaved as a gain-of-function hypermorph by binding to DNA with higher affinity than IRF4WT. Despite this increased affinity for DNA, the transcriptional activity on IRF4 canonical genes was reduced, showcasing a hypomorphic activity of IRF4T95R. Simultaneously, IRF4T95R functions as a neomorph by binding to noncanonical DNA sites to alter the gene expression profile, including the transcription of genes exclusively induced by IRF4T95R but not by IRF4WT. This previously undescribed multimorphic IRF4 pathophysiology disrupts normal lymphocyte biology, causing human disease.


Figures

Fig. 1.
Fig. 1.. Identification of a unique heterozygous mutation in the IRF4 gene in seven CID patients.
(A) Pedigrees of seven patients from six unrelated families with an identical IRF4 mutation (c.284C>G, p.T95R). Affected individuals are indicated by the filled symbols. (B) Summary of the major clinical features in these patients. (C) Schematic representation of the IRF4 protein (isoform 2; National Center for Biotechnology Information accession#: NP_001182215.1). LKD, linker domain; IAD, IRF association domain; AR, autoregulatory region. The T95R substitution is indicated by a red arrow. A recently identified heterozygous loss-of-function (LOF) mutation (c.292C>T, R98W) associated with Whipple’s disease and a homozygous splicing mutation (c.1213-2A>G, p.V405Gfs*Ter127) causing human CID are also indicated. Bottom: alignment of the amino acids in the DBD of IRF4 from different species. T95 is shown in red. (D) Left: CD4+-naïve T cells from P5 were stimulated with anti-CD3/CD28 beads, IL12, and Activin A for 2 and 5 days. Total RNAwas isolated from 500 cells and analyzed by reverse transcription PCR (RT-PCR). Right: Sanger sequencing of RT-PCR products. HC, healthy controls. (E) Sanger sequencing of RT-PCR products of EBV B cells from P3. (F and G) Flow cytometric analysis (intracellular staining) for IRF4 protein expression in gated CD3+ T cells (F) or CD19+ B cells (G) Left: representative profiles. Right: mean fluorescence intensity (MFI) of IRF4 protein from P6 and P7, their parents, and two HC.
Fig. 2.
Fig. 2.. Impaired Ig gene CSR and defective memory B and plasma cell differentiation in IRF4T95R patients.
(A) Total number of B cells, proportions of naïve B, switched memory B and plasmablasts among CD19+ B cells and serum Ig levels in the seven patients. Age-matched reference ranges are shown in gray. Detailed data are shown in tables S3 to S9. (B to D) CyTOF analysis of the B cell cluster from fig. S2 (A to C) performed in P3, P4, and five HC. (B) Dimensional reduction by uniform manifold approximation and projection (UMAP) of the two major populations obtained by unsupervised clustering using FlowSOM. (C) MEM heatmap and tags showing the markers that characterize each population. (D) Proportions of clusters 1 and 2 among total B cells from fig. S2 (A to C). (E and F) Pseudotime analysis based on scRNA-seq of purified peripheral blood B cells performed in an HC and P1. (E) Pseudotime analysis of transitional and naïve B cell subpopulations. TrB, transitional B. (F) Pseudotime analysis of B cell differentiation into memory B and plasma cells. (G) Immunohistochemical staining of lymph nodes of P5 and an unaffected control (Ctrl). H&E, hematoxylin and eosin. PB, plasmablast. PC, plasma cell. (H) Purified naïve B cells of an age-matched HC and P1 were cultured with CD40L plus IL4 for 6 days and analyzed for the percentages of IgG+ cells by flow cytometry. (I) Purified naïve B cells of four HC and P1 were stimulated with CpG ODN 2006 alone, CpG + F(ab′)2 anti-IgM and IL2 (CMIL2), or CD40L + IL4 for 6 days and analyzed for the generation of CD19+IgDCD27+ memory B cells. (J to L) Purified naïve B cells of HC and P1 were stimulated with CMIL2 for 6 days and analyzed for the induction of CD20CD38+ plasmablasts and Ig secretion. (J) Representative FACS profiles. (K) Results of three HC and two experiments of P1. (L) IgM and IgG levels in the culture supernatants.
Fig. 3.
Fig. 3.. Altered T cell differentiation and reduced T cell activation and cytokine production in IRF4T95R patients.
(A) Total number of CD4+ (top left) and CD8+ (bottom left) T cells and percentages of naïve, CM, EM, and EM re-expressing CD45RA (TEMRA) cells among CD4+ (top) and CD8+ (bottom) T cells. (B to D) CyTOF analysis of the CD4+ and CD8+ cell clusters in P3, P4, and five HCs from fig. S2 (A to C). (B) Dimensional reduction by UMAP showing the two major clusters in the CD4+ population and the three major clusters of the CD8+ population obtained by unsupervised clustering using FlowSOM. (C) MEM heatmap and tags showing the markers that characterize each population. (D) Proportions of the different clusters among CD4+ (top) and CD8+ (bottom) cells from fig. S2 (A to C). (E) PBMCs from two HC and P6 and P7 were labeled with CellTrace Violet and stimulated with anti-CD3/anti-CD28 dynabeads for 4 days. Top: gated CD4+T cells. Bottom: gated CD8+T cells. NS, nonstimulation. (F) PBMCs from HC and P1 were stimulated with anti-CD3 and anti-CD28 for 24 hours and analyzed for the amount of IL2 and IFN-γ in the culture supernatants. Results of six HC and two to four independent experiments of P1 are shown. (G) Intracellular staining of TNFα and IFN-γ in CD4+ T cells from a HC and P2 before and after phorbol 12-myristate 13-acetate + ionomycin stimulation. Mean ± SD of four experiments was shown. (H) TH cell subset distributions in T95R patients and HC. The proportions of TH1, TH2, TH17, Treg, TFH, and Tfr among peripheral CD4+T cells were determined by flow cytometric analysis for P1, P2, and P5 to P7 and by CyTOF for P3 and P4 (table S10). (I) Purified naïve T cells (CD3+CD4+CD45RA+) of P5 and five HC were subjected to a TFH/Tfr differentiation assay and were analyzed by flow cytometry on days 0, 4, 5, and 6. Left: representative FACS profiles on day 6. Right: Proportions of Tfr-like (FOXP3highCD127) and TFH-like (FOXP3lowCD127+/−) cells among the CD4+PD-1+CXCR5+T cells were quantified. Red dots show means of three biological independent P5 replicates. Bars represent mean percentages of HC. Statistical significance was assessed by one-tailed Welch’s t test (F and G). *P < 0.05 and **P < 0.01.
Fig. 4.
Fig. 4.. Heterozygous p.T95R IRF4 knock-in mice recapitulate the immunodeficiency phenotypes observed in IRF4T95R patients.
(A) WT and mutant IRF4 protein expression in total splenocytes and purified B cells from WT (Irf4+/+), Irf4T95R/+, Irf4+/−, and Irf4−/− male mice. (B) Serum Ig levels in male and female mice were measured by ELISA. (C) Irf4+/+, Irf4T95R/+, and Irf4+/− mice were immunized with Plasmodium sporozoites and analyzed for the proportions of GC B cells within the Tet+ CSP-specific B cells, ns, not significant. (D) Percentages of Tet+ (antigen-specific) cells within all GC B cells (left) and number (right) of Tet+ (antigen-specific) GC B cells (left). (E) Irf4T95R/+ mice were unable to generate CD138high PBs. FSC, forward scatter. (F) Percentages (left) and number (right) of Tet+ PBs in the spleen.(G) The production of CSP-specific IgM and IgG antibodies. Absorbance at 405 nm was measured, and the area under the curve was calculated in Prism 8 from the log (dilution) on the x axis and the absorbance at 405 nm on the y axis, fitting a sigmoidal curve. OD405, optical density at 405 nm. (H) Left: IgG2c production after immunization with formalin-fixed B. pertussis. Right: IgG1 production in response to CGG immunization. (I) WT and Irf4T95R/+ female mice were immunized intraperitoneally with 25 μg of NP-CGG in alum. Serum levels of NP-specific IgM and low and high-affinity IgG1 were determined each week by ELISA. (J to L) Naïve B cells purified from WT and mutant male mice were cultured for 72 hours in the presence of CI21 or LPS. The cells were then analyzed for the generation of CD138+ plasma cell by flow cytometry (J) and IgG1 and IgM secretion by ELISPOT (K and L). Each dot represents data from an individual mouse. AFC, antibody-forming cell. Statistical significance was determined by Tukey’s post hoc test (B, D, and F to H). *P < 0.05, **P < 0.01, ***P < 0.001, and ****P < 0.0001.
Fig. 5.
Fig. 5.. IRF4T95R failed to induce plasma cell differentiation due to the inability to activate IRF4 target genes involved in plasma cell differentiation.
(A) Mouse C75BL/6 splenic B cells were cultured with LPS + IL4; transduced with control retrovirus (MIG-ctrl), IRF4WT, or IRF4T95R; and analyzed for CD138 and B220 expression in transduced GFP+ cells. Top left: representative FACS profiles. The percentage of GFP+ cells is indicated. Left bottom: CD138 and B220 expression in gated GFP+ cells; the percentage of CD138+B220low cells is indicated. Right: summary of four independent experiments. Mean ± SD is shown. SSC-A, side scatter-A. (B) Spearman correlation coefficient between RNA-seq derived expression values of isolated mouse splenic B cells transduced with IRF4WT, IRF4T95R, or MIG-ctrl. (C) Top: number of differentially expressed (DE) genes in IRF4WT and IRF4T95R when compared with MIG-ctrl samples. Bottom: Genes differentially up-regulated by IRF4WT and IRF4T95R show limited overlap. (D) Comparison of genes differentially regulated by IRF4T95R with gene expression of selected lymphoid cell types. Genes associated with plasma cell differentiation are marked by a rectangle. (E to G) CH12 B cells were transduced with retrovirus expressing GFP alone, IRF4WT, or IRF4T95R and analyzed for the proportion of IgA+ cells in gated GFP+ cells 48 and 72 hours later. (E) Representative FACS profiles showing the virus-transduced GFP+ fraction (left) and IgA expression among the GFP+ cells (right). (F) Class switch to IgA at 48 and 72 hours after transduction of retrovirus expressing GFP alone, IRF4WT, or IRF4T95R. Mean ± SD of three independent experiments is shown. (G) Real-time PCR analysis of IRF4 and Aicda expression in sorted GFP+ CH12 cells after retrovirus transduction. The level of IRF4 and Aicda in CH12 cells expressing GFP alone was set to 1. (H) Generation of IRF4-deficient Ramos cells. Immunoblot for IRF4 protein expression in WT and IRF4-deficient Ramos clones 1-9 and 2-2 derived from 1# and 2# gRNA. (I and J) IRF4-deficient Ramos cells (clone 1-9) were transduced with retrovirus expressing GPF alone, IRF4WT, or IRF4T95R. The GFP+ cells were sorted 3 days later and analyzed for IgM-secreting cells by ELISPOT. (I) Left: Representative images of ELISPOT. Right: the number of IgM-secreting spots. Mean ± SD of triplicate wells is shown. (J) Sorted cells were further cultured for 5 days and analyzed by ELISA for IgM secreted into the culture supernatant. (K and L) Raji cells were transduced with retrovirus expressing GPF alone, IRF4WT, or IRF4T95R, and the GFP+ cells were sorted for RNA-seq. (K) Number of differentially expressed genes in Raji cells expressing IRF4WT or IRF4T95R as compared with Raji cells expressing GFP alone. (L) Expression heatmap depicting the differentially expressed genes shown in (K). Average transcripts per kilobase of exon model per million mapped reads (TPM) values of three independent samples standardized by z score are shown. Statistical significance was assessed by Tukey’s post hoc test (A, F, I, and J). *P < 0.05, **P < 0.01, and ****p < 0.0001.
Fig. 6.
Fig. 6.. IRF4T95R showed increased nuclear localization and affinity for DNA, altered specificity, and a different IRF4-binding landscape.
(A) 293T cells were transfected with an empty vector (EV) or a vector-expressing IRF4WT or IRF4T95R. Nuclei were stained with DAPI (blue), cytoplasm with phalloidin (red), and IRF4 with an anti-IRF4 antibody (green). Left: representative images. Right: a summary of randomly chosen cells. (B) Ratio of nuclear to cytoplasmic IRF4 in Raji cells transduced with retrovirus expressing IRF4WT or IRF4T95R. Left: representative immunoblot. Right: mean ± SD of three independent experiments. PARP, poly(adenosine diphosphate–ribose) polymerase. (C) IRF4T95R showed increased affinity for an ISRE, two AICEs, and an EICE site. (D) Fractions of all bound SiR-HaloTag- IRF4WT and IRF4T95R molecules (left) and molecules long bound for >2 s (right) as determined by single-molecule fluorescence microscopy with interlaced time-lapse illumination. (E) HEK293 cells were transfected with control plasmid (−), IRF4WT, or IRF4T95R. Nuclear extracts were analyzed by EMSA using 3xGAAA ISRE. Supershifts (ss) of WT and T95R extracts using HA-tag antibody or IgG control are shown at the far right. Note that IRF4T95R binds more strongly to ISRE compared with IRF4WT. Dashed lines indicate cuts of the scan for presentation. (F) Top: IRF4WT (left) and IRF4T95R (right) motifs found in the HT-SELEX data. Bottom: 8-nucleotide oligomer containing GAAA (left) or GATA (right) enriched in IRF4WT (x axis) or IRF4T95R (y axis). (G) 293T cells were transfected with a TK-cypridina luciferase vector (an internal control) and either a canonical (ISRE)1–driven luciferase vector (top) or a noncanonical (ISRE)1–driven luciferase vector (bottom), together with a pFLAG-CMV empty vector (400 ng) or increasing amounts of plasmids encoding IRF4WT or IRF4T95R. The luciferase activity was compared with that induced by the empty vector, which was set to 1. Mean ± SD of two to four independent experiments is shown. (H) ChIP-seq analysis of immortalized B cells from P3 compared with a HC. Top left: overlay of IRF4 ChiP-seq peaks in EBV-B cells of P3 and HC. From left to right: ISRE, AICE, and EICE motifs found in IRF4T95R, IRF4WT, AICE, or EICE ChIP-seq data (indicated at the left of the motifs). The importance of each motif toward the IRF4T95R-specific (purple), IRF4WT-specific (green), or common (gray) component of the ChIP-seq data is shown to the right of each motif. Noncanonical motifs are surrounded by a purple line. (I) Normalized IRF4WT-specific (green, top), common (gray, middle), and IRF4T95R-specific (purple, bottom) ChIP-seq peak counts (y axis) for different groups of differentially expressed genes. (J) HEK293 cells were transfected with AP-1 (JUNB and BATF) with or without IRF4WT or IRF4T95R, as indicated. Nuclear extracts were analyzed for binding to various CXCL13 sites, as indicated. Note that IRF4T95R shows strongly increased (CXCL13-A) or exclusive (CXCL13-C) binding compared with IRF4WT. (K) HEK293 cells were transfected with CXCL13 reporter construct encompassing CXCL13 sites A and B together with AP-1 (JUNB and BATF) and IRF4 variants, as indicated. Luciferase activity is shown as fold activation compared with control transfected cells (far left), which is set as 1. Mean ± SD of three independent experiments is shown. (L) FC of CXCL13 levels in serum or plasma from P3 to P7 compared with HC. Statistical significance was determined by one-tailed Welch’s t test (A, B, D, and G) and by Tukey’s post hoc test (K). *P < 0.05, **P < 0.01, and ****p < 0.0001.

References

    1. Tangye SG, Al-Herz W, Bousfiha A, Cunningham-Rundles C, Franco JL, Holland SM, Klein C, Morio T, Oksenhendler E, Picard C, Puel A, Puck J, Seppänen MRJ, Somech R, Su HC, Sullivan KE, Torgerson TR, Meyts I, Human inborn errors of immunity: 2022 Update on the classification from the international union of immunological societies expert committee. J. Clin. Immunol 42, 1473–1507(2022). - PMC - PubMed
    1. Meyts I, Bousfiha A, Duff C, Singh S, Lau YL, Condino-Neto A, Bezrodnik L, Ali A, Adeli M, Drabwell J, Primary immunodeficiencies: A decade of progress and a promising future. Front. Immunol 11, 625753 (2020). - PMC - PubMed
    1. Mittrücker HW, Matsuyama T, Grossman A, Kündig TM, Potter J, Shahinian A, Wakeham A, Patterson B, Ohashi PS, Mak TW, Requirement for the transcription factor LSIRF/IRF4 for mature B and T lymphocyte function. Science 275, 540–543 (1997). - PubMed
    1. Tamura T, Yanai H, Savitsky D, Taniguchi T, The IRF family transcription factors in immunity and oncogenesis. Annu. Rev. Immunol 26, 535–584 (2008). - PubMed
    1. Agnarelli A, Chevassut T, Mancini EJ, IRF4 in multiple myeloma-Biology, disease and therapeutic target. Leuk. Res 72, 52–58 (2018). - PubMed